 Duplex
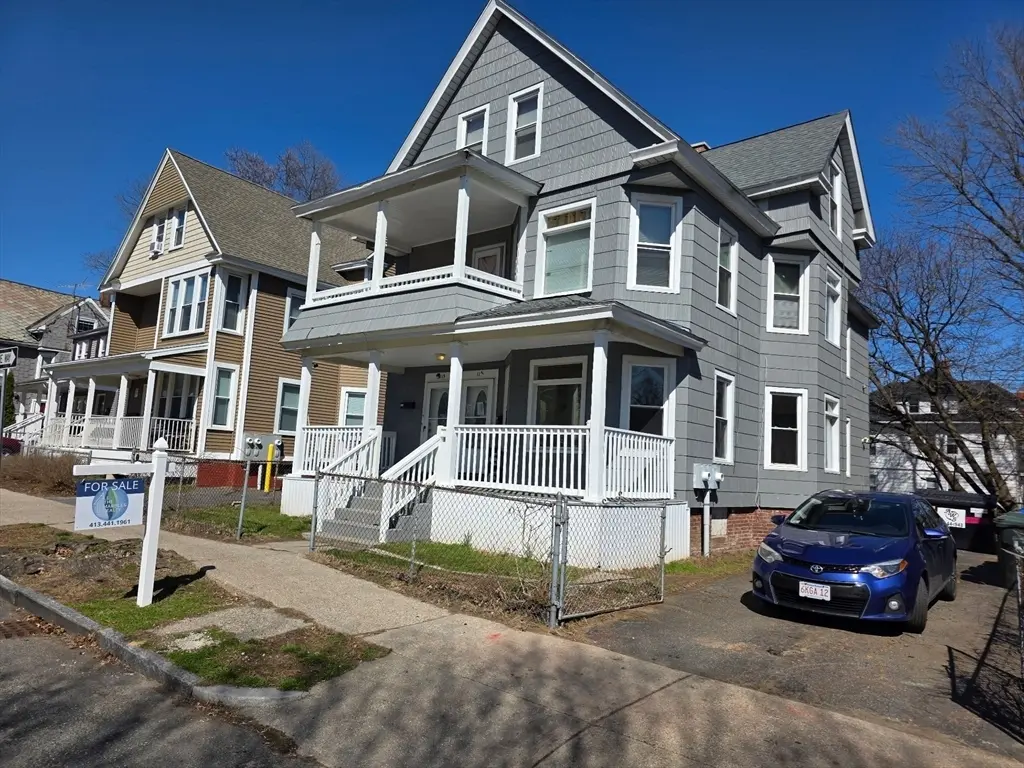
115-117 Northampton Ave · Springfield, MA
Flood risk No data
- FEMA flood zone
- —
- Chance of flooding over 30 yrs
- —
- Est. flood insurance / yr
- —
Fire risk No data
- Est. fire insurance / yr
- —
Heat risk No data
- Hot days now (above threshold)
- —
- Hot days in 30 yrs
- —
Wind risk No data
- Chance of severe wind over 30 yrs
- —
Air-quality risk No data
- Unhealthy air days now
- —
- Unhealthy air days in 30 yrs
- —
Risk factors via First Street. Map © Google.
Why this score? — see what drove the D grade
The composite is a weighted blend of 9 inputs, each scored 0–100. Each bar is that input's sub-score; the figure is the points it added to the 100-point composite (weight × sub-score).
- Cash flow +20.2/30.0
- DSCR +6.4/10.0
- 1% rule +5.3/10.0
- Condition / age +3.8/5.0
- Livability +3.7/5.0
- Rent growth +2.5/5.0
- Schools +1.6/10.0
- ARV discount +0.0/15.0
- Appreciation +0.0/10.0
$415,900
🖨 Deal sheet 📄 Offer letter ✓ Due diligence
Multi-family units
County records classify this as Multi-Family (2-4 Unit). Listing-text estimate: 2 units. confirmed
Listing remarks MLS
Well maintained, this 8 bedroom, two bathroom duplex is ideal for owner occupants or investors. New Roof (April 2026), freshly painted exterior & interior (fall 2025), and lovely architectural details - like coffered ceilings, hardwood floors, bay windows, built-in shelves, and pocket doors - create an inviting home. The downstairs is ready for immediate occupancy. EACH unit has two floors of living space. Floor 1: two bedrooms, kitchen, pantry, living, dining and bathrooms. Floor 2: two additional bedrooms. Upstairs tenant has strong payment history, rent is $2,200 monthly. Value-adds include: Letter of Full Deleading Compliance for BOTH units, ample storage in basement, separate utilities and washer/dryer hook-ups; off-street parking, front, rear, and second floor porches. Walk to: Gunn Playground, Springfield &American International Colleges & various restaurants and shops. Short drive to Springfield Technical Community College and downtown Springfield. Agent related to seller.
Key facts
- Coffered ceilings
- Bay windows
- New roof
Tags
Neighborhood map
What this means for you Summary
Snapshot
- This is a 2 × 4-bed/1.0-bath units multifamily listed at $416k. Condition is rated good.
Deal economics
- At list price, monthly cash flow is $526 ($6k/yr) — positive. Per door: $263/mo.
- The deal already cash-flows at list — no discount required.
- Meets the 1% rule at list price ($4k rent vs $416k).
- Recommended offer: $391k (6.0% below list) — sets the bar for market timing.
- Cap rate 7.8% vs local median 5.1% in Springfield — top-decile yield for the area; either an underpriced asset or a hidden risk that comps aren't pricing in. Stress-test before assuming the spread holds.
Location & tenants
- Location reads 73/100 on livability (#97 in MA) — a middle-class / working-renter tenant base. Strengths: commute A+, health & safety A+, amenities A; Watch: schools D, crime F, employment D-.
- Springfield (urban): math 13% / reading 25% proficiency, ranked #296 of 302 in MA (top 98%) — low school quality limits family demand, transient renter base, plan for 1-2y turnover; 81% free/reduced lunch — lower-income household profile, screen leases tightly.
- Market conditions: 32 active listings in the ZIP; 453 units permitted in Hampden County in 2024 (116 in 5+ unit buildings).
- At $4,304/mo this rent would consume 107% of the median local household income ($48k/yr) (locally 1322% of renters already pay >50% of income on rent) — very limited rent-growth headroom before tenants either downsize or default.
Forward outlook
- Local home prices are declining (-3.0%/yr); year-one equity from $3k of loan paydown is wiped out by about $12k of value loss. Plan a longer hold.
- Hampden County population projected at +5% by 2050 — modest demand growth; plan on rents tracking national, not racing it.
Negotiation context
- It's been on market 88 days — a 6% lower offer ($391k) is reasonable based on typical stale-listing flexibility.
- 4 sale attempts since 26y ago with the ask held roughly flat each time — persistent listings suggest the price (not the market) is what's stuck; bring a comps-based counter.
- Current owner paid $27k; list at $416k implies a 1440% gain — meaningful room to come down on a strong offer.
Risks & watch-outs
- Watch-outs: built in 1909 — expect roof / HVAC / electrical / plumbing capex.
Questions for the listing agent
- It's been on market 88 days. Have you received any prior offers? Is the seller open to a 6% concession, seller financing, or rate buy-down credit?
- Can we see the unit-by-unit rent roll, current vacancy, and any below-market leases? What's the average tenancy length?
- What capital expenditures (roof, boiler, parking lot, exteriors) have been made in the last 5 years, and what's planned in the next 2?
- Built in 1909 — when were the roof, HVAC, electrical panel, plumbing, and water heater last replaced?
- Why hasn't it sold? Are there any deal-killer items the seller is aware of (foundation, flood, title, zoning, code violations)?
- Is there a deadline driving the sale (1031 exchange, divorce, estate, relocation)? That informs how much negotiation room exists.
- Schools are D-rated, which usually means shorter tenancies and higher turnover. Who's the typical renter profile here, and what's been the actual vacancy rate?
- Crime grade is F in this area — have there been break-ins, vandalism, or insurance claims at this property in the last 3 years? What carrier currently insures it and at what premium?
- The area grade is low — what's the realistic commute time and amenity access for the typical tenant pool here? Any planned neighborhood developments (good or bad) we should know about?
- What's the average days-on-market for RENTAL listings here right now (not sales)? A rising rental-DOM trend means longer vacancies and softer asking-rent achievability than the comps imply.
- What's the recent tenant-quality profile in this submarket — average credit score on applications, eviction rate, late-payment / NSF rate, and stable-employment percentage? A property-management company in the area should have these aggregated.
- How much new apartment / multifamily construction is in the pipeline within 1–3 miles? Heavy new supply (>2% of stock underway) typically softens rents 12–24 months out; light construction supports rent growth.
Investment metrics
- 1% rule
- 1.03% ✓
- Cap rate
- 7.81%
- Cash-on-cash
- 5.42%
- DSCR
- 1.24
- GRM
- 8.1
CMA / ARV
- ARV (median comp)
- $326,440
- List price
- $415,900
- Delta
- 27.40%
- Verdict
- OVERPRICED
- Comps
- 20 within 1.0 mi
Show comp detail 12 sales within ~0.75 mi
| Address | Dist | Beds/Ba | Sqft | Sold | Price | $/sf | Match |
|---|---|---|---|---|---|---|---|
| 42-44 Suffolk St | 0.42mi | 8/2.0 | 2,894 (-0%) | 11mo | $390,000 | $135 | 71 |
| 53-55 Andrew St | 0.40mi | 8/3.0 | 3,022 (+4%) | 7mo | $400,000 | $132 | 65 |
| 28-30 Nelson Ave | 0.47mi | 8/2.0 | 2,717 (-6%) | 6mo | $310,000 | $114 | 63 |
| 46-48 Suffolk St | 0.42mi | 9/2.0 (+1) | 2,661 (-8%) | 2mo | $455,000 | $171 | 60 |
| 62-64 Bristol St | 0.45mi | 8/3.0 | 3,139 (+8%) | 3mo | $410,000 | $131 | 59 |
| 184 King St | 0.35mi | 8/2.0 | 2,720 (-6%) | 18mo | $450,000 | $165 | 58 |
| 124-126 Westford Cir | 0.28mi | 8/3.0 | 3,320 (+14%) | 2mo | $344,900 | $104 | 58 |
| 148-150 Oak Grove Ave | 0.58mi | 7/3.0 (-1) | 2,897 (-0%) | 8mo | $320,000 | $110 | 57 |
| 52-56 Andrew St | 0.39mi | 8/3.0 | 3,247 (+12%) | 3mo | $185,000 | $57 | 55 |
| 600 Union St | 0.50mi | 8/3.0 | 2,527 (-13%) | 15mo | $200,000 | $79 | 39 |
| 43 Colonial Ave | 0.52mi | 7/4.0 (-1) | 2,514 (-13%) | 6mo | $230,000 | $91 | 36 |
| 29 King St | 0.63mi | 9/3.0 (+1) | 3,300 (+14%) | 11mo | $450,000 | $136 | 30 |
Match score weights: distance 35% · size 25% · config 20% · recency 20%. Top-matched comps best support the ARV.
Projected returns pro-forma
-3.0% appreciation · 3.0% rent growth · sell at horizon
- IRR
- -7.9%
- Equity multiple
- 0.71×
- Total profit
- $-33,830
- Equity at exit
- $62,012
- IRR
- 1.7%
- Equity multiple
- 1.12×
- Total profit
- $13,941
- Equity at exit
- $35,959
Cash invested: $116,452 (down + closing). Projections, not guarantees.
Landlord ↔ Tenant lean methodology
- Overall (STATE)
- 20 Strongly Tenant-Friendly
- State Massachusetts
- 20 Strongly Tenant-Friendly · D+15
- County
- — inherits STATE
- City
- — inherits STATE
ZIP-level market 01109
- Home prices YoY
- -22.8%
- Active inventory
- 32
- Price-to-rent
- 16.1×
Monthly cashflow live
- Estimated rent
- $4,304 high interval (Pro) →
- Mortgage (P&I)
- −$2,181
- Tax est. 1.5%
- −$520 /mo · $6,238/yr
- Insurance
- −$173
- HOA
- −$0
- Vacancy / Maint / Mgmt
- −$904
- Net cashflow
- $526
Break-even live
2-unit breakdown (identical units grouped — click to expand)
| Units | Beds | Baths | Est. rent |
|---|---|---|---|
| 2× units | 4 | 1 | $4,304 |
| #1 | 4 | 1 | $2,152 |
| #2 | 4 | 1 | $2,152 |
| Total (2 units) | $4,304 | ||
UW: 25.0% down · 7.5% · 30yr · 1.5% tax · 5.0% vac · 8.0% maint · 8.0% mgmt
Financing live
Cash to close
- Down payment
- $103,975
- Closing costs
- $12,477
- Reserves months
- —
- Total cash needed
- —
Loan-product check · same deal, 3 products live
Conventional
25% down · 7.5% · 30yr
- Down + closing
- —
- Monthly P&I
- —
- Monthly cashflow
- —
- DSCR
- —
- Eligible?
- —
Personal DTI + credit; lowest rate.
DSCR
20% down · 8.5% · 30yr
- Down + closing
- —
- Monthly P&I
- —
- Monthly cashflow
- —
- DSCR
- —
- Eligible?
- —
No personal income docs; deal must DSCR.
Hard money
10% down · 12.0% · 12mo
- Down + closing
- —
- Monthly P&I
- —
- Monthly cashflow
- —
- DSCR
- —
- Eligible?
- —
Short-term bridge; refi at stabilization.
Listing history 24 events
-
2026-06-18days on market $415,900 Active 88 DOM
-
2026-06-17days on market $415,900 Active 87 DOM
-
2026-06-16days on market $415,900 Active 86 DOM
-
2026-06-15days on market $415,900 Active 85 DOM
-
2026-06-14days on market $415,900 Active 83 DOM
-
2026-06-13days on market $415,900 Active 82 DOM
-
2026-06-10days on market $415,900 Active 80 DOM
-
2026-06-09days on market $415,900 Active 79 DOM
-
2026-06-08days on market $415,900 Active 78 DOM
-
2026-06-07days on market $415,900 Active 77 DOM
-
2026-06-05days on market $415,900 Active 74 DOM
-
2026-06-03days on market $415,900 Active 73 DOM
-
2026-06-02days on market $415,900 Active 72 DOM
-
2026-06-01days on market $415,900 Active 71 DOM
-
2026-05-31days on market $415,900 Active 70 DOM
-
2026-05-30days on market $415,900 Active 69 DOM
-
2026-05-13price $415,900 1007-char remark
Show marketing remark (1007 chars)
Well maintained, this 8 bedroom, two bathroom duplex is ideal for owner occupants or investors. New Roof (April 2026), freshly painted exterior & interior (fall 2025), and lovely architectural details - like coffered ceilings, hardwood floors, bay windows, built-in shelves, and pocket doors - create an inviting home. The downstairs is ready for immediate occupancy. EACH unit has two floors of living space. Floor 1: two bedrooms, kitchen, pantry, living, dining and bathrooms. Floor 2: two additional bedrooms. Upstairs tenant has strong payment history, rent is $2,200 monthly. Value-adds include: Letter of Full Deleading Compliance for BOTH units, ample storage in basement, separate utilities and washer/dryer hook-ups; off-street parking, front, rear, and second floor porches. Walk to: Gunn Playground, Springfield &American International Colleges & various restaurants and shops. Short drive to Springfield Technical Community College and downtown Springfield. Agent related to seller.
-
2026-03-22$425,900 New 1007-char remark
Show marketing remark (1007 chars)
Well maintained, this 8 bedroom, two bathroom duplex is ideal for owner occupants or investors. New Roof (April 2026), freshly painted exterior & interior (fall 2025), and lovely architectural details - like coffered ceilings, hardwood floors, bay windows, built-in shelves, and pocket doors - create an inviting home. The downstairs is ready for immediate occupancy. EACH unit has two floors of living space. Floor 1: two bedrooms, kitchen, pantry, living, dining and bathrooms. Floor 2: two additional bedrooms. Upstairs tenant has strong payment history, rent is $2,200 monthly. Value-adds include: Letter of Full Deleading Compliance for BOTH units, ample storage in basement, separate utilities and washer/dryer hook-ups; off-street parking, front, rear, and second floor porches. Walk to: Gunn Playground, Springfield &American International Colleges & various restaurants and shops. Short drive to Springfield Technical Community College and downtown Springfield. Agent related to seller.
-
2011-03-25soldstatus $27,000 109-char remark
Show marketing remark (109 chars)
2 Family home with 2 apartments updown styel. 2nd floor apt has attic access. Homepath Renovation property.
-
2010-09-12$35,000 109-char remark
Show marketing remark (109 chars)
2 Family home with 2 apartments updown styel. 2nd floor apt has attic access. Homepath Renovation property.
-
2006-03-10soldstatus $160,000
-
2006-01-09$160,000
-
2001-06-29soldstatus $73,900
-
2000-08-18$74,900
ⓘ Source: listings_history table (triggers on properties + properties_extension) + one-shot
backfill from property_details.listing_events for pre-trigger history.
Nearby sold comps map
Loading sold comps map…
Walkable amenities ~0.75 mi
Loading nearby amenities…
Taxation est. · year 1
- Rental income
- $51,648
- − Mortgage interest
- −$23,297
- − Property taxes
- −$6,238
- − Insurance
- −$2,080
- − Repairs & maintenance
- −$4,132
- − Management
- −$4,132
- − Depreciation
- −$12,099
- Taxable loss
- −$329
- Est. tax savings @ 24.0%
- +$79
- After-tax cash flow
- $6,391/yr
For passive investors: Depreciation is non-cash, so a rental often shows a tax loss while cash-flowing — sheltering income. Rental losses are passive: they offset passive income freely, and up to $25,000/yr can offset ordinary (W-2) income if you actively participate and your MAGI is under $100k (phasing out to $0 by $150k); unused losses carry forward. On sale, claimed depreciation is recaptured at up to 25%, and gains may owe capital-gains tax (a 1031 exchange can defer both). Figures are a year-1 estimate at your 24.0% rate — not tax advice; consult a CPA.
Condition & rehab AI · 12 photos
This well-maintained, two-unit duplex is ready for immediate occupancy. Freshly painted exterior and interior, coffered ceilings, hardwood floors, and bay windows create an inviting home. Value-adds include letter of full deleading compliance and ample storage in the basement.
Value-add opportunities
- Both Paint exterior and interior — Freshly painted exterior and interior enhance curb appeal and interior aesthetics
- Both Replace light fixtures — Modernize lighting to improve ambiance and energy efficiency
- Both Install smart home devices — Enhance convenience and energy efficiency for both residents and potential buyers
Renovation cost estimate screening
Value-add ROI direction
- Both Paint exterior and interior — Freshly painted exterior and interior enhance curb appeal and interior aesthetics ↑
- Both Replace light fixtures — Modernize lighting to improve ambiance and energy efficiency ↑
- Both Install smart home devices — Enhance convenience and energy efficiency for both residents and potential buyers ↑
ⓘ Cost ranges are severity-bucket heuristics (US national rule-of-thumb). Get contractor quotes + a written scope before underwriting a rehab budget.
Schools (NCES district)
- District
- Springfield
- NCES district ID
- 2511130
- Math proficiency
- 13% ▼ -12.00%
- Reading proficiency
- 25% ▼ -5.00%
- Median HH income
- $34,938
- Composite
- 15.6/100
- National rank
- #9293
- State rank
- #296 of 302 in MA
Livability — Springfield
- Score
- 73/100
- State rank
- #97
- US rank
- #5195
Category grades
Schools grade is shown separately in the Schools card above.
Census & demographics
- Census place
- Springfield, MA
- County
- Hampden County · 230,965 people
- City population
- 61,006
- Metro
- Springfield, MA
- Population (ZIP)
- 31,124
- Household income
- $48,415
- Rent vs Own
- Severe rent burden
- 1322.0
Population outlook (Hampden County) Hauer SSP2
- Today (2025)
- 485,646 people
- By 2030
- 491,517 · +1.2%
- By 2040
- 500,539 · +3.1%
- By 2050
- 508,827 · +4.8%
- By 2075
- 539,167 · +11.0%
- By 2100
- 545,698 · +12.4%
Race, ethnicity, and origin ACS 2023
- Neighborhood character
- Diverse neighborhood (Simpson 0.67)
- Race & ethnicity
- Hispanic / Latino 45% Black 31% Two or more races 20% White 18% Asian 1% Native American 1%
- Hispanic origin (detail)
- Puerto Rican 39% Dominican 3%
- Common ancestry
- Lithuanian 2% Romanian 1%
- Foreign-born
- 9% · Canada, China
- Languages at home
- 65% English-only · Spanish 32% Other Asian/Pacific 1% Russian/Polish/Slavic 1%
Political lean MEDSL · Hampden
- 2024 margin
- Lean D (+8.9) · D 53.4% · R 44.5% · Other 2.1%
- 2008→2024 swing
- -16.4pp toward R · 2008: 25.3pp · 2024: 8.9pp
- All cycles
- 2024: D+8.9 2020: D+17.7 2016: D+16.0 2012: D+25.4 2008: D+25.3
Not yet ingested
- Civics
- —
Market trends
- HPI YoY
- ▼ -113.11%
- Current HPI
- 382.9038
- Rent YoY
- —
- Metro
- Springfield, MA
- State GDP YoY
- ▲ 2.28%
- F500 in state
- 38
Industry mix (Fortune 500 HQ in MA)
| Industry | F500 HQs | Revenue |
|---|---|---|
| Technology | 3 | $17B |
|
||
| Insurance | 2 | $84B |
|
||
| Retail | 2 | $76B |
|
||
| Life Sciences | 1 | $43B |
|
||
| Energy Technology | 1 | $31B |
|
||
| Aerospace / Defense | 1 | $18B |
|
||
Price history
+455.3% since first listed8 events — show timeline
- 2026-05-13 Price Changed $415,900 MLS PIN
- 2026-03-22 Listed $425,900 MLS PIN
- 2011-03-25 Sold (MLS) $27,000 MLS PIN
- 2010-09-12 Listed $35,000 MLS PIN
- 2006-03-10 Sold (MLS) $160,000 MLS PIN
- 2006-01-09 Listed $160,000 MLS PIN
- 2001-06-29 Sold (MLS) $73,900 MLS PIN
- 2000-08-18 Listed $74,900 MLS PIN
Cash-flow waterfall
monthlySold comps — $/sqft
last 12 mo · ≤1 miLoading sold comps…