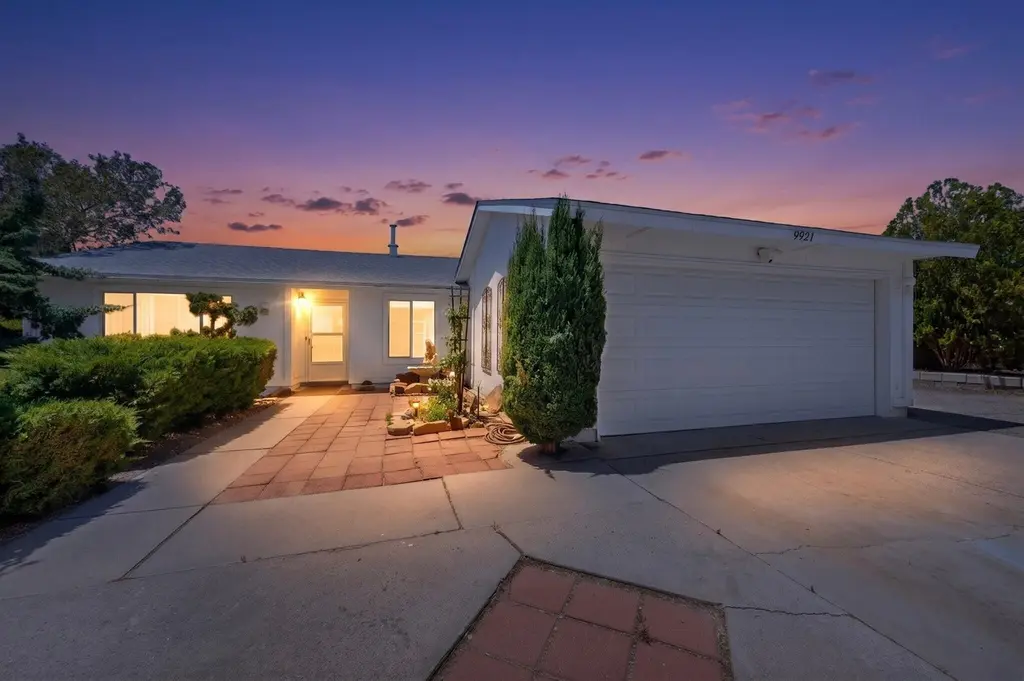
9921 Plunkett Dr NW · Paradise Hills, NM
Flood risk 1/10 · Minimal
- FEMA flood zone
- X (unshaded)
- Chance of flooding over 30 yrs
- 0.0%
- Est. flood insurance / yr
- $507 – $1,088
Fire risk 3/10 · Minor
- Est. fire insurance / yr
- $706 – $1,312
Heat risk 4/10 · Minor
- Hot days now (above 96°F)
- 7 days/yr
- Hot days in 30 yrs
- 18 days/yr
Wind risk 1/10 · Minimal
- Chance of severe wind over 30 yrs
- —
Air-quality risk 3/10 · Minor
- Unhealthy air days now
- 3 days/yr
- Unhealthy air days in 30 yrs
- 4 days/yr
Risk factors via First Street. Map © Google.
Why this score? — see what drove the D grade
The composite is a weighted blend of 9 inputs, each scored 0–100. Each bar is that input's sub-score; the figure is the points it added to the 100-point composite (weight × sub-score).
- Cash flow +14.1/30.0
- ARV discount +7.5/15.0
- Schools +5.3/10.0
- DSCR +4.3/10.0
- Livability +3.3/5.0
- 1% rule +2.8/10.0
- Condition / age +2.5/5.0
- Rent growth +1.9/5.0
- Appreciation +0.0/10.0
$310,000
🖨 Deal sheet (PDF) 📄 Offer letter ✓ Due diligence
Listing remarks
Come discover all the possibilities this 3-bedroom, 2-bath home with a 2-car garage has to offer! Situated on a generous . 33+/- acre lot near Paradise Hills Park and the Paradise Hills Community Center, this property provides space, flexibility, and room to grow. With approximately 1,532+/- sq. ft. plus an additional bonus room of approximately 375+/- sq. ft. , there is plenty of opportunity to make it your own. The backyard features side yard access, three sheds including one with a workshop area, fruit trees, and room for gardening. Enjoy the screened-in patio and private outdoor spaces ready for your personal touches and YOUR vision of what HOME SWEET HOME is to YOU!
Key facts
- Generous acre lot
- Workshop area
- Three sheds
Tags
Property features AI
Exterior
- Parking: Attached garage with garage door opener; 2 garage spaces
- Security: Smart cameras recording
- Utilities: Electricity connected; Natural gas connected; Public sewer; Public water
- Home design: Single-story home; Faces northeast; Resale property
- Construction: Pitched shingle roof; Built according to public records (year built source: public records)
- Exterior features: Private yard; Covered patio; Patio; Shed(s); Wall fencing; Many trees; Smart cameras recording
Interior
- Kitchen: Dishwasher; Free-standing electric range; Range hood; Refrigerator
- Bedrooms: Primary bedroom on the main level
- Flooring: Carpet-free areas; Laminate flooring; Tile flooring
- Bathrooms: 1 full bathroom; 1 three-quarter bathroom
- Heating & cooling: Forced air heating; Evaporative cooling
- Interior features: Kitchen island; Multiple living areas; Main level primary bedroom; Shower-only bathroom with separate shower
- Laundry & utility: Washer; Dryer; Electric dryer hookup
Neighborhood map
What this means for you Summary
Snapshot
- This is a 3-bed/2.0-bath other listed at $310k.
Deal economics
- At list price, monthly cash flow is $45 ($538/yr) — positive.
- The deal already cash-flows at list — no discount required.
- To meet the 1% rule (rent ≥ 1% of price), the offer needs to be $241k (22.3% below list).
- Recommended offer: $241k (22.3% below list) — sets the bar for 1% rule.
Location & tenants
- Location reads 66/100 on livability (#41 in NM) — a middle-class / working-renter tenant base. Strengths: housing A+, cost of living A; Watch: crime C-, employment D+, amenities F.
- Albuquerque Public Schools (urban): math 51% / reading 75% proficiency, ranked #3 of 29 in NM (top 10%) — acceptable for families but not a draw, mixed tenant base, ~2y average lease; 60% free/reduced lunch — lower-income household profile, screen leases tightly.
- Zoned schools: Sierra Vista Elementary (448 students, 100% FRL); James Monroe Middle (689 students, 45% FRL); Cibola High (math 37% / reading 72%, grade C-, #34 of 110 statewide, top 31%, 1,762 students, 34% FRL) — zoned schools at 60% FRL track the district average.
- Market conditions: Rents soft (-2.5%/yr); 347 active listings in the ZIP; 21 comparable units currently listed for rent nearby; rentals at typical pace (median 26d on market — plan ~3-4 weeks tenant-placement turnaround); solid renter incomes; 1,316 units permitted in Bernalillo County in 2024 (546 in 5+ unit buildings).
- This rent runs 34% of the median local income ($84k/yr) — at the standard rent-burdened threshold; future hikes will face affordability resistance.
Forward outlook
- Local home prices are declining (-3.0%/yr); year-one equity from $2k of loan paydown is wiped out by about $9k of value loss. Plan a longer hold.
Negotiation context
- Only 7 days on market — expect competitive offers; lowballing is unlikely to land.
Questions for the listing agent
- Built in 1976 — when were the roof, HVAC, electrical panel, plumbing, and water heater last replaced?
- Is there a deadline driving the sale (1031 exchange, divorce, estate, relocation)? That informs how much negotiation room exists.
- Schools are B-rated — typically a magnet for longer-tenancy family renters. What's the average tenant stay here, and is there a school-zone premium baked into asking?
- The area grade is low — what's the realistic commute time and amenity access for the typical tenant pool here? Any planned neighborhood developments (good or bad) we should know about?
- What's the average days-on-market for RENTAL listings here right now (not sales)? A rising rental-DOM trend means longer vacancies and softer asking-rent achievability than the comps imply.
- What's the recent tenant-quality profile in this submarket — average credit score on applications, eviction rate, late-payment / NSF rate, and stable-employment percentage? A property-management company in the area should have these aggregated.
- How much new for-sale + rental construction is in the pipeline within 1–3 miles? Heavy new supply typically softens prices + rents 12–24 months out; constrained supply supports both.
Investment metrics
- 1% rule
- 0.78% ✗
- Cap rate
- 6.47%
- Cash-on-cash
- 0.62%
- DSCR
- 1.03
- GRM
- 10.7
CMA / ARV
No comps found within radius.
Projected returns pro-forma
-3.0% appreciation · 0.0% rent growth · sell at horizon
- IRR
- -18.3%
- Equity multiple
- 0.37×
- Total profit
- $-54,578
- Equity at exit
- $46,222
- IRR
- -17.0%
- Equity multiple
- 0.17×
- Total profit
- $-71,704
- Equity at exit
- $26,803
Cash invested: $86,800 (down + closing). Projections, not guarantees.
Landlord ↔ Tenant lean methodology
- Overall (STATE)
- 55 Moderately Landlord-Leaning
- State New Mexico
- 55 Moderately Landlord-Leaning · D+3
- County
- — inherits STATE
- City
- — inherits STATE
ZIP-level market 87114
- Rents YoY
- -2.5%
- Active inventory
- 347
- Price-to-rent
- 10.7×
Monthly cashflow live
- Estimated rent
- $2,410 high interval (Pro) →
- Mortgage (P&I)
- −$1,626
- Tax from tax record
- −$104 /mo · $1,252/yr
- Insurance
- −$129
- HOA
- −$0
- Vacancy / Maint / Mgmt
- −$506
- Net cashflow
- $45
Break-even live
Sensitivity live
| Price | -10% $220 | -5% $133 | +0% $45 | +5% $-43 | +10% $-131 |
|---|---|---|---|---|---|
| Rent | -10% $-146 | -5% $-50 | +0% $45 | +5% $140 | +10% $235 |
| Rate | -1.0pp $201 | -0.5pp $124 | base $45 | +0.5pp $-35 | +1.0pp $-117 |
UW: 25.0% down · 7.5% · 30yr · 1.5% tax · 5.0% vac · 8.0% maint · 8.0% mgmt
Financing live
Cash to close
- Down payment
- $77,500
- Closing costs
- $9,300
- Reserves months
- —
- Total cash needed
- —
Loan-product check · same deal, 3 products live
Conventional
25% down · 7.5% · 30yr
- Down + closing
- —
- Monthly P&I
- —
- Monthly cashflow
- —
- DSCR
- —
- Eligible?
- —
Personal DTI + credit; lowest rate.
DSCR
20% down · 8.5% · 30yr
- Down + closing
- —
- Monthly P&I
- —
- Monthly cashflow
- —
- DSCR
- —
- Eligible?
- —
No personal income docs; deal must DSCR.
Hard money
10% down · 12.0% · 12mo
- Down + closing
- —
- Monthly P&I
- —
- Monthly cashflow
- —
- DSCR
- —
- Eligible?
- —
Short-term bridge; refi at stabilization.
Rent comps 21 comps
| Address | Beds | Baths | Sqft | Rent | $/sqft | DOM | Units | Dist |
|---|---|---|---|---|---|---|---|---|
| 5832 Avenida La Barranca NW Albuquerque, NM | 4.0 | 3.0 | 2554 | $2,600 | $1.02 | 4d | 1 | 0.35mi |
| 9719 Calle Chamisa NW Albuquerque, NM | 4.0 | 2.5 | 2264 | $2,700 | $1.19 | 45d | 1 | 0.45mi |
| 9520 Andesite Dr NW Albuquerque, NM | 4.0 | 2.0 | 2166 | $2,800 | $1.29 | 45d | 1 | 0.51mi |
| 6512 Los Pueblos Pl NW Albuquerque, NM | 3.0 | 2.5 | 1865 | $2,350 | $1.26 | 16d | 1 | 0.57mi |
| 6202 Sierra Nevada Cir NW Albuquerque, NM | 4.0 | 3.0 | 2625 | $2,700 | $1.03 | 25d | 1 | 0.59mi |
| 6619 Binbrook Rd NW Albuquerque, NM | 3.0 | 2.0 | 1800 | $2,299 | $1.28 | 45d | 1 | 0.71mi |
| 6612 Piedra Quemada Rd NW Albuquerque, NM | 4.0 | 2.5 | 2253 | $2,650 | $1.18 | 4d | 1 | 0.80mi |
| 10439 Calle Acanta NW Albuquerque, NM | 3.0 | 2.0 | 1600 | $2,100 | $1.31 | 25d | 1 | 0.80mi |
| 5619 Blue Feather Ave NW Albuquerque, NM | 2.0 | 2.0 | 1800 | $2,200 | $1.22 | 16d | 1 | 0.81mi |
| 10339 Vendaval Ave NW Albuquerque, NM | 4.0 | 2.5 | 2100 | $2,350 | $1.12 | 5d | 1 | 0.90mi |
| 5596 Timberfalls Rd NW Albuquerque, NM | 4.0 | 3.0 | 2462 | $2,300 | $0.93 | 25d | 1 | 0.94mi |
| 9816 Sierra Morena St NW Albuquerque, NM | 3.0 | 2.0 | 1800 | $2,300 | $1.28 | 45d | 1 | 0.96mi |
| 9408 Calico Pl NW Albuquerque, NM | 4.0 | 3.0 | 2900 | $2,900 | $1.00 | 25d | 1 | 1.02mi |
| 10416 Rosefinch Dr NW Albuquerque, NM | 3.0 | 2.5 | 1997 | $2,100 | $1.05 | 46d | 1 | 1.20mi |
| 9705 Allano Ct NW Albuquerque, NM | 3.0 | 2.5 | 2043 | $2,100 | $1.03 | 45d | 1 | 1.24mi |
| 6020 Canis Ave NW Albuquerque, NM | 3.0 | 2.5 | 2000 | $2,490 | $1.25 | 25d | 1 | 1.27mi |
| 10215 Marin Dr NW Albuquerque, NM | 4.0 | 2.0 | 1896 | $2,800 | $1.48 | 3d | 1 | 1.27mi |
| 6206 Nacional Rd NW Albuquerque, NM | 4.0 | 2.5 | 2269 | $2,300 | $1.01 | 21d | 1 | 1.38mi |
| 6115 Goldenseal Ct NW Albuquerque, NM | 3.0 | 2.5 | 2233 | $2,800 | $1.25 | 45d | 1 | 1.38mi |
| 6235 Contess Rd NW Albuquerque, NM | 3.0 | 2.0 | 1800 | $2,000 | $1.11 | 5d | 1 | 1.46mi |
| 7605 Kentwood Ave NW Albuquerque, NM | 3.0 | 2.0 | 1700 | $1,995 | $1.17 | 23d | 1 | 1.47mi |
Listing history 1 events
-
2026-05-20$310,000 Active
ⓘ Source: listings_history table (triggers on properties + properties_extension) + one-shot
backfill from property_details.listing_events for pre-trigger history.
Tax reassessment forecast NM · Resets to sale price
- Current annual tax
- $1,252 · $104/mo
- Projected year-2 tax
- $2,480 · $207/mo
- Expected delta
- +$1,228/yr (+$102/mo · 98.1%)
ⓘ Screening estimate from a state-policy table — verify with the county assessor before closing.
Climate risk First Street
- Flood 1/10 Low FEMA zone X (unshaded) · 0% chance over 30 yrs
- Wildfire 3/10 Moderate
- Heat 4/10 Moderate 7 d/yr ≥96°F today · 18 d/yr by 30 yrs out
- Wind 1/10 Low
- Air quality 3/10 Moderate 3 unhealthy d/yr today · 4 by 30 yrs out
Nearby sold comps map
Loading sold comps map…
Walkable amenities ~0.75 mi
Loading nearby amenities…
Taxation est. · year 1
- Rental income
- $28,922
- − Mortgage interest
- −$17,365
- − Property taxes
- −$1,252
- − Insurance
- −$1,550
- − Repairs & maintenance
- −$2,314
- − Management
- −$2,314
- − Depreciation
- −$9,018
- Taxable loss
- −$4,891
- Est. tax savings @ 24.0%
- +$1,174
- After-tax cash flow
- $1,712/yr
For passive investors: Depreciation is non-cash, so a rental often shows a tax loss while cash-flowing — sheltering income. Rental losses are passive: they offset passive income freely, and up to $25,000/yr can offset ordinary (W-2) income if you actively participate and your MAGI is under $100k (phasing out to $0 by $150k); unused losses carry forward. On sale, claimed depreciation is recaptured at up to 25%, and gains may owe capital-gains tax (a 1031 exchange can defer both). Figures are a year-1 estimate at your 24.0% rate — not tax advice; consult a CPA.
Schools (NCES district)
- District
- Albuquerque Public Schools
- NCES district ID
- 3500060
- Math proficiency
- 51% ▲ 30.00%
- Reading proficiency
- 75% ▲ 45.00%
- Median HH income
- $48,151
- Composite
- 53.29/100
- National rank
- #1487
- State rank
- #3 of 29 in NM
Livability — Paradise Hills
- Score
- 66/100
- State rank
- #41
- US rank
- #12024
Category grades
Schools grade is shown separately in the Schools card above.
Census & demographics
- Census place
- Paradise Hills, NM
- County
- Bernalillo County · 647,165 people
- Metro
- Albuquerque, NM
- Population (ZIP)
- 70,117
- Household income
- $84,277
- Rent vs Own
- Severe rent burden
- 2293.0
Population outlook (Bernalillo County) Hauer SSP2
- Today (2025)
- 704,528 people
- By 2030
- 711,723 · +1.0%
- By 2040
- 714,522 · +1.4%
- By 2050
- 709,274 · +0.7%
- By 2075
- 680,015 · -3.5%
- By 2100
- 619,879 · -12.0%
Race, ethnicity, and origin ACS 2023
- Neighborhood character
- Diverse neighborhood (Simpson 0.63)
- Race & ethnicity
- Hispanic / Latino 46% White 40% Two or more races 21% Native American 4% Black 4% Asian 2%
- Hispanic origin (detail)
- Mexican 23% Puerto Rican 1%
- Common ancestry
- Lithuanian 3% Romanian 2% Italian 2%
- Foreign-born
- 6% · Canada, China
- Languages at home
- 83% English-only · Spanish 13% Other Indo-European 1%
Political lean MEDSL · Bernalillo
- 2024 margin
- Strong D (+21.0) · D 59.2% · R 38.2% · Other 2.6%
- 2008→2024 swing
- -0.3pp no change · 2008: 21.4pp · 2024: 21.0pp
- All cycles
- 2024: D+21.0 2020: D+24.4 2016: D+17.8 2012: D+16.2 2008: D+21.4
Not yet ingested
- Civics
- —
Market trends
- HPI YoY
- ▼ -227.99%
- Current HPI
- 232.3689
- Rent YoY
- ▼ -2.45%
- Metro
- Albuquerque, NM
- State GDP YoY
- —
- F500 in state
- 0
Price history
1 event — show timeline
- 2026-05-20 Listed $310,000 Southwest MLS
Property tax history
+1.6%/yrLatest (2016): $1,252 · +3.3% YoY. Source: county tax records.
Cash-flow waterfall
monthlySold comps — $/sqft
last 12 mo · ≤1 miLoading sold comps…