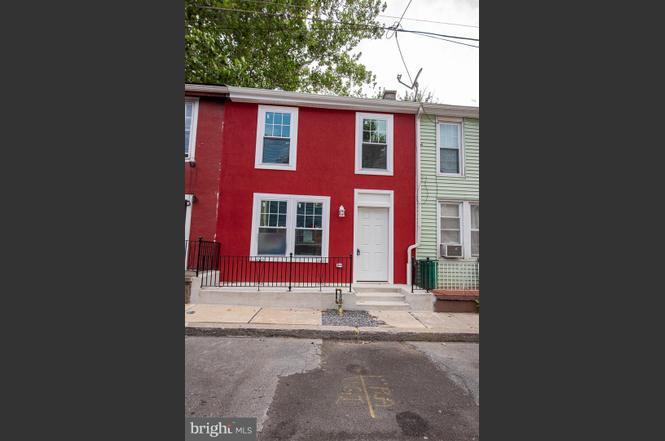
506 Beaver St · Lancaster, PA
Flood risk 1/10 · Minimal
- FEMA flood zone
- X (unshaded)
- Chance of flooding over 30 yrs
- 0.0%
- Est. flood insurance / yr
- $473 – $860
Fire risk 1/10 · Minimal
- Est. fire insurance / yr
- $511 – $949
Heat risk 6/10 · Moderate
- Hot days now (above 101°F)
- 7 days/yr
- Hot days in 30 yrs
- 15 days/yr
Wind risk 4/10 · Minor
- Chance of severe wind over 30 yrs
- 15.0%
Air-quality risk 4/10 · Minor
- Unhealthy air days now
- 4 days/yr
- Unhealthy air days in 30 yrs
- 7 days/yr
Risk factors via First Street. Map © Google.
Why this score? — see what drove the D+ grade
The composite is a weighted blend of 9 inputs, each scored 0–100. Each bar is that input's sub-score; the figure is the points it added to the 100-point composite (weight × sub-score).
- Cash flow +20.0/30.0
- DSCR +6.3/10.0
- ARV discount +4.7/15.0
- 1% rule +4.2/10.0
- Livability +4.2/5.0
- Rent growth +2.6/5.0
- Condition / age +2.5/5.0
- Schools +1.6/10.0
- Appreciation +0.0/10.0
$159,900
🖨 Deal sheet 📄 Offer letter ✓ Due diligence
Listing remarks MLS
* * CONDEMNED PROPERTY * * 15 YEAR DEED RESTRICTION APPLIES * * PROPERTY MUST BE OWNER OCCUPIED OR SOLD TO AN OWNER OCCUPANT WITHIN THE LANCASTER AREA 80% OF HUD MEDIAN INCOME. * * PROPERTY MAY ALSO A BE RENTAL * * IF RENTED TO A HOUSEHOLD WITH A MAX INCOME LIMIT OF LANCASTER AREA 60% OF HUD MEDIAN INCOME (MAX RENTAL LIMITS APPLY). BUYER MUST SHOW PROOF OF FUNDS SUFFICIENT TO PURCHASE AND REHAB THE PROPERTY AT THE TIME OF THE OFFER. NO LIENS ALLOWED ON THE PROPERTY FOR FINANCING. ALL OFFERS DUE BY 3 PM ON TUESDAY, 11/28/23. SOLD AS IS. PROPERTY WILL NOT BE CLEARED OUT. ALL PARTIES WHO SUBMIT OFFERS WILL NEED TO BE PRESENT AT THE CITY OF LANCASTER'S REDEVELOPMENT AUTHORITY PUBLIC BOARD MEETING ON 12/12/23 AT 5:15 PM.
Key facts
- Built 1880
- Listed 109 days
Neighborhood map
What this means for you Summary
Snapshot
- This is a 2-bed/1.0-bath townhouse listed at $160k.
Deal economics
- At list price, monthly cash flow is $195 ($2k/yr) — positive.
- The deal already cash-flows at list — no discount required.
- To meet the 1% rule (rent ≥ 1% of price), the offer needs to be $147k (8.2% below list).
- Recommended offer: $146k (9.0% below list) — sets the bar for market timing.
- Cap rate 7.8% vs local median 4.2% in Lancaster — top-decile yield for the area; either an underpriced asset or a hidden risk that comps aren't pricing in. Stress-test before assuming the spread holds.
Location & tenants
- Location reads 85/100 on livability (#71 in PA, #498 nationally) — a professional / high-income tenant draw. Strengths: amenities A+, commute A+, cost of living A+; Watch: crime C-, employment C-.
- Lancaster SD (urban): math 12% / reading 25% proficiency, ranked #500 of 539 in PA (top 93%) — low school quality limits family demand, transient renter base, plan for 1-2y turnover; 72% free/reduced lunch — lower-income household profile, screen leases tightly.
- Market conditions: Rents flat; 292 active listings in the ZIP; 40 comparable units currently listed for rent nearby; rentals at typical pace (median 22d on market — plan ~3-4 weeks tenant-placement turnaround); solid renter incomes; 1,093 units permitted in Lancaster County in 2024 (201 in 5+ unit buildings).
Forward outlook
- Local home prices are declining (-3.0%/yr); year-one equity from $1k of loan paydown is wiped out by about $5k of value loss. Plan a longer hold.
- Lancaster County population projected at +5% by 2050 — modest demand growth; plan on rents tracking national, not racing it.
Negotiation context
- It's been on market 109 days — a 9% lower offer ($146k) is reasonable based on typical stale-listing flexibility.
- 8 sale attempts since 20y ago with the ask held roughly flat each time — persistent listings suggest the price (not the market) is what's stuck; bring a comps-based counter.
- Current owner paid $1; list at $160k implies a 15989900% gain — meaningful room to come down on a strong offer.
Risks & watch-outs
- Watch-outs: built in 1880 — expect roof / HVAC / electrical / plumbing capex.
- Climate carrying-cost: extreme-heat days projected 7→15/yr by 2055 (HVAC capex compounding) — expect insurance premiums to compound above CPI over the hold.
Questions for the listing agent
- It's been on market 109 days. Have you received any prior offers? Is the seller open to a 9% concession, seller financing, or rate buy-down credit?
- Built in 1880 — when were the roof, HVAC, electrical panel, plumbing, and water heater last replaced?
- Why hasn't it sold? Are there any deal-killer items the seller is aware of (foundation, flood, title, zoning, code violations)?
- Is there a deadline driving the sale (1031 exchange, divorce, estate, relocation)? That informs how much negotiation room exists.
- The area grade is low — what's the realistic commute time and amenity access for the typical tenant pool here? Any planned neighborhood developments (good or bad) we should know about?
- What's the average days-on-market for RENTAL listings here right now (not sales)? A rising rental-DOM trend means longer vacancies and softer asking-rent achievability than the comps imply.
- What's the recent tenant-quality profile in this submarket — average credit score on applications, eviction rate, late-payment / NSF rate, and stable-employment percentage? A property-management company in the area should have these aggregated.
- How much new for-sale + rental construction is in the pipeline within 1–3 miles? Heavy new supply typically softens prices + rents 12–24 months out; constrained supply supports both.
Investment metrics
- 1% rule
- 0.92% ✗
- Cap rate
- 7.75%
- Cash-on-cash
- 5.22%
- DSCR
- 1.23
- GRM
- 9.1
CMA / ARV
- ARV (on-the-fly)
- $150,450
- Comps found
- 12
Show comp detail 12 sales within ~0.75 mi
| Address | Dist | Beds/Ba | Sqft | Sold | Price | $/sf | Match |
|---|---|---|---|---|---|---|---|
| 506 Beaver St | 0.00mi | 3/1.0 (+1) | 850 (0%) | 0mo | $167,000 | $196 | 95 |
| 519-1/2 S Prince St | 0.04mi | 2/1.0 | 848 (-0%) | 4mo | $113,500 | $134 | 94 |
| 408 Prospect St | 0.54mi | 2/1.0 | 840 (-1%) | 1mo | $210,000 | $250 | 72 |
| 520 1/2 Green St | 0.26mi | 3/1.0 (+1) | 888 (+4%) | 9mo | $107,500 | $121 | 68 |
| 909 Union St | 0.56mi | 2/1.0 | 840 (-1%) | 6mo | $171,150 | $204 | 66 |
| 834 Wabank St | 0.45mi | 2/1.0 | 936 (+10%) | 0mo | $165,000 | $176 | 62 |
| 26 W Strawberry St | 0.60mi | 2/1.0 | 886 (+4%) | 4mo | $125,000 | $141 | 61 |
| 513 Green St | 0.28mi | 3/1.0 (+1) | 932 (+10%) | 8mo | $125,000 | $134 | 60 |
| 517 Manor St | 0.65mi | 2/1.0 | 902 (+6%) | 1mo | $170,000 | $188 | 58 |
| 532 Lafayette St | 0.58mi | 2/1.0 | 928 (+9%) | 3mo | $130,000 | $140 | 55 |
| 826 Saint Joseph St | 0.62mi | 3/1.0 (+1) | 936 (+10%) | 2mo | $187,096 | $200 | 48 |
| 655 S Ann St | 0.68mi | 2/1.0 | 960 (+13%) | 0mo | $170,000 | $177 | 46 |
Match score weights: distance 35% · size 25% · config 20% · recency 20%. Top-matched comps best support the ARV.
Projected returns pro-forma
-3.0% appreciation · 0.47% rent growth · sell at horizon
- IRR
- -10.8%
- Equity multiple
- 0.62×
- Total profit
- $-17,217
- Equity at exit
- $23,842
- IRR
- -5.1%
- Equity multiple
- 0.70×
- Total profit
- $-13,494
- Equity at exit
- $13,825
Cash invested: $44,772 (down + closing). Projections, not guarantees.
Landlord ↔ Tenant lean methodology
- Overall (STATE)
- 62 Landlord-Friendly
- State Pennsylvania
- 62 Landlord-Friendly · EVEN
- County
- — inherits STATE
- City
- — inherits STATE
ZIP-level market 17603
- Rents YoY
- 0.5%
- Active inventory
- 292
- Price-to-rent
- 9.1×
Monthly cashflow live
- Estimated rent
- $1,467 high interval (Pro) →
- Mortgage (P&I)
- −$839
- Tax from tax record
- −$59 /mo · $711/yr
- Insurance
- −$67
- HOA
- −$0
- Vacancy / Maint / Mgmt
- −$308
- Net cashflow
- $195
Break-even live
UW: 25.0% down · 7.5% · 30yr · 1.5% tax · 5.0% vac · 8.0% maint · 8.0% mgmt
Financing live
Cash to close
- Down payment
- $39,975
- Closing costs
- $4,797
- Reserves months
- —
- Total cash needed
- —
Loan-product check · same deal, 3 products live
Conventional
25% down · 7.5% · 30yr
- Down + closing
- —
- Monthly P&I
- —
- Monthly cashflow
- —
- DSCR
- —
- Eligible?
- —
Personal DTI + credit; lowest rate.
DSCR
20% down · 8.5% · 30yr
- Down + closing
- —
- Monthly P&I
- —
- Monthly cashflow
- —
- DSCR
- —
- Eligible?
- —
No personal income docs; deal must DSCR.
Hard money
10% down · 12.0% · 12mo
- Down + closing
- —
- Monthly P&I
- —
- Monthly cashflow
- —
- DSCR
- —
- Eligible?
- —
Short-term bridge; refi at stabilization.
Rent comps 40 comps
| Address | Beds | Baths | Sqft | Rent | $/sqft | DOM | Units | Dist |
|---|---|---|---|---|---|---|---|---|
| 519 1/2 S Prince St Lancaster, PA | 2.0 | 1.0 | 848 | $1,550 | $1.83 | 14d | 1 | 0.08mi |
| 404 Beaver St Lancaster, PA | 3.0 | 1.0 | 1025 | $1,425 | $1.39 | 23d | 1 | 0.10mi |
| 34 Conestoga St Unit 1 Lancaster, PA | 2.0 | 1.0 | 671 | $995 | $1.48 | 21d | 1 | 0.22mi |
| 422 Hillside Ave Lancaster, PA | 2.0 | 1.0 | 960 | $1,245 | $1.30 | 44d | 1 | 0.24mi |
| 324 New Dorwart St Lancaster, PA | 3.0 | 1.0 | 1020 | $1,495 | $1.47 | 14d | 1 | 0.36mi |
| 431 Fremont St Unit 4 Lancaster, PA | 1.0 | 1.0 | 641 | $1,095 | $1.71 | 44d | 1 | 0.38mi |
| 850 Highland Ave Lancaster, PA | 2.0 | 1.0 | 1000 | $1,300 | $1.30 | 21d | 1 | 0.43mi |
| 475 Saint Joseph St Lancaster, PA | 1.0 | 1.0 | 750 | $1,000 | $1.33 | 14d | 1 | 0.46mi |
| 145 Chester St Fl REAR Lancaster, PA | 1.0 | 1.0 | 800 | $1,125 | $1.41 | 14d | 1 | 0.51mi |
| 37 E Filbert St Lancaster, PA | 3.0 | 1.0 | 1002 | $1,750 | $1.75 | 44d | 1 | 0.56mi |
| 72 Howard Ave Lancaster, PA | 2.0 | 1.0 | 572 | $1,495 | $2.61 | 21d | 1 | 0.60mi |
| 61 Howard Ave Apt 1 Lancaster, PA | 2.0 | 1.0 | 650 | $1,045 | $1.61 | 44d | 1 | 0.62mi |
| 225 E King St Unit 2 Lancaster, PA | 2.0 | 2.5 | 1075 | $2,600 | $2.42 | 44d | 1 | 0.65mi |
| 225 E King St Unit 1 Lancaster, PA | 2.0 | 1.0 | 957 | $1,950 | $2.04 | 14d | 1 | 0.65mi |
| 35 N Mulberry St Unit 1st floor Lancaster, PA | 1.0 | 1.0 | 700 | $1,085 | $1.55 | 44d | 1 | 0.66mi |
| 118 N Prince St Lancaster, PA | 1.0–3.0 | 1.0–3.0 | 1274 | $3,199 | $2.51 | 14d | 48 | 0.71mi |
| 437 W Grant St Unit 302 Lancaster, PA | 1.0 | 1.0 | 650 | $1,775 | $2.73 | 23d | 1 | 0.74mi |
| 437 W Grant St Lancaster, PA | 1.0 | 1.0 | 713 | $1,795 | $2.52 | 23d | 1 | 0.74mi |
| 1127 Wabank St Lancaster, PA | 1.0–2.0 | 1.0 | 760 | $1,650 | $2.17 | 23d | 1 | 0.78mi |
| 202 N Queen St Lancaster, PA | 2.0 | 1.0–2.0 | 697 | $2,718 | $3.90 | 14d | 12 | 0.79mi |
| 442 E King St Lancaster, PA | 1.0 | 1.0 | 600 | $925 | $1.54 | 23d | 1 | 0.79mi |
| 227 N Prince St Lancaster, PA | 1.0 | 1.0 | 483 | $1,575 | $3.26 | 14d | 4 | 0.84mi |
| 480 Euclid Ave Lancaster, PA | 1.0–2.0 | 1.0–1.5 | 830 | $1,695 | $2.04 | 44d | 1 | 0.87mi |
| 38 E Walnut St Lancaster, PA | 1.0 | 1.0 | 587 | $1,495 | $2.55 | 23d | 1 | 0.87mi |
| 678 1/2 Columbia Ave Apt 2 Lancaster, PA | 3.0 | 1.0 | 1100 | $1,495 | $1.36 | 14d | 1 | 0.94mi |
| 323 N Mulberry St Unit 4 Lancaster, PA | 1.0 | 1.0 | 600 | $1,500 | $2.50 | 14d | 1 | 0.95mi |
| 767 Clermont Ave Lancaster, PA | 2.0 | 1.0 | 850 | $1,395 | $1.64 | 14d | 1 | 0.96mi |
| 347 N Queen St Lancaster, PA | 1.0 | 1.0 | 687 | $2,025 | $2.95 | 14d | 10 | 0.98mi |
| 433 W Walnut St Apt 2 Lancaster, PA | 2.0 | 1.0 | 900 | $1,840 | $2.04 | 23d | 1 | 0.98mi |
| 114 E Lemon St Lancaster, PA | 1.0 | 1.0 | 627 | $1,347 | $2.15 | 14d | 2 | 0.99mi |
| 344 N Mulberry St Unit 2 Lancaster, PA | 1.0 | 1.0 | 722 | $1,065 | $1.48 | 23d | 1 | 1.00mi |
| 445 W Lemon St Unit 4 Lancaster, PA | 1.0 | 1.5 | 540 | $1,445 | $2.68 | 23d | 1 | 1.09mi |
| 446 N Duke St Unit 1R Lancaster, PA | 1.0 | 1.0 | 580 | $1,095 | $1.89 | 44d | 1 | 1.10mi |
| 506 N Queen St Unit 2 Lancaster, PA | 1.0 | 1.0 | 556 | $1,500 | $2.70 | 14d | 1 | 1.12mi |
| 605 Lehigh Ave Lancaster, PA | 2.0 | 1.0 | 784 | $1,395 | $1.78 | 44d | 1 | 1.22mi |
| 738 E Madison St Lancaster, PA | 3.0 | 1.0 | 1102 | $1,750 | $1.59 | 44d | 1 | 1.27mi |
| 99 Dickinson Ave Lancaster, PA | 2.0 | 2.0 | 981 | $1,634 | $1.67 | 14d | 1 | 1.30mi |
| 709 N Duke St Lancaster, PA | 1.0 | 1.0 | 588 | $1,550 | $2.64 | 21d | 1 | 1.34mi |
| 721 N Duke St Unit 1 Lancaster, PA | 1.0 | 1.0 | 850 | $1,295 | $1.52 | 14d | 1 | 1.36mi |
| 1633A Judie Ln Lancaster, PA | 1.0–2.0 | 1.0–2.0 | 848 | $1,698 | $2.00 | 14d | 13 | 1.36mi |
Listing history 21 events
-
2026-03-25status Pending
-
2026-03-16status Active
-
2026-03-16status Pending
-
2026-03-09status Active
-
2025-12-12status Pending
-
2025-10-31price $159,900
-
2025-09-10$160,000 Active
-
2023-12-18soldstatus $1 Closed 734-char remark
Show marketing remark (734 chars)
* * CONDEMNED PROPERTY * * 15 YEAR DEED RESTRICTION APPLIES * * PROPERTY MUST BE OWNER OCCUPIED OR SOLD TO AN OWNER OCCUPANT WITHIN THE LANCASTER AREA 80% OF HUD MEDIAN INCOME. * * PROPERTY MAY ALSO A BE RENTAL * * IF RENTED TO A HOUSEHOLD WITH A MAX INCOME LIMIT OF LANCASTER AREA 60% OF HUD MEDIAN INCOME (MAX RENTAL LIMITS APPLY). BUYER MUST SHOW PROOF OF FUNDS SUFFICIENT TO PURCHASE AND REHAB THE PROPERTY AT THE TIME OF THE OFFER. NO LIENS ALLOWED ON THE PROPERTY FOR FINANCING. ALL OFFERS DUE BY 3 PM ON TUESDAY, 11/28/23. SOLD AS IS. PROPERTY WILL NOT BE CLEARED OUT. ALL PARTIES WHO SUBMIT OFFERS WILL NEED TO BE PRESENT AT THE CITY OF LANCASTER'S REDEVELOPMENT AUTHORITY PUBLIC BOARD MEETING ON 12/12/23 AT 5:15 PM.
-
2023-11-15historical 734-char remark
Show marketing remark (734 chars)
* * CONDEMNED PROPERTY * * 15 YEAR DEED RESTRICTION APPLIES * * PROPERTY MUST BE OWNER OCCUPIED OR SOLD TO AN OWNER OCCUPANT WITHIN THE LANCASTER AREA 80% OF HUD MEDIAN INCOME. * * PROPERTY MAY ALSO A BE RENTAL * * IF RENTED TO A HOUSEHOLD WITH A MAX INCOME LIMIT OF LANCASTER AREA 60% OF HUD MEDIAN INCOME (MAX RENTAL LIMITS APPLY). BUYER MUST SHOW PROOF OF FUNDS SUFFICIENT TO PURCHASE AND REHAB THE PROPERTY AT THE TIME OF THE OFFER. NO LIENS ALLOWED ON THE PROPERTY FOR FINANCING. ALL OFFERS DUE BY 3 PM ON TUESDAY, 11/28/23. SOLD AS IS. PROPERTY WILL NOT BE CLEARED OUT. ALL PARTIES WHO SUBMIT OFFERS WILL NEED TO BE PRESENT AT THE CITY OF LANCASTER'S REDEVELOPMENT AUTHORITY PUBLIC BOARD MEETING ON 12/12/23 AT 5:15 PM.
-
2023-10-09price $22,000 734-char remark
Show marketing remark (734 chars)
* * CONDEMNED PROPERTY * * 15 YEAR DEED RESTRICTION APPLIES * * PROPERTY MUST BE OWNER OCCUPIED OR SOLD TO AN OWNER OCCUPANT WITHIN THE LANCASTER AREA 80% OF HUD MEDIAN INCOME. * * PROPERTY MAY ALSO A BE RENTAL * * IF RENTED TO A HOUSEHOLD WITH A MAX INCOME LIMIT OF LANCASTER AREA 60% OF HUD MEDIAN INCOME (MAX RENTAL LIMITS APPLY). BUYER MUST SHOW PROOF OF FUNDS SUFFICIENT TO PURCHASE AND REHAB THE PROPERTY AT THE TIME OF THE OFFER. NO LIENS ALLOWED ON THE PROPERTY FOR FINANCING. ALL OFFERS DUE BY 3 PM ON TUESDAY, 11/28/23. SOLD AS IS. PROPERTY WILL NOT BE CLEARED OUT. ALL PARTIES WHO SUBMIT OFFERS WILL NEED TO BE PRESENT AT THE CITY OF LANCASTER'S REDEVELOPMENT AUTHORITY PUBLIC BOARD MEETING ON 12/12/23 AT 5:15 PM.
-
2023-10-09status Active 734-char remark
Show marketing remark (734 chars)
* * CONDEMNED PROPERTY * * 15 YEAR DEED RESTRICTION APPLIES * * PROPERTY MUST BE OWNER OCCUPIED OR SOLD TO AN OWNER OCCUPANT WITHIN THE LANCASTER AREA 80% OF HUD MEDIAN INCOME. * * PROPERTY MAY ALSO A BE RENTAL * * IF RENTED TO A HOUSEHOLD WITH A MAX INCOME LIMIT OF LANCASTER AREA 60% OF HUD MEDIAN INCOME (MAX RENTAL LIMITS APPLY). BUYER MUST SHOW PROOF OF FUNDS SUFFICIENT TO PURCHASE AND REHAB THE PROPERTY AT THE TIME OF THE OFFER. NO LIENS ALLOWED ON THE PROPERTY FOR FINANCING. ALL OFFERS DUE BY 3 PM ON TUESDAY, 11/28/23. SOLD AS IS. PROPERTY WILL NOT BE CLEARED OUT. ALL PARTIES WHO SUBMIT OFFERS WILL NEED TO BE PRESENT AT THE CITY OF LANCASTER'S REDEVELOPMENT AUTHORITY PUBLIC BOARD MEETING ON 12/12/23 AT 5:15 PM.
-
2023-08-06historical 734-char remark
Show marketing remark (734 chars)
* * CONDEMNED PROPERTY * * 15 YEAR DEED RESTRICTION APPLIES * * PROPERTY MUST BE OWNER OCCUPIED OR SOLD TO AN OWNER OCCUPANT WITHIN THE LANCASTER AREA 80% OF HUD MEDIAN INCOME. * * PROPERTY MAY ALSO A BE RENTAL * * IF RENTED TO A HOUSEHOLD WITH A MAX INCOME LIMIT OF LANCASTER AREA 60% OF HUD MEDIAN INCOME (MAX RENTAL LIMITS APPLY). BUYER MUST SHOW PROOF OF FUNDS SUFFICIENT TO PURCHASE AND REHAB THE PROPERTY AT THE TIME OF THE OFFER. NO LIENS ALLOWED ON THE PROPERTY FOR FINANCING. ALL OFFERS DUE BY 3 PM ON TUESDAY, 11/28/23. SOLD AS IS. PROPERTY WILL NOT BE CLEARED OUT. ALL PARTIES WHO SUBMIT OFFERS WILL NEED TO BE PRESENT AT THE CITY OF LANCASTER'S REDEVELOPMENT AUTHORITY PUBLIC BOARD MEETING ON 12/12/23 AT 5:15 PM.
-
2023-07-19$55,000 Active 734-char remark
Show marketing remark (734 chars)
* * CONDEMNED PROPERTY * * 15 YEAR DEED RESTRICTION APPLIES * * PROPERTY MUST BE OWNER OCCUPIED OR SOLD TO AN OWNER OCCUPANT WITHIN THE LANCASTER AREA 80% OF HUD MEDIAN INCOME. * * PROPERTY MAY ALSO A BE RENTAL * * IF RENTED TO A HOUSEHOLD WITH A MAX INCOME LIMIT OF LANCASTER AREA 60% OF HUD MEDIAN INCOME (MAX RENTAL LIMITS APPLY). BUYER MUST SHOW PROOF OF FUNDS SUFFICIENT TO PURCHASE AND REHAB THE PROPERTY AT THE TIME OF THE OFFER. NO LIENS ALLOWED ON THE PROPERTY FOR FINANCING. ALL OFFERS DUE BY 3 PM ON TUESDAY, 11/28/23. SOLD AS IS. PROPERTY WILL NOT BE CLEARED OUT. ALL PARTIES WHO SUBMIT OFFERS WILL NEED TO BE PRESENT AT THE CITY OF LANCASTER'S REDEVELOPMENT AUTHORITY PUBLIC BOARD MEETING ON 12/12/23 AT 5:15 PM.
-
2018-03-03historical
-
2017-10-26$32,000
-
2008-11-12soldstatus $25,000
-
2008-10-14historical
-
2008-07-15$28,000
-
2006-10-30historical
-
2006-10-27soldstatus $27,500
-
2006-08-24$29,900
ⓘ Source: listings_history table (triggers on properties + properties_extension) + one-shot
backfill from property_details.listing_events for pre-trigger history.
Tax reassessment forecast PA · Partial reset (capped growth)
- Current annual tax
- $711 · $59/mo
- Projected year-2 tax
- $1,619 · $135/mo
- Expected delta
- +$908/yr (+$76/mo · 127.7%)
ⓘ Screening estimate from a state-policy table — verify with the county assessor before closing.
Climate risk First Street
- Flood 1/10 Low FEMA zone X (unshaded) · 0% chance over 30 yrs
- Wildfire 1/10 Low
- Heat 6/10 Major 7 d/yr ≥101°F today · 15 d/yr by 30 yrs out
- Wind 4/10 Moderate 15% chance of damaging wind over 30 yrs
- Air quality 4/10 Moderate 4 unhealthy d/yr today · 7 by 30 yrs out
Nearby sold comps map
Loading sold comps map…
Walkable amenities ~0.75 mi
Loading nearby amenities…
Taxation est. · year 1
- Rental income
- $17,607
- − Mortgage interest
- −$8,957
- − Property taxes
- −$711
- − Insurance
- −$800
- − Repairs & maintenance
- −$1,409
- − Management
- −$1,409
- − Depreciation
- −$4,652
- Taxable loss
- −$329
- Est. tax savings @ 24.0%
- +$79
- After-tax cash flow
- $2,416/yr
For passive investors: Depreciation is non-cash, so a rental often shows a tax loss while cash-flowing — sheltering income. Rental losses are passive: they offset passive income freely, and up to $25,000/yr can offset ordinary (W-2) income if you actively participate and your MAGI is under $100k (phasing out to $0 by $150k); unused losses carry forward. On sale, claimed depreciation is recaptured at up to 25%, and gains may owe capital-gains tax (a 1031 exchange can defer both). Figures are a year-1 estimate at your 24.0% rate — not tax advice; consult a CPA.
Schools (NCES district)
- District
- Lancaster SD
- NCES district ID
- 4213140
- Math proficiency
- 12% ▼ -10.00%
- Reading proficiency
- 25% ▼ -13.00%
- Median HH income
- $38,500
- Composite
- 15.52/100
- National rank
- #9301
- State rank
- #500 of 539 in PA
Livability — Lancaster
- Score
- 85/100
- State rank
- #71
- US rank
- #498
Category grades
Schools grade is shown separately in the Schools card above.
Census & demographics
- Census place
- Lancaster, PA
- County
- Lancaster County · 390,309 people
- City population
- 176,170
- Metro
- Lancaster, PA
- Population (ZIP)
- 67,571
- Household income
- $77,084
- Rent vs Own
- Severe rent burden
- 2557.0
Population outlook (Lancaster County) Hauer SSP2
- Today (2025)
- 561,011 people
- By 2030
- 570,969 · +1.8%
- By 2040
- 585,929 · +4.4%
- By 2050
- 591,056 · +5.4%
- By 2075
- 594,747 · +6.0%
- By 2100
- 558,850 · -0.4%
Race, ethnicity, and origin ACS 2023
- Neighborhood character
- Diverse neighborhood (Simpson 0.59)
- Race & ethnicity
- White 58% Hispanic / Latino 27% Two or more races 12% Black 7% Asian 4%
- Hispanic origin (detail)
- Mexican 1% Puerto Rican 19% Cuban 1% Dominican 2%
- Common ancestry
- Romanian 2% Slovak 2% Lithuanian 1%
- Foreign-born
- 9% · Canada, China, India
- Languages at home
- 77% English-only · Spanish 17% Other Indo-European 1% Chinese 1%
Political lean MEDSL · Lancaster
- 2024 margin
- R (+15.9) · D 41.5% · R 57.5%
- 2008→2024 swing
- -4.1pp toward R · 2008: -11.8pp · 2024: -15.9pp
- All cycles
- 2024: R+15.9 2020: R+15.8 2016: R+19.7 2012: R+19.2 2008: R+11.8
Not yet ingested
- Civics
- —
Market trends
- HPI YoY
- ▼ -508.78%
- Current HPI
- 289.3324
- Rent YoY
- ▲ 0.47%
- Metro
- Lancaster, PA
- State GDP YoY
- ▲ 1.68%
- F500 in state
- 34
Industry mix (Fortune 500 HQ in PA)
| Industry | F500 HQs | Revenue |
|---|---|---|
| Healthcare | 2 | $309B |
|
||
| Insurance | 2 | $27B |
|
||
| Telecommunications / Media | 1 | $124B |
|
||
| Industrial Distribution | 1 | $22B |
|
||
| Financial Services | 1 | $20B |
|
||
| Chemicals / Materials | 1 | $18B |
|
||
Price history
+434.8% since first listed21 events — show timeline
- 2026-03-25 Pending — BRIGHT MLS
- 2026-03-16 Relisted — BRIGHT MLS
- 2026-03-16 Pending — BRIGHT MLS
- 2026-03-09 Relisted — BRIGHT MLS
- 2025-12-12 Pending — BRIGHT MLS
- 2025-10-31 Price Changed $159,900 BRIGHT MLS
- 2025-09-10 Listed $160,000 BRIGHT MLS
- 2023-12-18 Sold (MLS) $1 BRIGHT MLS
- 2023-11-15 Listing Removed — BRIGHT MLS
- 2023-10-09 Price Changed $22,000 BRIGHT MLS
- 2023-10-09 Relisted — BRIGHT MLS
- 2023-08-06 Listing Removed — BRIGHT MLS
- 2023-07-19 Listed $55,000 BRIGHT MLS
- 2018-03-03 Listing Removed — BRIGHT MLS
- 2017-10-26 Listed $32,000 BRIGHT MLS
- 2008-11-12 Sold (MLS) $25,000 BRIGHT MLS
- 2008-10-14 Listing Removed — BRIGHT MLS
- 2008-07-15 Listed $28,000 BRIGHT MLS
- 2006-10-30 Listing Removed — BRIGHT MLS
- 2006-10-27 Sold (MLS) $27,500 BRIGHT MLS
- 2006-08-24 Listed $29,900 BRIGHT MLS
Property tax history
-0.9%/yrLatest (2026): $711 · +3.3% YoY. Source: county tax records.
Cash-flow waterfall
monthlySold comps — $/sqft
last 12 mo · ≤1 miLoading sold comps…