 🏷️ Likely Rental
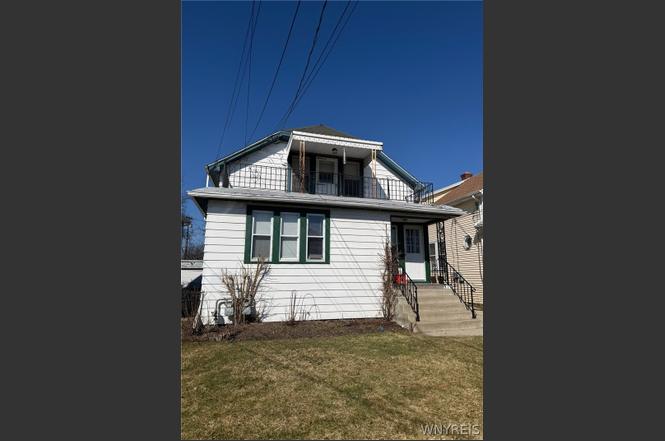
201 Ramsdell Ave · Buffalo, NY
Flood risk 1/10 · Minimal
- FEMA flood zone
- X (unshaded)
- Chance of flooding over 30 yrs
- 0.0%
- Est. flood insurance / yr
- $473 – $860
Fire risk 1/10 · Minimal
- Est. fire insurance / yr
- $691 – $1,283
Heat risk 3/10 · Minor
- Hot days now (above 92°F)
- 7 days/yr
- Hot days in 30 yrs
- 15 days/yr
Wind risk 1/10 · Minimal
- Chance of severe wind over 30 yrs
- —
Air-quality risk 3/10 · Minor
- Unhealthy air days now
- 3 days/yr
- Unhealthy air days in 30 yrs
- 4 days/yr
Risk factors via First Street. Map © Google.
Why this score? — see what drove the C grade
The composite is a weighted blend of 9 inputs, each scored 0–100. Each bar is that input's sub-score; the figure is the points it added to the 100-point composite (weight × sub-score).
- Cash flow +20.4/30.0
- ARV discount +15.0/15.0
- DSCR +6.5/10.0
- 1% rule +4.1/10.0
- Livability +3.9/5.0
- Rent growth +3.4/5.0
- Schools +3.3/10.0
- Condition / age +2.5/5.0
- Appreciation +0.0/10.0
$199,999
🖨 Deal sheet 📄 Offer letter ✓ Due diligence
Listing remarks
Priced under assessed market value for a quick sale. Solid rental unit has produced steady income for these Sellers for over 20 years. Upper and lower front porches add curb appeal. Larger apartment is downstairs; potential for owner occupied with upper tenant helping to pay the mortgage. Total tear off roof was done approximately 10 years ago. Many replaced windows. Rare two car garage for this area along with deeper back yard, and ample space for off street parking. Individual locked walk-in closets in the basement provide private storage. The current tenants' rents are below current market value due to their long-term tenancies, and both would be glad to stay. Sellers intends to do no re
Key facts
- Replaced windows
- Deeper back yard
- Total tear off roof
Tags
Neighborhood map
What this means for you Summary
Snapshot
- This is a 4-bed/2.0-bath townhouse listed at $200k.
Deal economics
- At list price, monthly cash flow is $259 ($3k/yr) — positive.
- The deal already cash-flows at list — no discount required.
- To meet the 1% rule (rent ≥ 1% of price), the offer needs to be $183k (8.7% below list).
- Recommended offer: $183k (8.7% below list) — sets the bar for 1% rule.
Location & tenants
- Location reads 77/100 on livability (#195 in NY, #3,011 nationally) — a middle-class / working-renter tenant base. Strengths: commute A+, housing A+, health & safety A+; Watch: crime F, employment D-.
- Buffalo City School District (urban): math 41% / reading 40% proficiency, ranked #535 of 590 in NY (top 91%) — families likely to look elsewhere, expect single-tenant / working-renter base with shorter leases; 75% free/reduced lunch — lower-income household profile, screen leases tightly.
- Market conditions: Rents rising (+3.6%/yr); 88 active listings in the ZIP; 18 comparable units currently listed for rent nearby; rentals at typical pace (median 21d on market — plan ~3-4 weeks tenant-placement turnaround); 1,244 units permitted in Erie County in 2024 (563 in 5+ unit buildings).
- This rent runs 31% of the median local income ($70k/yr) — at the standard rent-burdened threshold; future hikes will face affordability resistance.
Forward outlook
- Local home prices are declining (-3.0%/yr); year-one equity from $1k of loan paydown is wiped out by about $6k of value loss. Plan a longer hold.
Negotiation context
- Only 5 days on market — expect competitive offers; lowballing is unlikely to land.
- Current owner paid $35k; list at $200k implies a 471% gain — meaningful room to come down on a strong offer.
Risks & watch-outs
- Watch-outs: built in 1928 — expect roof / HVAC / electrical / plumbing capex.
Questions for the listing agent
- Built in 1928 — when were the roof, HVAC, electrical panel, plumbing, and water heater last replaced?
- Is there a deadline driving the sale (1031 exchange, divorce, estate, relocation)? That informs how much negotiation room exists.
- Crime grade is F in this area — have there been break-ins, vandalism, or insurance claims at this property in the last 3 years? What carrier currently insures it and at what premium?
- What's the average days-on-market for RENTAL listings here right now (not sales)? A rising rental-DOM trend means longer vacancies and softer asking-rent achievability than the comps imply.
- What's the recent tenant-quality profile in this submarket — average credit score on applications, eviction rate, late-payment / NSF rate, and stable-employment percentage? A property-management company in the area should have these aggregated.
- How much new for-sale + rental construction is in the pipeline within 1–3 miles? Heavy new supply typically softens prices + rents 12–24 months out; constrained supply supports both.
Investment metrics
- 1% rule
- 0.91% ✗
- Cap rate
- 7.84%
- Cash-on-cash
- 5.54%
- DSCR
- 1.25
- GRM
- 9.1
CMA / ARV
- ARV (on-the-fly)
- $297,208
- Comps found
- 2
Show comp detail 2 sales within ~0.75 mi
| Address | Dist | Beds/Ba | Sqft | Sold | Price | $/sf | Match |
|---|---|---|---|---|---|---|---|
| 57 Hartwell Rd | 0.38mi | 4/2.0 | 1,736 (+13%) | 1mo | $129,500 | $75 | 60 |
| 356 Tremont Ave | 0.64mi | 3/2.0 (-1) | 1,332 (-13%) | 20mo | $258,000 | $194 | 26 |
Match score weights: distance 35% · size 25% · config 20% · recency 20%. Top-matched comps best support the ARV.
Projected returns pro-forma
-3.0% appreciation · 3.65% rent growth · sell at horizon
- IRR
- -7.1%
- Equity multiple
- 0.74×
- Total profit
- $-14,832
- Equity at exit
- $29,821
- IRR
- 3.1%
- Equity multiple
- 1.23×
- Total profit
- $12,907
- Equity at exit
- $17,292
Cash invested: $56,000 (down + closing). Projections, not guarantees.
Landlord ↔ Tenant lean methodology
- Overall (STATE)
- 15 Strongly Tenant-Friendly
- State New York
- 15 Strongly Tenant-Friendly · D+10
- County
- — inherits STATE
- City
- — inherits STATE
ZIP-level market 14216
- Rents YoY
- 3.6%
- Active inventory
- 88
- Price-to-rent
- 9.1×
Monthly cashflow live
- Estimated rent
- $1,827 high interval (Pro) →
- Mortgage (P&I)
- −$1,049
- Tax from tax record
- −$52 /mo · $628/yr
- Insurance
- −$83
- HOA
- −$0
- Vacancy / Maint / Mgmt
- −$384
- Net cashflow
- $259
Break-even live
UW: 25.0% down · 7.5% · 30yr · 1.5% tax · 5.0% vac · 8.0% maint · 8.0% mgmt
Financing live
Cash to close
- Down payment
- $50,000
- Closing costs
- $6,000
- Reserves months
- —
- Total cash needed
- —
Loan-product check · same deal, 3 products live
Conventional
25% down · 7.5% · 30yr
- Down + closing
- —
- Monthly P&I
- —
- Monthly cashflow
- —
- DSCR
- —
- Eligible?
- —
Personal DTI + credit; lowest rate.
DSCR
20% down · 8.5% · 30yr
- Down + closing
- —
- Monthly P&I
- —
- Monthly cashflow
- —
- DSCR
- —
- Eligible?
- —
No personal income docs; deal must DSCR.
Hard money
10% down · 12.0% · 12mo
- Down + closing
- —
- Monthly P&I
- —
- Monthly cashflow
- —
- DSCR
- —
- Eligible?
- —
Short-term bridge; refi at stabilization.
Rent comps 18 comps
| Address | Beds | Baths | Sqft | Rent | $/sqft | DOM | Units | Dist |
|---|---|---|---|---|---|---|---|---|
| 2522 Delaware Ave Buffalo, NY | 3.0 | 1.0 | 1150 | $1,625 | $1.41 | 1d | 1 | 0.53mi |
| 172 Tremont Ave Kenmore, NY | 3.0 | 1.5 | 1569 | $2,500 | $1.59 | 10d | 1 | 0.54mi |
| 2514 Delaware Ave Unit 1 Buffalo, NY | 3.0 | 1.0 | 1620 | $1,650 | $1.02 | 1d | 1 | 0.54mi |
| 244 Hartwell Rd Buffalo, NY | 3.0 | 1.0 | 1250 | $1,500 | $1.20 | 3d | 1 | 0.59mi |
| 77 Lovering Ave #2 Buffalo, NY | 3.0 | 1.0 | 1450 | $1,895 | $1.31 | 43d | 1 | 0.90mi |
| 237 W Girard Blvd Buffalo, NY | 4.0 | 1.5 | 1329 | $4,000 | $3.01 | 23d | 1 | 0.90mi |
| 140 Commonwealth Ave Unit 1 Buffalo, NY | 3.0 | 1.0 | 1250 | $3,500 | $2.80 | 43d | 1 | 0.98mi |
| 359 Colvin Ave Buffalo, NY | 3.0 | 1.0 | 2010 | $2,100 | $1.04 | 23d | 1 | 1.06mi |
| 88 Commonwealth Ave Buffalo, NY | 3.0 | 1.0 | 1355 | $1,695 | $1.25 | 19d | 1 | 1.06mi |
| 79 Commonwealth Ave Buffalo, NY | 3.0 | 1.0 | 1450 | $1,600 | $1.10 | 23d | 1 | 1.10mi |
| 62 Seabrook St Buffalo, NY | 4.0 | 1.0 | 1300 | $2,000 | $1.54 | 1d | 1 | 1.10mi |
| 307 Sterling Ave Buffalo, NY | 3.0 | 1.0 | 1632 | $1,800 | $1.10 | 3d | 1 | 1.27mi |
| 118 Rano St Buffalo, NY | 3.0 | 1.0 | 1050 | $1,200 | $1.14 | 21d | 1 | 1.28mi |
| 139 Fordham Dr Buffalo, NY | 3.0 | 1.0 | 1453 | $1,700 | $1.17 | 23d | 1 | 1.32mi |
| 158 Chadduck Ave Buffalo, NY | 4.0 | 1.0 | 1200 | $1,250 | $1.04 | 23d | 1 | 1.37mi |
| 78 Germain St Buffalo, NY | 3.0 | 1.0 | 2030 | $1,300 | $0.64 | 14d | 1 | 1.42mi |
| 62 Germain St Buffalo, NY | 3.0 | 1.0 | 1320 | $1,250 | $0.95 | 23d | 1 | 1.43mi |
| 414 Taunton Pl Unit Lowet Buffalo, NY | 3.0 | 1.0 | 1232 | $1,700 | $1.38 | 14d | 1 | 1.44mi |
Listing history 3 events
-
2026-03-14status Pending
-
2026-03-09$199,999 Active
-
2002-05-03soldstatus $35,000
ⓘ Source: listings_history table (triggers on properties + properties_extension) + one-shot
backfill from property_details.listing_events for pre-trigger history.
Tax reassessment forecast NY · Partial reset (capped growth)
- Current annual tax
- $628 · $52/mo
- Projected year-2 tax
- $2,004 · $167/mo
- Expected delta
- +$1,376/yr (+$115/mo · 219.2%)
ⓘ Screening estimate from a state-policy table — verify with the county assessor before closing.
Climate risk First Street
- Flood 1/10 Low FEMA zone X (unshaded) · 0% chance over 30 yrs
- Wildfire 1/10 Low
- Heat 3/10 Moderate 7 d/yr ≥92°F today · 15 d/yr by 30 yrs out
- Wind 1/10 Low
- Air quality 3/10 Moderate 3 unhealthy d/yr today · 4 by 30 yrs out
Nearby sold comps map
Loading sold comps map…
Walkable amenities ~0.75 mi
Loading nearby amenities…
Taxation est. · year 1
- Rental income
- $21,919
- − Mortgage interest
- −$11,203
- − Property taxes
- −$628
- − Insurance
- −$1,000
- − Repairs & maintenance
- −$1,754
- − Management
- −$1,754
- − Depreciation
- −$5,818
- Taxable loss
- −$237
- Est. tax savings @ 24.0%
- +$57
- After-tax cash flow
- $3,160/yr
For passive investors: Depreciation is non-cash, so a rental often shows a tax loss while cash-flowing — sheltering income. Rental losses are passive: they offset passive income freely, and up to $25,000/yr can offset ordinary (W-2) income if you actively participate and your MAGI is under $100k (phasing out to $0 by $150k); unused losses carry forward. On sale, claimed depreciation is recaptured at up to 25%, and gains may owe capital-gains tax (a 1031 exchange can defer both). Figures are a year-1 estimate at your 24.0% rate — not tax advice; consult a CPA.
Schools (NCES district)
- District
- Buffalo City School District
- NCES district ID
- 3605850
- Math proficiency
- 41% ▲ 11.00%
- Reading proficiency
- 40% ▲ 7.00%
- Median HH income
- $31,665
- Composite
- 33.17/100
- National rank
- #5544
- State rank
- #535 of 590 in NY
Livability — Buffalo
- Score
- 77/100
- State rank
- #195
- US rank
- #3011
Category grades
Schools grade is shown separately in the Schools card above.
Census & demographics
- Census place
- Buffalo, NY
- County
- Erie County · 714,559 people
- City population
- 440,021
- Metro
- Buffalo-Cheektowaga, NY
- Population (ZIP)
- 22,849
- Household income
- $69,629
- Rent vs Own
- Severe rent burden
- 1831.0
Population outlook (Erie County) Hauer SSP2
- Today (2025)
- 933,037 people
- By 2030
- 935,181 · +0.2%
- By 2040
- 928,531 · -0.5%
- By 2050
- 905,725 · -2.9%
- By 2075
- 834,037 · -10.6%
- By 2100
- 708,033 · -24.1%
Race, ethnicity, and origin ACS 2023
- Neighborhood character
- Predominantly White (72%)
- Race & ethnicity
- White 72% Black 16% Hispanic / Latino 7% Two or more races 5% Asian 1%
- Hispanic origin (detail)
- Puerto Rican 5%
- Common ancestry
- Romanian 10% Iranian 2% Lithuanian 1%
- Foreign-born
- 5% · Canada, China
- Languages at home
- 90% English-only · Spanish 5% French/Haitian/Cajun 1% Other Indo-European 1%
Political lean MEDSL · Erie
- 2024 margin
- Lean D (+9.7) · D 54.8% · R 45.2%
- 2008→2024 swing
- -7.9pp toward R · 2008: 17.5pp · 2024: 9.7pp
- All cycles
- 2024: D+9.7 2020: D+14.7 2016: D+4.8 2012: D+15.6 2008: D+17.5
Not yet ingested
- Civics
- —
Market trends
- HPI YoY
- ▼ -264.53%
- Current HPI
- 421.1138
- Rent YoY
- ▲ 3.65%
- Metro
- Buffalo-Cheektowaga, NY
- State GDP YoY
- ▲ 2.60%
- F500 in state
- 92
Industry mix (Fortune 500 HQ in NY)
| Industry | F500 HQs | Revenue |
|---|---|---|
| Financial Services | 10 | $950B |
|
||
| Consumer Goods | 9 | $162B |
|
||
| Insurance | 4 | $225B |
|
||
| Telecommunications | 2 | $144B |
|
||
| Pharmaceuticals | 2 | $112B |
|
||
| Media / Entertainment | 2 | $69B |
|
||
Price history
+471.4% since first listed3 events — show timeline
- 2026-03-14 Pending — WNYREIS
- 2026-03-09 Listed $199,999 WNYREIS
- 2002-05-03 Sold (Public Records) $35,000 Public Records
Property tax history
+3.7%/yrLatest (2025): $628 · +0.0% YoY. Source: county tax records.
Cash-flow waterfall
monthlySold comps — $/sqft
last 12 mo · ≤1 miLoading sold comps…