 🏗️ New Construction
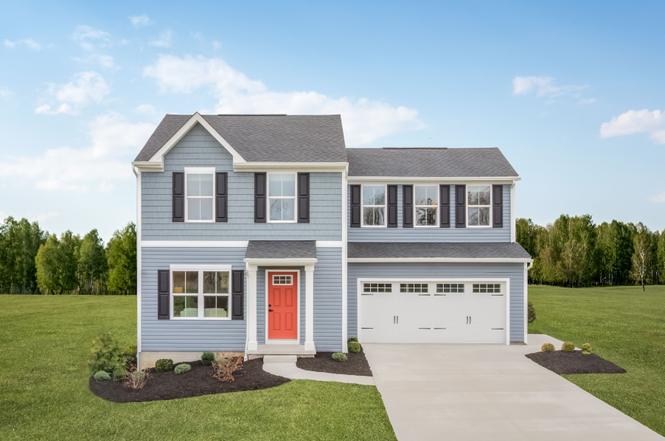
Aspen Plan · Santee, SC
Flood risk No data
- FEMA flood zone
- —
- Chance of flooding over 30 yrs
- —
- Est. flood insurance / yr
- —
Fire risk No data
- Est. fire insurance / yr
- —
Heat risk No data
- Hot days now (above threshold)
- —
- Hot days in 30 yrs
- —
Wind risk No data
- Chance of severe wind over 30 yrs
- —
Air-quality risk No data
- Unhealthy air days now
- —
- Unhealthy air days in 30 yrs
- —
Risk factors via First Street. Map © Google.
Why this score? — see what drove the D- grade
The composite is a weighted blend of 9 inputs, each scored 0–100. Each bar is that input's sub-score; the figure is the points it added to the 100-point composite (weight × sub-score).
- ARV discount +7.5/15.0
- Cash flow +7.4/30.0
- Appreciation +6.7/10.0
- Schools +5.0/10.0
- Livability +3.1/5.0
- Rent growth +2.5/5.0
- Condition / age +2.5/5.0
- 1% rule +2.1/10.0
- DSCR +1.6/10.0
$249,990
🖨 Deal sheet (PDF) 📄 Offer letter ✓ Due diligence
Listing remarks
Welcome to Somerset! A new home community where you can feel confident in owning a new home with simple living and space to relax in Santee. The Aspen has it all. Enter the huge great room and immediately feel at home. The first floor's open concept means you are never far from the action. A cozy kitchen features an optional island; add a powder room for convenience. The entry off the 2-car garage provides a convenient spot for coats, so clutter is never an issue. Upstairs all 3 bedrooms are large and boast ample closet space. A half bath and laundry room provide total comfort. The owner's suite is the star of the home, with an en-suite bathroom and huge walk-in closet. Experience all that
Key facts
- Huge walk-in closet
- Open concept
- Future pool
Tags
Property features AI
Finance
- Financial info: List price provided
Exterior
- Parking: 2 parking spaces
- Utilities: Has cooling (central air)
- Home design: Plan name: Aspen; Inventory type: Plan
- Exterior features: Living area of 1,440 (provided)
Interior
- Bedrooms: 3 bedrooms
- Bathrooms: 2 full bathrooms
- Heating & cooling: Central Air
- Interior features: Central air conditioning
Neighborhood map
What this means for you Summary
Snapshot
- This is a 3-bed/2.0-bath single-family listed at $250k.
Deal economics
- At list price, monthly cash flow is $-361 ($-4k/yr) — negative.
- To cash-flow at today's rent, offer at most $229k (8.5% below list).
- To meet the 1% rule (rent ≥ 1% of price), the offer needs to be $200k (20.0% below list).
- Recommended offer: $200k (20.0% below list) — sets the bar for 1% rule.
Location & tenants
- Location reads 61/100 on livability (#202 in SC) — a middle-class / working-renter tenant base. Strengths: cost of living A+, health & safety A+; Watch: schools D+, crime F, amenities F.
- Market conditions: 161 active listings in the ZIP; 1 comparable units currently listed for rent nearby; 87 units permitted in Orangeburg County in 2024 (0 in 5+ unit buildings).
Forward outlook
- In year one you build about $12k of equity ($2k loan paydown + $10k appreciation (3.5% local appreciation)).
- Orangeburg County population projected at -27% by 2050 — secular population decline; favor cash flow + early exit over multi-decade hold.
- By year 4, paydown + projected appreciation supports a ~$40k cash-out refi (75% LTV) — recoverable capital for the next deal without selling this one.
Negotiation context
- It's been on market 126 days — a 12% lower offer ($220k) is reasonable based on typical stale-listing flexibility.
Questions for the listing agent
- What do current leases actually rent for vs. the listed asking? Can we see a recent rent roll and the last 12 months of T-12 income?
- It's been on market 126 days. Have you received any prior offers? Is the seller open to a 20% concession, seller financing, or rate buy-down credit?
- Why hasn't it sold? Are there any deal-killer items the seller is aware of (foundation, flood, title, zoning, code violations)?
- Is there a deadline driving the sale (1031 exchange, divorce, estate, relocation)? That informs how much negotiation room exists.
- Schools are D-rated, which usually means shorter tenancies and higher turnover. Who's the typical renter profile here, and what's been the actual vacancy rate?
- Crime grade is F in this area — have there been break-ins, vandalism, or insurance claims at this property in the last 3 years? What carrier currently insures it and at what premium?
- The area grade is low — what's the realistic commute time and amenity access for the typical tenant pool here? Any planned neighborhood developments (good or bad) we should know about?
- What's the average days-on-market for RENTAL listings here right now (not sales)? A rising rental-DOM trend means longer vacancies and softer asking-rent achievability than the comps imply.
- What's the recent tenant-quality profile in this submarket — average credit score on applications, eviction rate, late-payment / NSF rate, and stable-employment percentage? A property-management company in the area should have these aggregated.
- How much new for-sale + rental construction is in the pipeline within 1–3 miles? Heavy new supply typically softens prices + rents 12–24 months out; constrained supply supports both.
Investment metrics
- 1% rule
- 0.71% ✗
- Cap rate
- 4.75%
- Cash-on-cash
- -5.50%
- DSCR
- 0.76
- GRM
- 11.7
CMA / ARV
- ARV (on-the-fly)
- $280,800
- Comps found
- 3
Show comp detail 3 sales within ~0.75 mi
| Address | Dist | Beds/Ba | Sqft | Sold | Price | $/sf | Match |
|---|---|---|---|---|---|---|---|
| 188 Fargo Dr | 0.00mi | 3/2.0 | 1,348 (-6%) | 14mo | $313,990 | $233 | 78 |
| 632 Mulligan Way | 0.24mi | 3/2.0 | 1,307 (-9%) | 11mo | $254,990 | $195 | 65 |
| 9148 Ace Dr | 0.29mi | 3/2.5 | 1,307 (-9%) | 11mo | $254,990 | $195 | 60 |
Match score weights: distance 35% · size 25% · config 20% · recency 20%. Top-matched comps best support the ARV.
Projected returns pro-forma
3.47% appreciation · 3.0% rent growth · sell at horizon
- IRR
- 3.9%
- Equity multiple
- 1.23×
- Total profit
- $17,993
- Equity at exit
- $133,813
- IRR
- 7.0%
- Equity multiple
- 2.12×
- Total profit
- $87,699
- Equity at exit
- $212,297
Cash invested: $78,624 (down + closing). Projections, not guarantees.
Landlord ↔ Tenant lean methodology
- Overall (STATE)
- 90 Strongly Landlord-Friendly
- State South Carolina
- 90 Strongly Landlord-Friendly · R+6
- County
- — inherits STATE
- City
- — inherits STATE
ZIP-level market 29142
- Home prices YoY
- 1.8%
- Active inventory
- 161
- Price-to-rent
- 10.4×
Monthly cashflow live
- Estimated rent
- $2,000 medium interval (Pro) →
- Mortgage (P&I)
- −$1,473
- Tax est. 1.5%
- −$351 /mo · $4,212/yr
- Insurance
- −$117
- HOA
- −$0
- Vacancy / Maint / Mgmt
- −$420
- Net cashflow
- $-361
Break-even live
Sensitivity live
| Price | -10% $-166 | -5% $-264 | +0% $-361 | +5% $-458 | +10% $-555 |
|---|---|---|---|---|---|
| Rent | -10% $-519 | -5% $-440 | +0% $-361 | +5% $-282 | +10% $-203 |
| Rate | -1.0pp $-219 | -0.5pp $-289 | base $-361 | +0.5pp $-433 | +1.0pp $-507 |
UW: 25.0% down · 7.5% · 30yr · 1.5% tax · 5.0% vac · 8.0% maint · 8.0% mgmt
Financing live
Cash to close
- Down payment
- $70,200
- Closing costs
- $8,424
- Reserves months
- —
- Total cash needed
- —
Loan-product check · same deal, 3 products live
Conventional
25% down · 7.5% · 30yr
- Down + closing
- —
- Monthly P&I
- —
- Monthly cashflow
- —
- DSCR
- —
- Eligible?
- —
Personal DTI + credit; lowest rate.
DSCR
20% down · 8.5% · 30yr
- Down + closing
- —
- Monthly P&I
- —
- Monthly cashflow
- —
- DSCR
- —
- Eligible?
- —
No personal income docs; deal must DSCR.
Hard money
10% down · 12.0% · 12mo
- Down + closing
- —
- Monthly P&I
- —
- Monthly cashflow
- —
- DSCR
- —
- Eligible?
- —
Short-term bridge; refi at stabilization.
Rent comps 1 comps
| Address | Beds | Baths | Sqft | Rent | $/sqft | DOM | Units | Dist |
|---|---|---|---|---|---|---|---|---|
| 764 Striped Bass Ct Santee, SC | 3.0 | 2.0 | 1183 | $2,000 | $1.69 | 25d | 1 | 1.28mi |
Listing history 17 events
-
2026-06-22days on market $249,990 Active 126 DOM
-
2026-06-19days on market $249,990 Active 123 DOM
-
2026-06-18days on market $249,990 Active 122 DOM
-
2026-06-17days on market $249,990 Active 121 DOM
-
2026-06-16days on market $249,990 Active 120 DOM
-
2026-06-15days on market $249,990 Active 119 DOM
-
2026-06-14days on market $249,990 Active 117 DOM
-
2026-06-12days on market $249,990 Active 116 DOM
-
2026-06-09days on market $249,990 Active 113 DOM
-
2026-06-08days on market $249,990 Active 112 DOM
-
2026-06-07days on market $249,990 Active 111 DOM
-
2026-06-07days on market $249,990 Active 110 DOM
-
2026-06-04days on market $249,990 Active 107 DOM
-
2026-06-02days on market $249,990 Active 106 DOM
-
2026-06-01days on market $249,990 Active 105 DOM
-
2026-05-31days on market $249,990 Active 104 DOM
-
2026-05-31days on market $249,990 Active 103 DOM
ⓘ Source: listings_history table (triggers on properties + properties_extension) + one-shot
backfill from property_details.listing_events for pre-trigger history.
Nearby sold comps map
Loading sold comps map…
Walkable amenities ~0.75 mi
Loading nearby amenities…
Taxation est. · year 1
- Rental income
- $24,000
- − Mortgage interest
- −$15,729
- − Property taxes
- −$4,212
- − Insurance
- −$1,404
- − Repairs & maintenance
- −$1,920
- − Management
- −$1,920
- − Depreciation
- −$8,169
- Taxable loss
- −$9,354
- Est. tax savings @ 24.0%
- +$2,245
- After-tax cash flow
- $-2,082/yr
For passive investors: Depreciation is non-cash, so a rental often shows a tax loss while cash-flowing — sheltering income. Rental losses are passive: they offset passive income freely, and up to $25,000/yr can offset ordinary (W-2) income if you actively participate and your MAGI is under $100k (phasing out to $0 by $150k); unused losses carry forward. On sale, claimed depreciation is recaptured at up to 25%, and gains may owe capital-gains tax (a 1031 exchange can defer both). Figures are a year-1 estimate at your 24.0% rate — not tax advice; consult a CPA.
Schools (NCES district)
No district data.
Livability — Santee
- Score
- 61/100
- State rank
- #202
- US rank
- #17354
Category grades
Schools grade is shown separately in the Schools card above.
Census & demographics
- Census place
- Santee, SC
- Population (ZIP)
- 4,658
Population outlook (Orangeburg County) Hauer SSP2
- Today (2025)
- 82,698 people
- By 2030
- 78,615 · -4.9%
- By 2040
- 69,308 · -16.2%
- By 2050
- 60,629 · -26.7%
- By 2075
- 42,678 · -48.4%
- By 2100
- 28,136 · -66.0%
Race, ethnicity, and origin ACS 2023
- Neighborhood character
- Majority Black (64%)
- Race & ethnicity
- Black 64% White 31% Asian 3% Hispanic / Latino 2%
- Common ancestry
- Lithuanian 2% Romanian 2%
- Foreign-born
- 1%
- Languages at home
- 96% English-only · Other Indo-European 2% Spanish 1%
Political lean MEDSL · Orangeburg
- 2024 margin
- Strong D (+24.6) · D 61.8% · R 37.2% · Other 1.1%
- 2008→2024 swing
- -13.5pp toward R · 2008: 38.1pp · 2024: 24.6pp
- All cycles
- 2024: D+24.6 2020: D+33.2 2016: D+37.0 2012: D+43.5 2008: D+38.1
Not yet ingested
- Civics
- —
Market trends
- HPI YoY
- ▲ 3.47%
- Current HPI
- 193.5623
- Rent YoY
- —
- Metro
- —
- State GDP YoY
- ▲ 4.51%
- F500 in state
- 2
Industry mix (Fortune 500 HQ in SC)
| Industry | F500 HQs | Revenue |
|---|---|---|
| Packaging | 1 | $7B |
|
||
Cash-flow waterfall
monthlySold comps — $/sqft
last 12 mo · ≤1 miLoading sold comps…