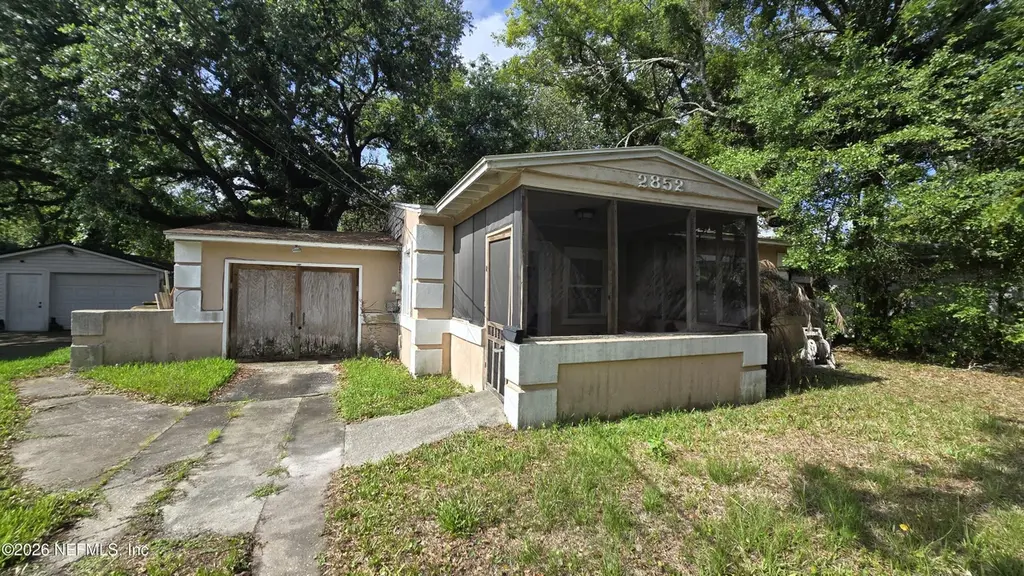
2852 Ernest St · Jacksonville, FL
Flood risk 4/10 · Minor
- FEMA flood zone
- X (unshaded)
- Chance of flooding over 30 yrs
- 0.22%
- Est. flood insurance / yr
- $507 – $1,088
Fire risk 1/10 · Minimal
- Est. fire insurance / yr
- $947 – $1,759
Heat risk 9/10 · Severe
- Hot days now (above 107°F)
- 7 days/yr
- Hot days in 30 yrs
- 20 days/yr
Wind risk 9/10 · Severe
- Chance of severe wind over 30 yrs
- 99.0%
Air-quality risk 5/10 · Moderate
- Unhealthy air days now
- 7 days/yr
- Unhealthy air days in 30 yrs
- 7 days/yr
Risk factors via First Street. Map © Google.
Why this score? — see what drove the B- grade
The composite is a weighted blend of 9 inputs, each scored 0–100. Each bar is that input's sub-score; the figure is the points it added to the 100-point composite (weight × sub-score).
- Cash flow +24.0/30.0
- ARV discount +15.0/15.0
- 1% rule +7.7/10.0
- DSCR +7.7/10.0
- Livability +4.2/5.0
- Schools +3.9/10.0
- Rent growth +2.9/5.0
- Condition / age +2.5/5.0
- Appreciation +0.0/10.0
$120,000
🖨 Deal sheet 📄 Offer letter ✓ Due diligence
Listing remarks MLS
Come view this single family detached home in ''CHEROKEE HEIGHTS.'' This home features: open kitchen, front porch, and one car garage. This is a Fannie Mae HomePath Property.
Key facts
- Screened front porch
- Original tile bath
- Gas range
Tags
Property features AI
Finance
- HOA & community: Not a senior community
Exterior
- Parking: Attached garage (1 car)
- Utilities: Public sewer; Cable available; Electricity available; Sewer available; Water available
- Home design: Single Family Residence; Currently used as residential single-family
- Exterior features: Back yard with chain link fencing; City street frontage
Interior
- Bedrooms: 2 bedrooms
- Bathrooms: 1 full bathroom
- Heating & cooling: Central heating; Central air conditioning
- Interior features: Refrigerator
Neighborhood map
What this means for you Summary
Snapshot
- This is a 2-bed/1.0-bath single-family listed at $120k.
Deal economics
- At list price, monthly cash flow is $236 ($3k/yr) — positive.
- The deal already cash-flows at list — no discount required.
- Meets the 1% rule at list price ($2k rent vs $120k).
- Cap rate 8.7% vs local median 4.0% in Jacksonville — top-decile yield for the area; either an underpriced asset or a hidden risk that comps aren't pricing in. Stress-test before assuming the spread holds.
Location & tenants
- Location reads 83/100 on livability (#50 in FL, #911 nationally) — a professional / high-income tenant draw. Strengths: amenities A+, commute A+, housing A+.
- Duval (urban): math 46% / reading 45% proficiency, ranked #48 of 73 in FL (top 66%) — families likely to look elsewhere, expect single-tenant / working-renter base with shorter leases.
- Market conditions: Rents rising (+1.7%/yr); 320 active listings in the ZIP; 40 comparable units currently listed for rent nearby; rentals at typical pace (median 20d on market — plan ~3-4 weeks tenant-placement turnaround); 6,503 units permitted in Duval County in 2024 (1,131 in 5+ unit buildings).
Forward outlook
- Local home prices are declining (-3.0%/yr); year-one equity from $830 of loan paydown is wiped out by about $4k of value loss. Plan a longer hold.
- Duval County population projected at +19% by 2050 — long-run rental-demand tailwind backs the buy-and-hold thesis.
Negotiation context
- Only 7 days on market — expect competitive offers; lowballing is unlikely to land.
- 5 sale attempts since 24y ago with the ask held roughly flat each time — persistent listings suggest the price (not the market) is what's stuck; bring a comps-based counter.
- Current owner paid $30k; list at $120k implies a 307% gain — meaningful room to come down on a strong offer.
Risks & watch-outs
- Watch-outs: property tax is 2.9% of price; built in 1951 — expect roof / HVAC / electrical / plumbing capex.
- Climate carrying-cost: severe wind risk, 99% chance of damaging wind over 30y; extreme-heat days projected 7→20/yr by 2055 (HVAC capex compounding) — expect insurance premiums to compound above CPI over the hold.
Questions for the listing agent
- Built in 1951 — when were the roof, HVAC, electrical panel, plumbing, and water heater last replaced?
- Property tax is high relative to price — has the assessment been appealed recently, and will the sale trigger a re-assessment?
- Is there a deadline driving the sale (1031 exchange, divorce, estate, relocation)? That informs how much negotiation room exists.
- Schools are B-rated — typically a magnet for longer-tenancy family renters. What's the average tenant stay here, and is there a school-zone premium baked into asking?
- What's the average days-on-market for RENTAL listings here right now (not sales)? A rising rental-DOM trend means longer vacancies and softer asking-rent achievability than the comps imply.
- What's the recent tenant-quality profile in this submarket — average credit score on applications, eviction rate, late-payment / NSF rate, and stable-employment percentage? A property-management company in the area should have these aggregated.
- How much new for-sale + rental construction is in the pipeline within 1–3 miles? Heavy new supply typically softens prices + rents 12–24 months out; constrained supply supports both.
Investment metrics
- 1% rule
- 1.27% ✓
- Cap rate
- 8.65%
- Cash-on-cash
- 8.42%
- DSCR
- 1.37
- GRM
- 6.6
CMA / ARV
- ARV (on-the-fly)
- $226,389
- Comps found
- 12
Show comp detail 12 sales within ~0.75 mi
| Address | Dist | Beds/Ba | Sqft | Sold | Price | $/sf | Match |
|---|---|---|---|---|---|---|---|
| 2790 Forbes St | 0.44mi | 2/1.0 | 1,110 (-5%) | 0mo | $259,000 | $233 | 70 |
| 2881 Lenox Ave | 0.32mi | 3/1.0 (+1) | 1,068 (-9%) | 2mo | $90,000 | $84 | 63 |
| 768 James St | 0.16mi | 3/2.0 (+1) | 1,312 (+12%) | 2mo | $253,000 | $193 | 62 |
| 2578 Haldumar Ter | 0.62mi | 2/1.0 | 1,114 (-5%) | 0mo | $280,000 | $251 | 62 |
| 3053 Gilmore St | 0.33mi | 2/1.0 | 1,008 (-14%) | 0mo | $130,000 | $129 | 61 |
| 2950 Remington St | 0.57mi | 3/2.0 (+1) | 1,201 (+2%) | 1mo | $323,970 | $270 | 60 |
| 2908 Spencer St | 0.46mi | 3/2.0 (+1) | 1,100 (-6%) | 0mo | $158,000 | $144 | 59 |
| 2858 Downing St | 0.56mi | 3/1.0 (+1) | 1,080 (-8%) | 0mo | $195,000 | $181 | 56 |
| 3127 Dignan St | 0.67mi | 3/2.0 (+1) | 1,197 (+2%) | 2mo | $210,000 | $175 | 55 |
| 2807 Lydia St | 0.61mi | 2/2.0 | 1,080 (-8%) | 2mo | $375,000 | $347 | 53 |
| 3332 Dellwood Ave | 0.66mi | 2/1.0 | 1,023 (-13%) | 0mo | $184,000 | $180 | 48 |
| 3230 Mayflower St | 0.66mi | 3/2.0 (+1) | 1,292 (+10%) | 0mo | $310,000 | $240 | 43 |
Match score weights: distance 35% · size 25% · config 20% · recency 20%. Top-matched comps best support the ARV.
Projected returns pro-forma
-3.0% appreciation · 1.73% rent growth · sell at horizon
- IRR
- -5.1%
- Equity multiple
- 0.81×
- Total profit
- $-6,244
- Equity at exit
- $17,892
- IRR
- 2.9%
- Equity multiple
- 1.20×
- Total profit
- $6,647
- Equity at exit
- $10,375
Cash invested: $33,600 (down + closing). Projections, not guarantees.
Landlord ↔ Tenant lean methodology
- Overall (STATE)
- 87 Strongly Landlord-Friendly
- State Florida
- 87 Strongly Landlord-Friendly · R+3
- County
- — inherits STATE
- City
- — inherits STATE
ZIP-level market 32205
- Rents YoY
- 1.7%
- Active inventory
- 320
- Price-to-rent
- 6.6×
Monthly cashflow live
- Estimated rent
- $1,523 high interval (Pro) →
- Mortgage (P&I)
- −$629
- Tax from tax record
- −$288 /mo · $3,461/yr
- Insurance
- −$50
- HOA
- −$0
- Vacancy / Maint / Mgmt
- −$320
- Net cashflow
- $236
Break-even live
UW: 25.0% down · 7.5% · 30yr · 1.5% tax · 5.0% vac · 8.0% maint · 8.0% mgmt
Financing live
Cash to close
- Down payment
- $30,000
- Closing costs
- $3,600
- Reserves months
- —
- Total cash needed
- —
Loan-product check · same deal, 3 products live
Conventional
25% down · 7.5% · 30yr
- Down + closing
- —
- Monthly P&I
- —
- Monthly cashflow
- —
- DSCR
- —
- Eligible?
- —
Personal DTI + credit; lowest rate.
DSCR
20% down · 8.5% · 30yr
- Down + closing
- —
- Monthly P&I
- —
- Monthly cashflow
- —
- DSCR
- —
- Eligible?
- —
No personal income docs; deal must DSCR.
Hard money
10% down · 12.0% · 12mo
- Down + closing
- —
- Monthly P&I
- —
- Monthly cashflow
- —
- DSCR
- —
- Eligible?
- —
Short-term bridge; refi at stabilization.
Rent comps 40 comps
| Address | Beds | Baths | Sqft | Rent | $/sqft | DOM | Units | Dist |
|---|---|---|---|---|---|---|---|---|
| 2812 Ernest St Jacksonville, FL | 3.0 | 1.0 | 1461 | $2,800 | $1.92 | 23d | 1 | 0.09mi |
| 2980 Ernest St Jacksonville, FL | 2.0 | 1.0 | 920 | $1,200 | $1.30 | 23d | 1 | 0.17mi |
| 809 McDuff Ave S Jacksonville, FL | 2.0 | 1.0 | 1006 | $995 | $0.99 | 4d | 1 | 0.21mi |
| 2759 Dellwood Ave Jacksonville, FL | 3.0 | 2.0 | 1080 | $2,100 | $1.94 | 20d | 1 | 0.25mi |
| 2892 College St Unit 2892-2 Jacksonville, FL | 1.0 | 1.0 | 700 | $1,195 | $1.71 | 17d | 1 | 0.28mi |
| 975 Willow Branch Ave Jacksonville, FL | 1.0 | 1.0 | 950 | $1,200 | $1.26 | 4d | 1 | 0.31mi |
| 717 King St Jacksonville, FL | 3.0 | 2.0 | 1132 | $1,800 | $1.59 | 17d | 1 | 0.31mi |
| 2929 Post St Jacksonville, FL | 1.0 | 1.0 | 950 | $1,100 | $1.16 | 4d | 1 | 0.32mi |
| 2803 College St Jacksonville, FL | 2.0 | 1.0 | 1100 | $1,550 | $1.41 | 14d | 1 | 0.32mi |
| 3036 Green St Jacksonville, FL | 3.0 | 1.0 | 924 | $1,495 | $1.62 | 23d | 1 | 0.34mi |
| 2908 Post St Apt 3 Jacksonville, FL | 1.0 | 1.0 | 720 | $995 | $1.38 | 14d | 1 | 0.34mi |
| 2908 Post St Unit 4 Jacksonville, FL | 1.0 | 1.0 | 720 | $995 | $1.38 | 2d | 1 | 0.34mi |
| 2701 Myra St Jacksonville, FL | 3.0 | 1.0 | 1065 | $1,595 | $1.50 | 21d | 1 | 0.38mi |
| 2777 Post St Jacksonville, FL | 2.0 | 1.0 | 1200 | $1,195 | $1.00 | 23d | 1 | 0.40mi |
| 420 Sunshine St Jacksonville, FL | 3.0 | 2.0 | 1050 | $1,350 | $1.29 | 1d | 1 | 0.41mi |
| 1052 Willow Branch Ave #2 Jacksonville, FL | 1.0 | 1.0 | 730 | $891 | $1.22 | 23d | 1 | 0.44mi |
| 1060 Cherry St Jacksonville, FL | 2.0 | 1.0 | 1356 | $1,623 | $1.20 | 21d | 1 | 0.45mi |
| 3159 Phyllis St Jacksonville, FL | 3.0 | 2.0 | 1209 | $1,561 | $1.29 | 3d | 1 | 0.46mi |
| 1098 Cherry St Unit 1 Jacksonville, FL | 1.0 | 1.0 | 700 | $1,250 | $1.79 | 17d | 1 | 0.52mi |
| 2653 College St Unit 2653 Jacksonville, FL | 1.0 | 1.0 | 907 | $1,295 | $1.43 | 2d | 1 | 0.52mi |
| 3233 Dellwood Ave Jacksonville, FL | 2.0 | 2.0 | 1000 | $1,750 | $1.75 | 23d | 1 | 0.52mi |
| 3236 Phyllis St Unit 3244 Jacksonville, FL | 2.0 | 1.0 | 720 | $850 | $1.18 | 23d | 1 | 0.54mi |
| 2614 Dellwood Ave Jacksonville, FL | 3.0 | 1.0 | 1122 | $2,325 | $2.07 | 4d | 1 | 0.54mi |
| 2786 Downing St Jacksonville, FL | 1.0 | 1.0 | 900 | $1,200 | $1.33 | 23d | 1 | 0.54mi |
| 1109 Cherry St Unit 4 Jacksonville, FL | 1.0 | 1.0 | 850 | $1,195 | $1.41 | 20d | 1 | 0.55mi |
| 2611 Green St Jacksonville, FL | 2.0 | 1.0 | 728 | $1,195 | $1.64 | 23d | 1 | 0.55mi |
| 2611 Green St Jacksonville, FL | 2.0 | 1.0 | 728 | $1,195 | $1.64 | 14d | 1 | 0.55mi |
| 3250 Phyllis St Jacksonville, FL | 2.0 | 1.0 | 720 | $850 | $1.18 | 23d | 1 | 0.56mi |
| 2657 Post St Apt 2 Jacksonville, FL | 3.0 | 1.0 | 1100 | $1,700 | $1.55 | 3d | 1 | 0.57mi |
| 828 Acosta St Unit 1 Jacksonville, FL | 1.0 | 1.0 | 806 | $1,150 | $1.43 | 23d | 1 | 0.57mi |
| 2561 Rosselle St #1 Jacksonville, FL | 3.0 | 3.0 | 1287 | $1,395 | $1.08 | 23d | 1 | 0.58mi |
| 2619 College St Unit 2 Jacksonville, FL | 1.0 | 1.0 | 700 | $1,050 | $1.50 | 23d | 1 | 0.58mi |
| 3233 Post St Jacksonville, FL | 2.0 | 1.0 | 750 | $1,095 | $1.46 | 23d | 1 | 0.60mi |
| 3312 Ernest St Jacksonville, FL | 3.0 | 1.0 | 1065 | $1,148 | $1.08 | 23d | 1 | 0.61mi |
| 371 Smith St Jacksonville, FL | 3.0 | 2.0 | 1050 | $1,325 | $1.26 | 4d | 1 | 0.62mi |
| 2526 Phyllis St Jacksonville, FL | 3.0 | 2.0 | 1300 | $1,800 | $1.38 | 23d | 1 | 0.62mi |
| 2842 Sydney St Unit 4 Jacksonville, FL | 2.0 | 1.0 | 1200 | $1,300 | $1.08 | 23d | 1 | 0.63mi |
| 3313 Green St Jacksonville, FL | 3.0 | 1.0 | 1058 | $1,450 | $1.37 | 7d | 1 | 0.63mi |
| 3035 Fitzgerald St Jacksonville, FL | 2.0 | 1.0 | 900 | $1,021 | $1.13 | 3d | 1 | 0.63mi |
| 2578 Haldumar Ter Jacksonville, FL | 2.0 | 1.0 | 1114 | $2,195 | $1.97 | 14d | 1 | 0.64mi |
Listing history 6 events
-
2026-06-13statusdays on market $120,000 Pending 7 DOM
-
2026-06-10days on market $120,000 Active 6 DOM
-
2026-06-08days on market $120,000 Active 5 DOM
-
2026-06-07days on market $120,000 Active 4 DOM
-
2026-06-05remarks 699-char remark
-
2026-06-05$120,000 Active 1 DOM
ⓘ Source: listings_history table (triggers on properties + properties_extension) + one-shot
backfill from property_details.listing_events for pre-trigger history.
Tax reassessment forecast FL · Resets to sale price
- Current annual tax
- $3,461 · $288/mo
- Projected year-2 tax
- $3,461 · $288/mo
- Expected delta
- $0/yr ($0/mo · 0.0%)
ⓘ Screening estimate from a state-policy table — verify with the county assessor before closing.
Climate risk First Street
- Flood 4/10 Moderate FEMA zone X (unshaded) · 22% chance over 30 yrs
- Wildfire 1/10 Low
- Heat 9/10 Extreme 7 d/yr ≥107°F today · 20 d/yr by 30 yrs out
- Wind 9/10 Extreme 99% chance of damaging wind over 30 yrs
- Air quality 5/10 Major 7 unhealthy d/yr today · 7 by 30 yrs out
Nearby sold comps map
Loading sold comps map…
Walkable amenities ~0.75 mi
Loading nearby amenities…
Taxation est. · year 1
- Rental income
- $18,280
- − Mortgage interest
- −$6,722
- − Property taxes
- −$3,461
- − Insurance
- −$600
- − Repairs & maintenance
- −$1,462
- − Management
- −$1,462
- − Depreciation
- −$3,491
- Taxable income
- $1,082
- Est. tax owed @ 24.0%
- −$260
- After-tax cash flow
- $2,569/yr
For passive investors: Depreciation is non-cash, so a rental often shows a tax loss while cash-flowing — sheltering income. Rental losses are passive: they offset passive income freely, and up to $25,000/yr can offset ordinary (W-2) income if you actively participate and your MAGI is under $100k (phasing out to $0 by $150k); unused losses carry forward. On sale, claimed depreciation is recaptured at up to 25%, and gains may owe capital-gains tax (a 1031 exchange can defer both). Figures are a year-1 estimate at your 24.0% rate — not tax advice; consult a CPA.
Schools (NCES district)
- District
- Duval
- NCES district ID
- 1200480
- Math proficiency
- 46% ▼ -11.00%
- Reading proficiency
- 45% ▼ -4.00%
- Median HH income
- $48,987
- Composite
- 38.97/100
- National rank
- #4076
- State rank
- #48 of 73 in FL
Livability — Jacksonville
- Score
- 83/100
- State rank
- #50
- US rank
- #911
Category grades
Schools grade is shown separately in the Schools card above.
Census & demographics
- Census place
- Jacksonville, FL
- County
- Duval County · 1,015,274 people
- City population
- 979,034
- Metro
- Jacksonville, FL
- Population (ZIP)
- 29,148
- Household income
- $64,789
- Rent vs Own
- Severe rent burden
- 1398.0
Population outlook (Duval County) Hauer SSP2
- Today (2025)
- 1,013,010 people
- By 2030
- 1,059,228 · +4.6%
- By 2040
- 1,141,439 · +12.7%
- By 2050
- 1,205,258 · +19.0%
- By 2075
- 1,324,282 · +30.7%
- By 2100
- 1,319,620 · +30.3%
Race, ethnicity, and origin ACS 2023
- Neighborhood character
- Diverse neighborhood (Simpson 0.59)
- Race & ethnicity
- White 59% Black 21% Hispanic / Latino 11% Two or more races 7% Asian 3%
- Hispanic origin (detail)
- Mexican 3% Puerto Rican 4% Cuban 1%
- Common ancestry
- Slovak 3% Lithuanian 2% Romanian 2%
- Foreign-born
- 8% · Canada, Vietnam, Dominican Republic
- Languages at home
- 88% English-only · Spanish 8% Vietnamese 1% French/Haitian/Cajun 1%
Political lean MEDSL · Duval
- 2024 margin
- Toss-up / Even · D 48.7% · R 50.1% · Other 1.2%
- 2008→2024 swing
- +0.4pp no change · 2008: -1.9pp · 2024: -1.5pp
- All cycles
- 2024: R+1.5 2020: D+3.8 2016: R+1.5 2012: R+3.6 2008: R+1.9
Not yet ingested
- Civics
- —
Market trends
- HPI YoY
- ▼ -386.70%
- Current HPI
- 310.4566
- Rent YoY
- ▲ 1.73%
- Metro
- Jacksonville, FL
- State GDP YoY
- ▲ 3.28%
- F500 in state
- 36
Industry mix (Fortune 500 HQ in FL)
| Industry | F500 HQs | Revenue |
|---|---|---|
| Industrial Technology | 2 | $29B |
|
||
| Insurance | 2 | $17B |
|
||
| Retail | 1 | $60B |
|
||
| Technology Distribution | 1 | $58B |
|
||
| Homebuilding | 1 | $35B |
|
||
| Technology Manufacturing | 1 | $35B |
|
||
Price history
+275.0% since first listed16 events — show timeline
- 2026-06-03 Listed $120,000 realMLS
- 2015-04-20 Sold (MLS) $29,500 realMLS
- 2015-03-05 Pending — realMLS
- 2015-02-18 Listed $27,900 realMLS
- 2007-03-16 Sold (Public Records) $115,000 Public Records
- 2007-03-08 Sold (MLS) $115,000 realMLS
- 2007-01-17 Listed $115,000 realMLS
- 2006-03-18 Listing Removed — realMLS
- 2006-03-07 Sold (MLS) $75,000 realMLS
- 2005-11-11 Listed $81,500 realMLS
- 2003-10-15 Sold (Public Records) $59,600 Public Records
- 2002-06-04 Listing Removed — realMLS
- 2002-04-22 Listed $59,900 realMLS
- 1994-06-10 Sold (Public Records) $20,000 Public Records
- 1989-07-01 Sold (Public Records) $36,000 Public Records
- 1984-04-01 Sold (Public Records) $32,000 Public Records
Property tax history
+8.5%/yrLatest (2025): $3,461 · +5.3% YoY. Source: county tax records.
Cash-flow waterfall
monthlySold comps — $/sqft
last 12 mo · ≤1 miLoading sold comps…