2904 Woodworth Pl · Hazel Crest, IL
Flood risk 1/10 · Minimal
- FEMA flood zone
- X (unshaded)
- Chance of flooding over 30 yrs
- 0.0%
- Est. flood insurance / yr
- $473 – $860
Fire risk 1/10 · Minimal
- Est. fire insurance / yr
- $804 – $1,492
Heat risk 3/10 · Minor
- Hot days now (above 101°F)
- 7 days/yr
- Hot days in 30 yrs
- 15 days/yr
Wind risk 2/10 · Minimal
- Chance of severe wind over 30 yrs
- —
Air-quality risk 3/10 · Minor
- Unhealthy air days now
- 4 days/yr
- Unhealthy air days in 30 yrs
- 4 days/yr
Risk factors via First Street. Map © Google.
Why this score? — see what drove the B grade
The composite is a weighted blend of 9 inputs, each scored 0–100. Each bar is that input's sub-score; the figure is the points it added to the 100-point composite (weight × sub-score).
- Cash flow +27.9/30.0
- ARV discount +15.0/15.0
- 1% rule +10.0/10.0
- DSCR +9.9/10.0
- Livability +3.8/5.0
- Rent growth +2.5/5.0
- Condition / age +2.5/5.0
- Schools +1.5/10.0
- Appreciation +0.0/10.0
$165,000
🖨 Deal sheet 📄 Offer letter ✓ Due diligence
Listing remarks MLS
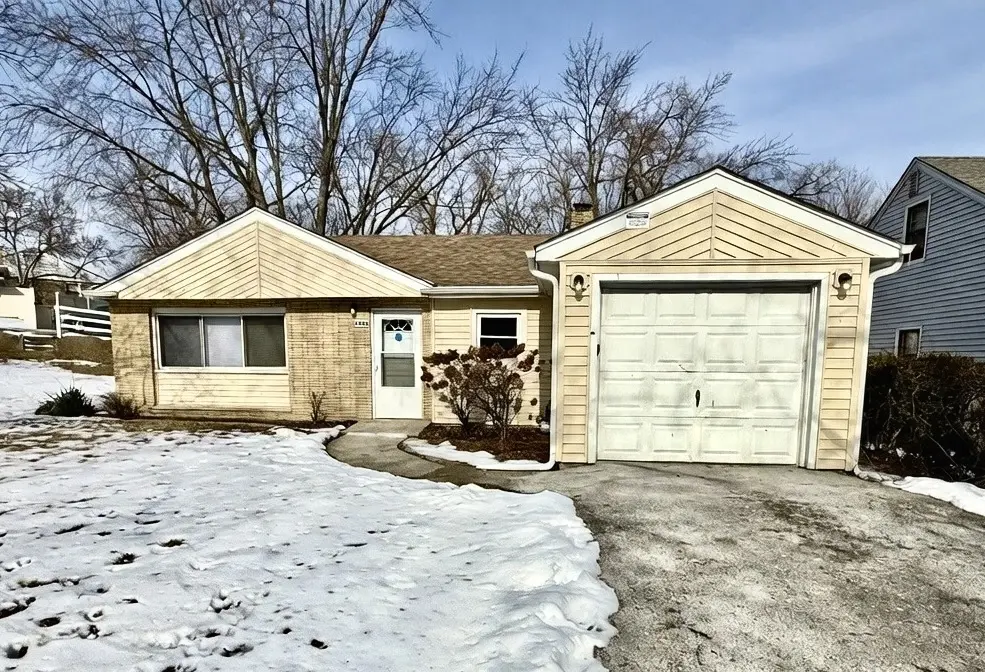
You better start packing!! Awesome ranch style home in move in condition. This home has been freshly painted throughout. Newer furnace and hot water heater. Gleaming wood laminate flooring. 1 Car attached garage. Ceramic tiled full bath. White Trim and six panel doors throughout. Huge yard. This home is just blocks off of the I-80/Kedzie interchange-such a great location. Don't let this one get away at this price!
Key facts
- Ample natural light
- Driveway for parking
- Manageable yard
Tags
Property features AI
Finance
- Other: Subdivision: Pottawatomie Hills; Corporate limits: Hazel Crest; Directions: Kedzie to 175th, east to Holmes, north to Woodworth
- HOA & community: No master association fee required
Exterior
- Parking: Attached garage with asphalt driveway (1 garage space, 1 total parking)
- Utilities: Water source: Lake Michigan; Public sewer; Electric: circuit breakers and fuses
- Home design: Detached single-family ranch; One-story (ranch) home; Fee simple ownership; Built before 1978
- Construction: Vinyl siding and brick exterior; Asphalt roof; Estimated age: 71–80 years
- Exterior features: Curbs; Street lights; Paved streets; Lot dimensions approximately 55 x 130
Interior
- Kitchen: Range; Refrigerator; Eating area / table space
- Bedrooms: Master bedroom on main level (14 x 12); Bedroom 2 on main level (12 x 11); Bedroom 3 on main level (10 x 10)
- Bathrooms: 1 full bathroom
- Heating & cooling: Natural gas forced air heating; Central air conditioning
- Interior features: 5 total rooms; Unfinished attic
- Laundry & utility: Main-level laundry (10 x 10); Utility room on main level (10 x 12)
Neighborhood map
What this means for you Summary
Snapshot
- This is a 3-bed/1.0-bath single-family listed at $165k.
Deal economics
- At list price, monthly cash flow is $508 ($6k/yr) — positive.
- The deal already cash-flows at list — no discount required.
- Meets the 1% rule at list price ($2k rent vs $165k).
Location & tenants
- Location reads 75/100 on livability (#229 in IL, #4,242 nationally) — a middle-class / working-renter tenant base. Strengths: commute A+, cost of living A+, housing A+; Watch: health & safety C-, schools D-, crime F.
- Bremen Chsd 228 (suburban): math 15% / reading 17% proficiency, ranked #468 of 620 in IL (top 76%) — low school quality limits family demand, transient renter base, plan for 1-2y turnover.
- Market conditions: 80 active listings in the ZIP; 12 comparable units currently listed for rent nearby; rentals leasing fast (median 1d on market — plan ~1-2 weeks tenant-placement turnaround); 6,272 units permitted in Cook County in 2024 (4,658 in 5+ unit buildings).
Forward outlook
- Local home prices are declining (-3.0%/yr); year-one equity from $1k of loan paydown is wiped out by about $5k of value loss. Plan a longer hold.
- At projected returns (-3.0% appreciation + 3.0% rent growth), your $46k cash investment doubles in ~9 years — after that, you're playing with house money.
Negotiation context
- Only 6 days on market — expect competitive offers; lowballing is unlikely to land.
- 17 sale attempts since 20y ago; this cycle's ask has dropped $26k (14%) from the opening price — seller is motivated, your offer sets the floor, not the list.
- Current owner paid $80k; list at $165k implies a 106% gain — meaningful room to come down on a strong offer.
Risks & watch-outs
- Watch-outs: property tax is 3.8% of price; built in 1953 — expect roof / HVAC / electrical / plumbing capex.
Questions for the listing agent
- Built in 1953 — when were the roof, HVAC, electrical panel, plumbing, and water heater last replaced?
- Property tax is high relative to price — has the assessment been appealed recently, and will the sale trigger a re-assessment?
- Is there a deadline driving the sale (1031 exchange, divorce, estate, relocation)? That informs how much negotiation room exists.
- Schools are D-rated, which usually means shorter tenancies and higher turnover. Who's the typical renter profile here, and what's been the actual vacancy rate?
- Crime grade is F in this area — have there been break-ins, vandalism, or insurance claims at this property in the last 3 years? What carrier currently insures it and at what premium?
- What's the average days-on-market for RENTAL listings here right now (not sales)? A rising rental-DOM trend means longer vacancies and softer asking-rent achievability than the comps imply.
- What's the recent tenant-quality profile in this submarket — average credit score on applications, eviction rate, late-payment / NSF rate, and stable-employment percentage? A property-management company in the area should have these aggregated.
- How much new for-sale + rental construction is in the pipeline within 1–3 miles? Heavy new supply typically softens prices + rents 12–24 months out; constrained supply supports both.
Investment metrics
- 1% rule
- 1.51% ✓
- Cap rate
- 9.98%
- Cash-on-cash
- 13.18%
- DSCR
- 1.59
- GRM
- 5.5
CMA / ARV
- ARV (on-the-fly)
- $206,208
- Comps found
- 12
Show comp detail 12 sales within ~0.75 mi
| Address | Dist | Beds/Ba | Sqft | Sold | Price | $/sf | Match |
|---|---|---|---|---|---|---|---|
| 17312 Poe Ave | 0.30mi | 4/1.0 (+1) | 1,187 (+3%) | 0mo | $199,000 | $168 | 76 |
| 17417 Kedzie Ave | 0.39mi | 3/2.0 | 1,100 (-4%) | 0mo | $200,000 | $182 | 70 |
| 2800 Lexington Dr | 0.31mi | 3/2.0 | 1,073 (-7%) | 0mo | $180,000 | $168 | 70 |
| 2912 175th St | 0.31mi | 3/1.0 | 1,044 (-9%) | 3mo | $209,500 | $201 | 67 |
| 3213 Woodworth Pl | 0.38mi | 3/1.5 | 1,246 (+8%) | 2mo | $145,000 | $116 | 65 |
| 3318 Tulip Dr | 0.58mi | 3/1.5 | 1,093 (-5%) | 1mo | $225,000 | $206 | 61 |
| 3124 173rd St | 0.27mi | 4/2.0 (+1) | 1,255 (+9%) | 4mo | $238,000 | $190 | 60 |
| 3317 Woodworth Pl | 0.53mi | 3/1.5 | 1,246 (+8%) | 4mo | $166,000 | $133 | 56 |
| 2722 Cherrywood Pl | 0.53mi | 3/1.5 | 1,258 (+9%) | 3mo | $260,000 | $207 | 56 |
| 17622 Oakwood Dr | 0.57mi | 3/1.5 | 1,257 (+9%) | 3mo | $115,000 | $91 | 54 |
| 3324 Laurel Ln | 0.58mi | 4/1.5 (+1) | 1,056 (-8%) | 4mo | $188,700 | $179 | 49 |
| 3321 Tulip Dr | 0.57mi | 4/2.0 (+1) | 1,287 (+12%) | 4mo | $220,000 | $171 | 42 |
Match score weights: distance 35% · size 25% · config 20% · recency 20%. Top-matched comps best support the ARV.
Projected returns pro-forma
-3.0% appreciation · 3.0% rent growth · sell at horizon
- IRR
- 3.3%
- Equity multiple
- 1.13×
- Total profit
- $5,821
- Equity at exit
- $24,602
- IRR
- 12.9%
- Equity multiple
- 2.03×
- Total profit
- $47,636
- Equity at exit
- $14,266
Cash invested: $46,200 (down + closing). Projections, not guarantees.
Landlord ↔ Tenant lean methodology
- Overall (STATE)
- 43 Moderately Tenant-Leaning
- State Illinois
- 43 Moderately Tenant-Leaning · D+7
- County
- — inherits STATE
- City
- — inherits STATE
ZIP-level market 60429
- Home prices YoY
- -14.0%
- Active inventory
- 80
- Price-to-rent
- 5.5×
Monthly cashflow live
- Estimated rent
- $2,486 high interval (Pro) →
- Mortgage (P&I)
- −$865
- Tax from tax record
- −$522 /mo · $6,266/yr
- Insurance
- −$69
- HOA
- −$0
- Vacancy / Maint / Mgmt
- −$522
- Net cashflow
- $508
Break-even live
UW: 25.0% down · 7.5% · 30yr · 1.5% tax · 5.0% vac · 8.0% maint · 8.0% mgmt
Financing live
Cash to close
- Down payment
- $41,250
- Closing costs
- $4,950
- Reserves months
- —
- Total cash needed
- —
Loan-product check · same deal, 3 products live
Conventional
25% down · 7.5% · 30yr
- Down + closing
- —
- Monthly P&I
- —
- Monthly cashflow
- —
- DSCR
- —
- Eligible?
- —
Personal DTI + credit; lowest rate.
DSCR
20% down · 8.5% · 30yr
- Down + closing
- —
- Monthly P&I
- —
- Monthly cashflow
- —
- DSCR
- —
- Eligible?
- —
No personal income docs; deal must DSCR.
Hard money
10% down · 12.0% · 12mo
- Down + closing
- —
- Monthly P&I
- —
- Monthly cashflow
- —
- DSCR
- —
- Eligible?
- —
Short-term bridge; refi at stabilization.
Rent comps 12 comps
| Address | Beds | Baths | Sqft | Rent | $/sqft | DOM | Units | Dist |
|---|---|---|---|---|---|---|---|---|
| 2722 Larkspur Ln Hazel Crest, IL | 3.0 | 1.5 | 1441 | $2,650 | $1.84 | 12d | 1 | 0.53mi |
| 16752 Artesian Ave Hazel Crest, IL | 3.0 | 1.0 | 867 | $2,500 | $2.88 | 1d | 1 | 0.86mi |
| 2308 170th St Hazel Crest, IL | 3.0 | 2.0 | 1020 | $2,400 | $2.35 | 1d | 1 | 0.87mi |
| 16901 Orchard Ridge Ave Hazel Crest, IL | 4.0 | 2.0 | 1406 | $2,700 | $1.92 | 1d | 1 | 0.88mi |
| 3501 177th St Country Club Hills, IL | 2.0 | 2.0 | 839 | $2,850 | $3.40 | 1d | 1 | 0.92mi |
| 2173 171st St Hazel Crest, IL | 3.0 | 1.5 | 1159 | $2,350 | $2.03 | 1d | 1 | 1.00mi |
| 17561 Hillside Ave Homewood, IL | 3.0 | 1.0 | 1174 | $2,500 | $2.13 | 16d | 1 | 1.03mi |
| 17561 Hillside Ave Homewood, IL | 3.0 | 1.0 | 1174 | $2,300 | $1.96 | 1d | 1 | 1.03mi |
| 16751 Crane Ave Hazel Crest, IL | 3.0 | 1.0 | 1200 | $1,800 | $1.50 | 1d | 1 | 1.08mi |
| 2107 171st St Unit 2107 Hazel Crest, IL | 3.0 | 1.5 | 1158 | $2,300 | $1.99 | 1d | 1 | 1.09mi |
| 17306 Peach Grove Ln Hazel Crest, IL | 4.0 | 1.0 | 1034 | $2,700 | $2.61 | 1d | 1 | 1.11mi |
| 3515 Bordeaux Ct Hazel Crest, IL | 4.0 | 2.0 | 1486 | $2,900 | $1.95 | 1d | 1 | 1.31mi |
Listing history 50 events
-
2026-06-18days on market $165,000 Active 6 DOM
-
2026-06-17days on market $165,000 Active 5 DOM
-
2026-06-16days on market $165,000 Active 4 DOM
-
2026-06-15days on market $165,000 Active 3 DOM
-
2026-06-13days on market $165,000 Active 1 DOM
-
2026-06-09days on market $165,000 Active 117 DOM
-
2026-06-08days on market $165,000 Active 116 DOM
-
2026-06-07days on market $165,000 Active 115 DOM
-
2026-06-04days on market $165,000 Active 112 DOM
-
2026-06-03days on market $165,000 Active 111 DOM
-
2026-06-02days on market $165,000 Active 110 DOM
-
2026-06-01days on market $165,000 Active 109 DOM
-
2026-05-31days on market $165,000 Active 108 DOM
-
2026-05-15price $165,000
-
2026-04-17price $172,000
-
2026-03-27price $179,000
-
2026-03-06price $185,000
-
2026-02-13historical $1,946
-
2026-02-12$191,000 Active
-
2026-02-07price $1,946
-
2026-01-31price $1,996
-
2026-01-13price $2,026
-
2026-01-09price $2,015
-
2026-01-04price $2,080
-
2025-12-25price $2,150
-
2025-12-19$2,225
-
2025-12-18historical $2,380
-
2025-12-16price $2,380
-
2025-12-05price $2,440
-
2025-12-02$2,500
-
2025-12-02historical $2,500
-
2025-11-28price $2,500
-
2025-11-22price $2,565
-
2025-11-15price $2,600
-
2025-11-01$2,665
-
2025-11-01historical $2,665
-
2025-10-16$2,665
-
2024-11-18historical $1,845
-
2024-11-16historical $1,845
-
2024-11-08price $1,845
-
2024-11-07price $1,845
-
2024-11-06$1,660
-
2024-11-06$1,660
-
2024-02-11historical $1,750
-
2024-02-09historical $1,750
-
2024-01-20price $1,750
-
2024-01-18price $1,750
-
2024-01-13price $1,840
-
2024-01-10price $1,840
-
2024-01-04price $1,895
ⓘ Source: listings_history table (triggers on properties + properties_extension) + one-shot
backfill from property_details.listing_events for pre-trigger history.
Tax reassessment forecast IL · Partial reset (capped growth)
- Current annual tax
- $6,266 · $522/mo
- Projected year-2 tax
- $6,266 · $522/mo
- Expected delta
- $0/yr ($0/mo · 0.0%)
ⓘ Screening estimate from a state-policy table — verify with the county assessor before closing.
Climate risk First Street
- Flood 1/10 Low FEMA zone X (unshaded) · 0% chance over 30 yrs
- Wildfire 1/10 Low
- Heat 3/10 Moderate 7 d/yr ≥101°F today · 15 d/yr by 30 yrs out
- Wind 2/10 Low
- Air quality 3/10 Moderate 4 unhealthy d/yr today · 4 by 30 yrs out
Nearby sold comps map
Loading sold comps map…
Walkable amenities ~0.75 mi
Loading nearby amenities…
Taxation est. · year 1
- Rental income
- $29,829
- − Mortgage interest
- −$9,243
- − Property taxes
- −$6,266
- − Insurance
- −$825
- − Repairs & maintenance
- −$2,386
- − Management
- −$2,386
- − Depreciation
- −$4,800
- Taxable income
- $3,923
- Est. tax owed @ 24.0%
- −$942
- After-tax cash flow
- $5,149/yr
For passive investors: Depreciation is non-cash, so a rental often shows a tax loss while cash-flowing — sheltering income. Rental losses are passive: they offset passive income freely, and up to $25,000/yr can offset ordinary (W-2) income if you actively participate and your MAGI is under $100k (phasing out to $0 by $150k); unused losses carry forward. On sale, claimed depreciation is recaptured at up to 25%, and gains may owe capital-gains tax (a 1031 exchange can defer both). Figures are a year-1 estimate at your 24.0% rate — not tax advice; consult a CPA.
Schools (NCES district)
- District
- Bremen Chsd 228
- NCES district ID
- 1707050
- Math proficiency
- 15% ▼ -4.00%
- Reading proficiency
- 17% ▼ -5.00%
- Median HH income
- $57,625
- Composite
- 15.32/100
- National rank
- #9327
- State rank
- #468 of 620 in IL
Livability — Hazel Crest
- Score
- 75/100
- State rank
- #229
- US rank
- #4242
Category grades
Schools grade is shown separately in the Schools card above.
Census & demographics
- Census place
- Hazel Crest, IL
- City population
- 14,602
- Population (ZIP)
- 14,602
Population outlook (Cook County) Hauer SSP2
- Today (2025)
- 5,347,519 people
- By 2030
- 5,357,703 · +0.2%
- By 2040
- 5,324,924 · -0.4%
- By 2050
- 5,230,762 · -2.2%
- By 2075
- 4,785,735 · -10.5%
- By 2100
- 4,188,836 · -21.7%
Race, ethnicity, and origin ACS 2023
- Neighborhood character
- Predominantly Black (83%)
- Race & ethnicity
- Black 83% White 7% Hispanic / Latino 7% Two or more races 4%
- Hispanic origin (detail)
- Mexican 6%
- Common ancestry
- Romanian 1% Iranian 1%
- Foreign-born
- 5% · Canada
- Languages at home
- 93% English-only · Spanish 6%
Political lean MEDSL · Cook
- 2024 margin
- Solid D (+42.0) · D 70.4% · R 28.4% · Other 1.2%
- 2008→2024 swing
- -11.4pp toward R · 2008: 53.4pp · 2024: 42.0pp
- All cycles
- 2024: D+42.0 2020: D+50.3 2016: D+53.0 2012: D+49.4 2008: D+53.4
Not yet ingested
- Civics
- —
Market trends
- HPI YoY
- ▼ -46.04%
- Current HPI
- 282.3552
- Rent YoY
- —
- Metro
- —
- State GDP YoY
- ▲ 1.59%
- F500 in state
- 60
Industry mix (Fortune 500 HQ in IL)
| Industry | F500 HQs | Revenue |
|---|---|---|
| Insurance | 4 | $201B |
|
||
| Consumer Goods | 4 | $87B |
|
||
| Industrial Machinery | 3 | $64B |
|
||
| Healthcare | 2 | $55B |
|
||
| Retail / Pharmacy | 1 | $148B |
|
||
| Agriculture / Food | 1 | $86B |
|
||
Price history
+41.6% since first listed83 events — show timeline
- 2026-05-15 Price Changed $165,000 MRED as Distributed by MLS Grid
- 2026-04-17 Price Changed $172,000 MRED as Distributed by MLS Grid
- 2026-03-27 Price Changed $179,000 MRED as Distributed by MLS Grid
- 2026-03-06 Price Changed $185,000 MRED as Distributed by MLS Grid
- 2026-02-13 Rental Removed $1,946 RENTLY
- 2026-02-12 Listed $191,000 MRED as Distributed by MLS Grid
- 2026-02-07 Price Changed $1,946 RENTLY
- 2026-01-31 Price Changed $1,996 RENTLY
- 2026-01-13 Price Changed $2,026 RENTLY
- 2026-01-09 Price Changed $2,015 RENTLY
- 2026-01-04 Price Changed $2,080 RENTLY
- 2025-12-25 Price Changed $2,150 RENTLY
- 2025-12-19 Listed for Rent $2,225 RENTLY
- 2025-12-18 Rental Removed $2,380 RENTLY
- 2025-12-16 Price Changed $2,380 RENTLY
- 2025-12-05 Price Changed $2,440 RENTLY
- 2025-12-02 Listed for Rent $2,500 RENTLY
- 2025-12-02 Rental Removed $2,500 ZUMPER1
- 2025-11-28 Price Changed $2,500 ZUMPER1
- 2025-11-22 Price Changed $2,565 ZUMPER1
- 2025-11-15 Price Changed $2,600 ZUMPER1
- 2025-11-01 Listed for Rent $2,665 ZUMPER1
- 2025-11-01 Rental Removed $2,665 RENTLY
- 2025-10-16 Listed for Rent $2,665 RENTLY
- 2024-11-18 Rental Removed $1,845 RENTLY
- 2024-11-16 Rental Removed $1,845 RENT.
- 2024-11-08 Price Changed $1,845 RENTLY
- 2024-11-07 Price Changed $1,845 RENT.
- 2024-11-06 Listed for Rent $1,660 RENTLY
- 2024-11-06 Listed for Rent $1,660 RENT.
- 2024-02-11 Rental Removed $1,750 RENTLY
- 2024-02-09 Rental Removed $1,750 RENT.
- 2024-01-20 Price Changed $1,750 RENTLY
- 2024-01-18 Price Changed $1,750 RENT.
- 2024-01-13 Price Changed $1,840 RENTLY
- 2024-01-10 Price Changed $1,840 RENT.
- 2024-01-04 Price Changed $1,895 RENTLY
- 2024-01-04 Price Changed $1,895 RENT.
- 2023-12-21 Price Changed $1,925 RENTLY
- 2023-12-20 Price Changed $1,925 RENT.
- 2023-12-15 Price Changed $1,950 RENTLY
- 2023-12-14 Price Changed $1,950 RENT.
- 2023-12-14 Price Changed $1,995 RENTLY
- 2023-12-07 Price Changed $1,995 RENT.
- 2023-11-30 Listed for Rent $2,045 RENTLY
- 2023-11-29 Listed for Rent $2,045 RENT.
- 2023-09-02 Rental Removed $2,045 RENTLY
- 2023-08-30 Rental Removed $2,045 RENT.
- 2023-08-30 Price Changed $2,045 RENTLY
- 2023-08-29 Price Changed $2,075 RENTLY
- 2023-08-25 Price Changed $2,075 RENT.
- 2023-08-23 Price Changed $2,165 RENTLY
- 2023-08-22 Price Changed $2,165 RENT.
- 2023-08-19 Price Changed $2,225 RENTLY
- 2023-08-18 Price Changed $2,225 RENT.
- 2023-08-17 Price Changed $2,245 RENTLY
- 2023-08-16 Price Changed $2,245 RENT.
- 2023-08-12 Price Changed $2,425 RENTLY
- 2023-08-11 Price Changed $2,425 RENT.
- 2023-08-06 Listed for Rent $2,135 RENT.
- 2023-08-06 Listed for Rent $2,135 RENTLY
- 2023-07-18 Rental Removed — RENTLY
- 2023-07-14 Rental Removed — RENT.
- 2017-11-27 Sold (Public Records) $80,000 Public Records
- 2017-11-20 Sold (MLS) $80,000 MRED as Distributed by MLS Grid
- 2017-10-30 Pending — MRED as Distributed by MLS Grid
- 2017-10-13 Relisted — MRED as Distributed by MLS Grid
- 2017-08-08 Pending — MRED as Distributed by MLS Grid
- 2017-07-30 Listed $89,900 MRED as Distributed by MLS Grid
- 2016-10-05 Listing Removed — MRED as Distributed by MLS Grid
- 2016-04-16 Price Changed — MRED as Distributed by MLS Grid
- 2016-02-23 Listed — MRED as Distributed by MLS Grid
- 2016-02-23 Listing Removed — MRED as Distributed by MLS Grid
- 2015-10-05 Listed — MRED as Distributed by MLS Grid
- 2012-07-12 Sold (MLS) $23,700 MRED as Distributed by MLS Grid
- 2012-05-14 Contingent — MRED as Distributed by MLS Grid
- 2012-05-14 Price Changed $24,900 MRED as Distributed by MLS Grid
- 2012-05-14 Listed $139,900 MRED as Distributed by MLS Grid
- 2007-03-15 Sold (Public Records) $140,000 Public Records
- 2007-03-12 Sold (MLS) $139,900 MRED as Distributed by MLS Grid
- 2007-01-30 Listing Removed — MRED as Distributed by MLS Grid
- 2006-10-31 Listed $139,900 MRED as Distributed by MLS Grid
- 2004-08-02 Sold (Public Records) $116,500 Public Records
Property tax history
+3.4%/yrLatest (2023): $6,266 · +9.0% YoY. Source: county tax records.
Cash-flow waterfall
monthlySold comps — $/sqft
last 12 mo · ≤1 miLoading sold comps…