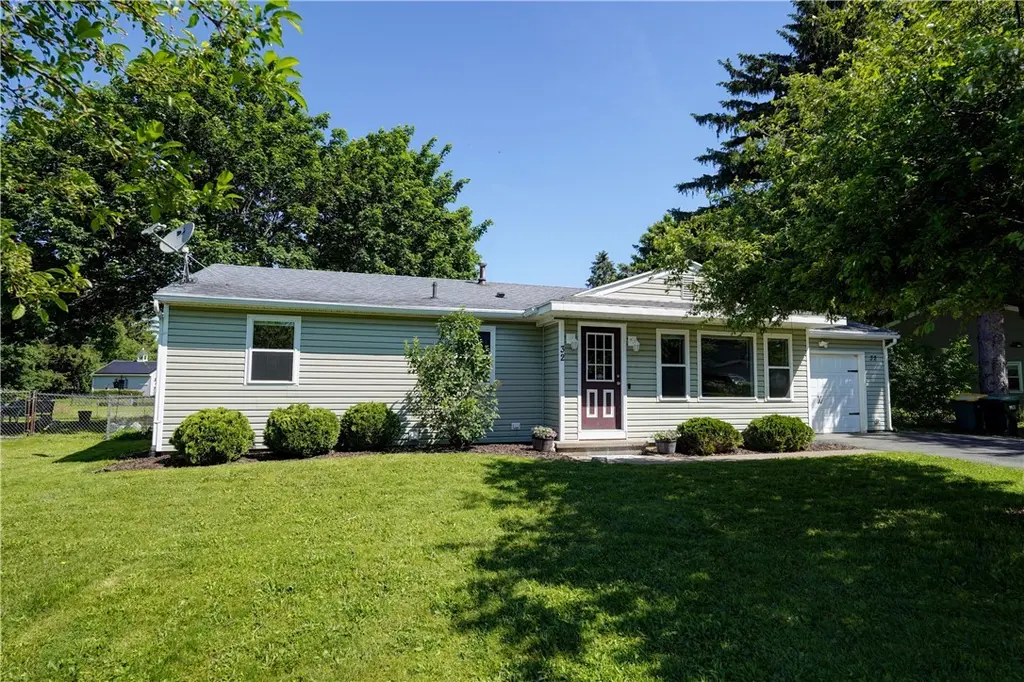
32 New Gate Dr · Brighton, NY
Flood risk 1/10 · Minimal
- FEMA flood zone
- X (unshaded)
- Chance of flooding over 30 yrs
- 0.0%
- Est. flood insurance / yr
- $473 – $860
Fire risk 1/10 · Minimal
- Est. fire insurance / yr
- $691 – $1,283
Heat risk 2/10 · Minimal
- Hot days now (above 94°F)
- 7 days/yr
- Hot days in 30 yrs
- 15 days/yr
Wind risk 1/10 · Minimal
- Chance of severe wind over 30 yrs
- —
Air-quality risk 2/10 · Minimal
- Unhealthy air days now
- 1 days/yr
- Unhealthy air days in 30 yrs
- 1 days/yr
Risk factors via First Street. Map © Google.
Why this score? — see what drove the D+ grade
The composite is a weighted blend of 9 inputs, each scored 0–100. Each bar is that input's sub-score; the figure is the points it added to the 100-point composite (weight × sub-score).
- ARV discount +13.7/15.0
- Cash flow +11.9/30.0
- Schools +5.2/10.0
- 1% rule +5.0/10.0
- Livability +4.0/5.0
- DSCR +3.5/10.0
- Rent growth +2.8/5.0
- Condition / age +2.5/5.0
- Appreciation +0.0/10.0
$199,900
🖨 Deal sheet (PDF) 📄 Offer letter ✓ Due diligence
Listing remarks MLS
APPROVED Bank Short Sale! Great value! Close to schools, shopping and entertainment! Great mechanics! Re-roof, furnace and air within the last 5 years! Oversized lot for the area! Needs cosmetics and your finishing touches, but you won't find a better deal in Henrietta! Make an appointment today!
Key facts
- Attached garage
- Egress window
- Updated bathrooms
Tags
Property features AI
Exterior
- Parking: Attached heated garage; Driveway; 1 garage space
- Utilities: Public water connected; Sewer connected; High-speed internet available; Cable available; Circuit breaker electric
- Home design: Single-story home; Existing construction
- Construction: Vinyl siding; Copper plumbing; Asphalt shingle roof; Block foundation
- Exterior features: Blacktop driveway; Deck (open); Porch; Fence (partial); Play structure; Private yard; Shed(s)/storage; See remarks
Interior
- Kitchen: Dishwasher; Gas oven; Gas range; Microwave; Refrigerator
- Bedrooms: Three main-level bedrooms
- Flooring: Carpet; Luxury vinyl; Resilient flooring; Varied flooring
- Bathrooms: One full bathroom; One half bathroom
- Heating & cooling: Gas forced-air heating; Central air conditioning
- Interior features: Entrance foyer; Eat-in kitchen; Great room; Home office; Kitchen/family room combo; Pantry; Sliding glass doors; Convertible bedroom; Programmable thermostat; Thermal windows; Sliding doors; See remarks
- Laundry & utility: Laundry in basement; Gas water heater
Neighborhood map
What this means for you Summary
Snapshot
- This is a 3-bed/1.5-bath single-family listed at $200k.
Deal economics
- At list price, monthly cash flow is $-50 ($-605/yr) — negative.
- To cash-flow at today's rent, offer at most $191k (4.5% below list).
- To meet the 1% rule (rent ≥ 1% of price), the offer needs to be $199k (0.5% below list).
- Recommended offer: $191k (4.5% below list) — sets the bar for cash-flow.
- Cap rate 6.0% vs local median 3.9% in Brighton — top-decile yield for the area; either an underpriced asset or a hidden risk that comps aren't pricing in. Stress-test before assuming the spread holds.
Location & tenants
- Location reads 81/100 on livability (#89 in NY, #1,379 nationally) — a professional / high-income tenant draw. Strengths: housing A+, health & safety A+, employment B+; Watch: crime D+, amenities D-.
- Rush-Henrietta Central School District (suburban): math 62% / reading 57% proficiency, ranked #237 of 590 in NY (top 40%) — acceptable for families but not a draw, mixed tenant base, ~2y average lease.
- Zoned schools: Floyd S Winslow Elementary School (math 72% / reading 67%, grade A-, #447 of 2,108 statewide, top 24%, 488 students, 33% FRL); Charles H Roth Junior High School (math 42% / reading 57%, grade C, #280 of 729 statewide, top 40%, 531 students, 55% FRL); Rush-Henrietta Senior High School (math 97% / reading 72%, grade A, #379 of 1,100 statewide, top 36%, 1,300 students, 43% FRL).
- Market conditions: Rents rising (+1.3%/yr); 39 active listings in the ZIP; 1 comparable units currently listed for rent nearby; solid renter incomes; 1,169 units permitted in Monroe County in 2024 (591 in 5+ unit buildings).
Forward outlook
- Local home prices are declining (-3.0%/yr); year-one equity from $1k of loan paydown is wiped out by about $6k of value loss. Plan a longer hold.
- Monroe County population projected to shrink 6% by 2050 — rents likely to lag national; underwrite the cash flow, not the appreciation.
Negotiation context
- Only 6 days on market — expect competitive offers; lowballing is unlikely to land.
- 2 sale attempts since 11y ago with the ask held roughly flat each time — persistent listings suggest the price (not the market) is what's stuck; bring a comps-based counter.
- Current owner paid $82k; list at $200k implies a 142% gain — meaningful room to come down on a strong offer.
Risks & watch-outs
- Watch-outs: property tax is 2.9% of price.
Questions for the listing agent
- What do current leases actually rent for vs. the listed asking? Can we see a recent rent roll and the last 12 months of T-12 income?
- Built in 1978 — when were the roof, HVAC, electrical panel, plumbing, and water heater last replaced?
- Property tax is high relative to price — has the assessment been appealed recently, and will the sale trigger a re-assessment?
- Is there a deadline driving the sale (1031 exchange, divorce, estate, relocation)? That informs how much negotiation room exists.
- Schools are B-rated — typically a magnet for longer-tenancy family renters. What's the average tenant stay here, and is there a school-zone premium baked into asking?
- Crime grade is D in this area — have there been break-ins, vandalism, or insurance claims at this property in the last 3 years? What carrier currently insures it and at what premium?
- The area grade is low — what's the realistic commute time and amenity access for the typical tenant pool here? Any planned neighborhood developments (good or bad) we should know about?
- What's the average days-on-market for RENTAL listings here right now (not sales)? A rising rental-DOM trend means longer vacancies and softer asking-rent achievability than the comps imply.
- What's the recent tenant-quality profile in this submarket — average credit score on applications, eviction rate, late-payment / NSF rate, and stable-employment percentage? A property-management company in the area should have these aggregated.
- How much new for-sale + rental construction is in the pipeline within 1–3 miles? Heavy new supply typically softens prices + rents 12–24 months out; constrained supply supports both.
Investment metrics
- 1% rule
- 1.00% ✗
- Cap rate
- 5.99%
- Cash-on-cash
- -1.08%
- DSCR
- 0.95
- GRM
- 8.4
CMA / ARV
- ARV (on-the-fly)
- $231,756
- Comps found
- 12
Show comp detail 12 sales within ~0.75 mi
| Address | Dist | Beds/Ba | Sqft | Sold | Price | $/sf | Match |
|---|---|---|---|---|---|---|---|
| 65 Masthead | 0.10mi | 3/1.5 | 1,052 (-2%) | 8mo | $270,000 | $257 | 86 |
| 28 Campfire Rd S | 0.43mi | 3/1.5 | 1,056 (-1%) | 7mo | $240,000 | $227 | 72 |
| 53 Campfire Rd S | 0.49mi | 3/1.0 | 1,056 (-1%) | 8mo | $221,600 | $210 | 67 |
| 1900 Lehigh Station Rd | 0.13mi | 3/1.0 | 1,175 (+10%) | 10mo | $225,000 | $191 | 67 |
| 1108 Farnsworth Rd S | 0.45mi | 3/1.0 | 1,108 (+4%) | 6mo | $220,000 | $199 | 66 |
| 12 Buffalo Horn Cir | 0.50mi | 3/1.0 | 1,056 (-1%) | 11mo | $262,500 | $249 | 64 |
| 132 Colony Ln | 0.41mi | 3/1.0 | 1,120 (+5%) | 10mo | $243,000 | $217 | 62 |
| 85 Campfire Rd N | 0.56mi | 3/1.0 | 1,056 (-1%) | 10mo | $215,000 | $204 | 62 |
| 87 Colony Ln | 0.53mi | 3/1.0 | 1,120 (+5%) | 7mo | $235,000 | $210 | 59 |
| 267 Valiant Dr | 0.22mi | 2/1.0 (-1) | 1,224 (+15%) | 1mo | $300,000 | $245 | 58 |
| 57 Blackwell Ln | 0.68mi | 2/1.0 (-1) | 1,146 (+7%) | 6mo | $280,000 | $244 | 44 |
| 40 Colleen | 0.62mi | 3/1.0 | 1,225 (+15%) | 11mo | $241,000 | $197 | 36 |
Match score weights: distance 35% · size 25% · config 20% · recency 20%. Top-matched comps best support the ARV.
Projected returns pro-forma
-3.0% appreciation · 1.28% rent growth · sell at horizon
- IRR
- -20.3%
- Equity multiple
- 0.31×
- Total profit
- $-38,812
- Equity at exit
- $29,806
- IRR
- -18.3%
- Equity multiple
- 0.10×
- Total profit
- $-50,627
- Equity at exit
- $17,284
Cash invested: $55,972 (down + closing). Projections, not guarantees.
Landlord ↔ Tenant lean methodology
- Overall (STATE)
- 15 Strongly Tenant-Friendly
- State New York
- 15 Strongly Tenant-Friendly · D+10
- County
- — inherits STATE
- City
- — inherits STATE
ZIP-level market 14467
- Home prices YoY
- -13.8%
- Rents YoY
- 1.3%
- Active inventory
- 39
- Price-to-rent
- 8.4×
Monthly cashflow live
- Estimated rent
- $1,989 medium interval (Pro) →
- Mortgage (P&I)
- −$1,048
- Tax from tax record
- −$490 /mo · $5,884/yr
- Insurance
- −$83
- HOA
- −$0
- Vacancy / Maint / Mgmt
- −$418
- Net cashflow
- $-50
Break-even live
Sensitivity live
| Price | -10% $63 | -5% $6 | +0% $-50 | +5% $-107 | +10% $-164 |
|---|---|---|---|---|---|
| Rent | -10% $-208 | -5% $-129 | +0% $-50 | +5% $28 | +10% $107 |
| Rate | -1.0pp $50 | -0.5pp $0 | base $-50 | +0.5pp $-102 | +1.0pp $-155 |
UW: 25.0% down · 7.5% · 30yr · 1.5% tax · 5.0% vac · 8.0% maint · 8.0% mgmt
Financing live
Cash to close
- Down payment
- $49,975
- Closing costs
- $5,997
- Reserves months
- —
- Total cash needed
- —
Loan-product check · same deal, 3 products live
Conventional
25% down · 7.5% · 30yr
- Down + closing
- —
- Monthly P&I
- —
- Monthly cashflow
- —
- DSCR
- —
- Eligible?
- —
Personal DTI + credit; lowest rate.
DSCR
20% down · 8.5% · 30yr
- Down + closing
- —
- Monthly P&I
- —
- Monthly cashflow
- —
- DSCR
- —
- Eligible?
- —
No personal income docs; deal must DSCR.
Hard money
10% down · 12.0% · 12mo
- Down + closing
- —
- Monthly P&I
- —
- Monthly cashflow
- —
- DSCR
- —
- Eligible?
- —
Short-term bridge; refi at stabilization.
Rent comps 1 comps
| Address | Beds | Baths | Sqft | Rent | $/sqft | DOM | Units | Dist |
|---|---|---|---|---|---|---|---|---|
| 41 High Manor Dr Henrietta, NY | 1.0–2.0 | 1.0 | 950 | $1,695 | $1.78 | 4d | 19 | 1.47mi |
Listing history 6 events
-
2026-06-10status $199,900 Pending 6 DOM
-
2026-06-09days on market $199,900 Active 6 DOM
-
2026-06-09days on market $199,900 Active 5 DOM
-
2026-06-07days on market $199,900 Active 4 DOM
-
2026-06-03remarks 693-char remark
-
2026-06-03$199,900 Active 1 DOM
ⓘ Source: listings_history table (triggers on properties + properties_extension) + one-shot
backfill from property_details.listing_events for pre-trigger history.
Tax reassessment forecast NY · Partial reset (capped growth)
- Current annual tax
- $5,884 · $490/mo
- Projected year-2 tax
- $5,884 · $490/mo
- Expected delta
- $0/yr ($0/mo · 0.0%)
ⓘ Screening estimate from a state-policy table — verify with the county assessor before closing.
Climate risk First Street
- Flood 1/10 Low FEMA zone X (unshaded) · 0% chance over 30 yrs
- Wildfire 1/10 Low
- Heat 2/10 Low 7 d/yr ≥94°F today · 15 d/yr by 30 yrs out
- Wind 1/10 Low
- Air quality 2/10 Low 1 unhealthy d/yr today · 1 by 30 yrs out
Nearby sold comps map
Loading sold comps map…
Walkable amenities ~0.75 mi
Loading nearby amenities…
Taxation est. · year 1
- Rental income
- $23,871
- − Mortgage interest
- −$11,198
- − Property taxes
- −$5,884
- − Insurance
- −$1,000
- − Repairs & maintenance
- −$1,910
- − Management
- −$1,910
- − Depreciation
- −$5,815
- Taxable loss
- −$3,845
- Est. tax savings @ 24.0%
- +$923
- After-tax cash flow
- $318/yr
For passive investors: Depreciation is non-cash, so a rental often shows a tax loss while cash-flowing — sheltering income. Rental losses are passive: they offset passive income freely, and up to $25,000/yr can offset ordinary (W-2) income if you actively participate and your MAGI is under $100k (phasing out to $0 by $150k); unused losses carry forward. On sale, claimed depreciation is recaptured at up to 25%, and gains may owe capital-gains tax (a 1031 exchange can defer both). Figures are a year-1 estimate at your 24.0% rate — not tax advice; consult a CPA.
Schools (NCES district)
- District
- Rush-Henrietta Central School District
- NCES district ID
- 3625170
- Math proficiency
- 62% ▼ -6.00%
- Reading proficiency
- 57% ▲ 1.00%
- Median HH income
- $58,682
- Composite
- 51.52/100
- National rank
- #1720
- State rank
- #237 of 590 in NY
Livability — Brighton
- Score
- 81/100
- State rank
- #89
- US rank
- #1379
Category grades
Schools grade is shown separately in the Schools card above.
Census & demographics
- County
- Monroe County · 674,131 people
- City population
- 38,703
- Metro
- Rochester, NY
- Population (ZIP)
- 10,168
- Household income
- $88,653
- Rent vs Own
- Severe rent burden
- 265.0
Population outlook (Monroe County) Hauer SSP2
- Today (2025)
- 759,460 people
- By 2030
- 757,154 · -0.3%
- By 2040
- 740,644 · -2.5%
- By 2050
- 714,443 · -5.9%
- By 2075
- 645,883 · -15.0%
- By 2100
- 547,084 · -28.0%
Race, ethnicity, and origin ACS 2023
- Neighborhood character
- Predominantly White (77%)
- Race & ethnicity
- White 77% Asian 9% Black 6% Hispanic / Latino 5% Two or more races 4%
- Hispanic origin (detail)
- Puerto Rican 4%
- Common ancestry
- Romanian 7% Lithuanian 2% Slovak 2%
- Foreign-born
- 11% · China, Canada, Vietnam
- Languages at home
- 90% English-only · Other Indo-European 2% Arabic 2% Chinese 1%
Political lean MEDSL · Monroe
- 2024 margin
- D (+19.1) · D 59.5% · R 40.5%
- 2008→2024 swing
- +1.4pp toward D · 2008: 17.7pp · 2024: 19.1pp
- All cycles
- 2024: D+19.1 2020: D+21.0 2016: D+14.1 2012: D+17.4 2008: D+17.7
Not yet ingested
- Civics
- —
Market trends
- HPI YoY
- ▼ -44.47%
- Current HPI
- 276.5057
- Rent YoY
- ▲ 1.28%
- Metro
- Rochester, NY
- State GDP YoY
- ▲ 2.60%
- F500 in state
- 92
Industry mix (Fortune 500 HQ in NY)
| Industry | F500 HQs | Revenue |
|---|---|---|
| Financial Services | 10 | $950B |
|
||
| Consumer Goods | 9 | $162B |
|
||
| Insurance | 4 | $225B |
|
||
| Telecommunications | 2 | $144B |
|
||
| Pharmaceuticals | 2 | $112B |
|
||
| Media / Entertainment | 2 | $69B |
|
||
Price history
+142.3% since first listed5 events — show timeline
- 2026-06-03 Listed $199,900 UNYREIS
- 2015-07-20 Sold (Public Records) $82,500 Public Records
- 2015-07-17 Sold (MLS) $82,500 UNYREIS
- 2015-06-15 Contingent — UNYREIS
- 2015-05-13 Listed $82,500 UNYREIS
Property tax history
+6.1%/yrLatest (2025): $5,884 · +17.0% YoY. Source: county tax records.
Cash-flow waterfall
monthlySold comps — $/sqft
last 12 mo · ≤1 miLoading sold comps…