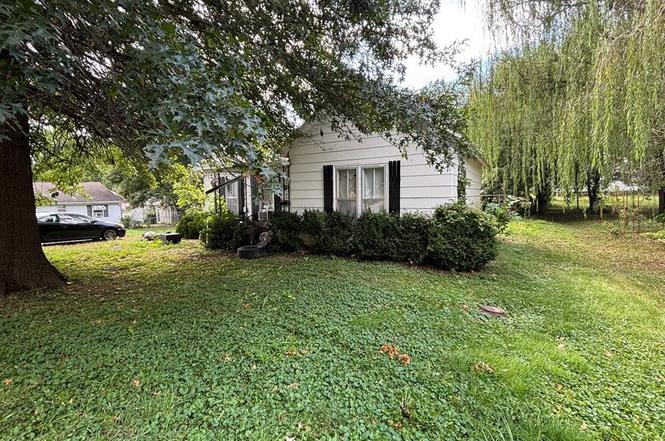
1213 N Elson St · Kirksville, MO
Flood risk 1/10 · Minimal
- FEMA flood zone
- X
- Chance of flooding over 30 yrs
- 0.0%
- Est. flood insurance / yr
- $473 – $860
Fire risk 2/10 · Minimal
- Est. fire insurance / yr
- $1,054 – $1,958
Heat risk 3/10 · Minor
- Hot days now (above 104°F)
- 7 days/yr
- Hot days in 30 yrs
- 15 days/yr
Wind risk 2/10 · Minimal
- Chance of severe wind over 30 yrs
- —
Air-quality risk 2/10 · Minimal
- Unhealthy air days now
- 1 days/yr
- Unhealthy air days in 30 yrs
- 1 days/yr
Risk factors via First Street. Map © Google.
Why this score? — see what drove the B- grade
The composite is a weighted blend of 9 inputs, each scored 0–100. Each bar is that input's sub-score; the figure is the points it added to the 100-point composite (weight × sub-score).
- Cash flow +30.0/30.0
- 1% rule +10.0/10.0
- DSCR +10.0/10.0
- ARV discount +7.5/15.0
- Livability +3.4/5.0
- Rent growth +3.2/5.0
- Schools +3.1/10.0
- Condition / age +2.5/5.0
- Appreciation +0.0/10.0
$50,500
🖨 Deal sheet 📄 Offer letter ✓ Due diligence
Listing remarks MLS
Remarks-Looking for a charming bungalow in Kirksville, MO? Look no further than 1213 N Elson. This 2 bedroom, 1 bathroom home is situated on a double lot, providing ample outdoor space for all your needs. This home boasts a newer roof and furnace/central air system, ensuring that you'll stay comfortable no matter the weather. Inside, you'll find a fully applianced clean house that's move-in ready. Don't miss your chance to own this delightful property. Only $59,900. MIKE LABETH, CRS LISTING AGENT 660-216-7144 or www. KirksvilleRealEstate.com
Key facts
- 0.25 acre lot
- Listed 132 days
Property features AI
Finance
- Financial info: Annual tax amount reported
Exterior
- Home design: Single-family residence
- Construction: Frame construction
- Exterior features: Lot of about 0.248 acres
Interior
- Bathrooms: 1 full bathroom
- Interior features: Full and partial basement
Neighborhood map
What this means for you Summary
Snapshot
- This is a 2-bed/1.0-bath single-family listed at $50k.
Deal economics
- At list price, monthly cash flow is $502 ($6k/yr) — positive.
- The deal already cash-flows at list — no discount required.
- Meets the 1% rule at list price ($1k rent vs $50k).
- Recommended offer: $44k (12.0% below list) — sets the bar for market timing.
- Cap rate 18.2% vs local median 5.2% in Kirksville — top-decile yield for the area; either an underpriced asset or a hidden risk that comps aren't pricing in. Stress-test before assuming the spread holds.
Location & tenants
- Location reads 67/100 on livability (#211 in MO) — a middle-class / working-renter tenant base. Strengths: cost of living A+, housing A, health & safety B+; Watch: schools C-, crime D, amenities F.
- Kirksville R-III (town): math 31% / reading 45% proficiency, ranked #194 of 324 in MO (top 60%) — families likely to look elsewhere, expect single-tenant / working-renter base with shorter leases.
- Market conditions: Rents rising (+2.8%/yr); 234 active listings in the ZIP; 18 units permitted in Adair County in 2024 (0 in 5+ unit buildings).
Forward outlook
- Local home prices are declining (-3.0%/yr); year-one equity from $349 of loan paydown is wiped out by about $2k of value loss. Plan a longer hold.
- At projected returns (-3.0% appreciation + 2.8% rent growth), your $14k cash investment doubles in ~3 years — after that, you're playing with house money.
Negotiation context
- It's been on market 133 days — a 12% lower offer ($44k) is reasonable based on typical stale-listing flexibility.
- 4 sale attempts since 3y ago; this cycle's ask has dropped $4k (8%) from the opening price — seller is motivated, your offer sets the floor, not the list.
Risks & watch-outs
- Watch-outs: built in 1920 — expect roof / HVAC / electrical / plumbing capex.
Questions for the listing agent
- It's been on market 133 days. Have you received any prior offers? Is the seller open to a 12% concession, seller financing, or rate buy-down credit?
- Built in 1920 — when were the roof, HVAC, electrical panel, plumbing, and water heater last replaced?
- Why hasn't it sold? Are there any deal-killer items the seller is aware of (foundation, flood, title, zoning, code violations)?
- Is there a deadline driving the sale (1031 exchange, divorce, estate, relocation)? That informs how much negotiation room exists.
- Crime grade is D in this area — have there been break-ins, vandalism, or insurance claims at this property in the last 3 years? What carrier currently insures it and at what premium?
- What's the average days-on-market for RENTAL listings here right now (not sales)? A rising rental-DOM trend means longer vacancies and softer asking-rent achievability than the comps imply.
- What's the recent tenant-quality profile in this submarket — average credit score on applications, eviction rate, late-payment / NSF rate, and stable-employment percentage? A property-management company in the area should have these aggregated.
- How much new for-sale + rental construction is in the pipeline within 1–3 miles? Heavy new supply typically softens prices + rents 12–24 months out; constrained supply supports both.
Investment metrics
- 1% rule
- 2.05% ✓
- Cap rate
- 18.23%
- Cash-on-cash
- 42.62%
- DSCR
- 2.90
- GRM
- 4.1
CMA / ARV
No comps found within radius.
Projected returns pro-forma
-3.0% appreciation · 2.82% rent growth · sell at horizon
- IRR
- 39.2%
- Equity multiple
- 2.67×
- Total profit
- $23,610
- Equity at exit
- $7,530
- IRR
- 45.5%
- Equity multiple
- 5.31×
- Total profit
- $60,960
- Equity at exit
- $4,366
Cash invested: $14,140 (down + closing). Projections, not guarantees.
Landlord ↔ Tenant lean methodology
- Overall (STATE)
- 81 Strongly Landlord-Friendly
- State Missouri
- 81 Strongly Landlord-Friendly · R+10
- County
- — inherits STATE
- City
- — inherits STATE
ZIP-level market 63501
- Home prices YoY
- -31.5%
- Rents YoY
- 2.8%
- Active inventory
- 234
- Price-to-rent
- 4.1×
Monthly cashflow live
- Estimated rent
- $1,034 medium interval (Pro) →
- Mortgage (P&I)
- −$265
- Tax from tax record
- −$29 /mo · $347/yr
- Insurance
- −$21
- HOA
- −$0
- Vacancy / Maint / Mgmt
- −$217
- Net cashflow
- $502
Break-even live
UW: 25.0% down · 7.5% · 30yr · 1.5% tax · 5.0% vac · 8.0% maint · 8.0% mgmt
Financing live
Cash to close
- Down payment
- $12,625
- Closing costs
- $1,515
- Reserves months
- —
- Total cash needed
- —
Loan-product check · same deal, 3 products live
Conventional
25% down · 7.5% · 30yr
- Down + closing
- —
- Monthly P&I
- —
- Monthly cashflow
- —
- DSCR
- —
- Eligible?
- —
Personal DTI + credit; lowest rate.
DSCR
20% down · 8.5% · 30yr
- Down + closing
- —
- Monthly P&I
- —
- Monthly cashflow
- —
- DSCR
- —
- Eligible?
- —
No personal income docs; deal must DSCR.
Hard money
10% down · 12.0% · 12mo
- Down + closing
- —
- Monthly P&I
- —
- Monthly cashflow
- —
- DSCR
- —
- Eligible?
- —
Short-term bridge; refi at stabilization.
Listing history 7 events
-
2026-06-19days on market $50,500 Active 133 DOM
-
2026-06-18days on market $50,500 Active 132 DOM
-
2026-06-17days on market $50,500 Active 131 DOM
-
2026-06-17remarks 383-char remark
-
2026-06-16days on market $50,500 Active 130 DOM
-
2026-06-15remarks 134-char remark
-
2026-06-15$50,500 Active 129 DOM
ⓘ Source: listings_history table (triggers on properties + properties_extension) + one-shot
backfill from property_details.listing_events for pre-trigger history.
Tax reassessment forecast MO · Resets to sale price
- Current annual tax
- $347 · $29/mo
- Projected year-2 tax
- $490 · $41/mo
- Expected delta
- +$143/yr (+$12/mo · 41.3%)
ⓘ Screening estimate from a state-policy table — verify with the county assessor before closing.
Climate risk First Street
- Flood 1/10 Low FEMA zone X · 0% chance over 30 yrs
- Wildfire 2/10 Low
- Heat 3/10 Moderate 7 d/yr ≥104°F today · 15 d/yr by 30 yrs out
- Wind 2/10 Low
- Air quality 2/10 Low 1 unhealthy d/yr today · 1 by 30 yrs out
Nearby sold comps map
Loading sold comps map…
Walkable amenities ~0.75 mi
Loading nearby amenities…
Taxation est. · year 1
- Rental income
- $12,410
- − Mortgage interest
- −$2,829
- − Property taxes
- −$347
- − Insurance
- −$252
- − Repairs & maintenance
- −$993
- − Management
- −$993
- − Depreciation
- −$1,469
- Taxable income
- $5,527
- Est. tax owed @ 24.0%
- −$1,326
- After-tax cash flow
- $4,700/yr
For passive investors: Depreciation is non-cash, so a rental often shows a tax loss while cash-flowing — sheltering income. Rental losses are passive: they offset passive income freely, and up to $25,000/yr can offset ordinary (W-2) income if you actively participate and your MAGI is under $100k (phasing out to $0 by $150k); unused losses carry forward. On sale, claimed depreciation is recaptured at up to 25%, and gains may owe capital-gains tax (a 1031 exchange can defer both). Figures are a year-1 estimate at your 24.0% rate — not tax advice; consult a CPA.
Schools (NCES district)
- District
- Kirksville R-III
- NCES district ID
- 2916740
- Math proficiency
- 31% ▼ -9.00%
- Reading proficiency
- 45% ▼ -2.00%
- Median HH income
- $33,570
- Composite
- 31.21/100
- National rank
- #6037
- State rank
- #194 of 324 in MO
Livability — Kirksville
- Score
- 67/100
- State rank
- #211
- US rank
- #10590
Category grades
Schools grade is shown separately in the Schools card above.
Census & demographics
- Census place
- Kirksville, MO
- County
- Adair County · 21,218 people
- City population
- 21,218
- Metro
- Kirksville, MO
- Population (ZIP)
- 21,218
- Household income
- $60,729
- Rent vs Own
- Severe rent burden
- 702.0
Population outlook (Adair County) Hauer SSP2
- Today (2025)
- 25,570 people
- By 2030
- 25,728 · +0.6%
- By 2040
- 25,556 · -0.1%
- By 2050
- 25,811 · +0.9%
- By 2075
- 29,164 · +14.1%
- By 2100
- 31,846 · +24.5%
Race, ethnicity, and origin ACS 2023
- Neighborhood character
- Predominantly White (86%)
- Race & ethnicity
- White 86% Black 5% Two or more races 4% Hispanic / Latino 3% Asian 2%
- Common ancestry
- Italian 2% Slovak 2% Lithuanian 2%
- Foreign-born
- 5% · Canada, Jamaica, South Korea
- Languages at home
- 94% English-only · French/Haitian/Cajun 3% Spanish 2% Other Indo-European 1%
Political lean MEDSL · Adair
- 2024 margin
- Solid R (+33.6) · D 32.6% · R 66.2% · Other 1.3%
- 2008→2024 swing
- -32.3pp toward R · 2008: -1.3pp · 2024: -33.6pp
- All cycles
- 2024: R+33.6 2020: R+26.2 2016: R+24.9 2012: R+14.1 2008: R+1.3
Not yet ingested
- Civics
- —
Market trends
- HPI YoY
- ▼ -77.58%
- Current HPI
- 168.7332
- Rent YoY
- ▲ 2.82%
- Metro
- Kirksville, MO
- State GDP YoY
- ▲ 1.84%
- F500 in state
- 20
Industry mix (Fortune 500 HQ in MO)
| Industry | F500 HQs | Revenue |
|---|---|---|
| Healthcare | 1 | $163B |
|
||
| Insurance | 1 | $21B |
|
||
| Industrial Technology | 1 | $17B |
|
||
| Retail | 1 | $16B |
|
||
| Industrial Distribution | 1 | $10B |
|
||
| Utilities | 1 | $9B |
|
||
Price history
-15.7% since first listed8 events — show timeline
- 2026-06-14 Relisted — NECAR
- 2026-06-14 Price Changed $50,500 NECAR
- 2025-09-18 Listed $55,000 NECAR
- 2025-06-20 Listed $55,000 MARIS as Distributed by MLS Grid
- 2023-05-30 Sold (Public Records) — Public Records
- 2023-05-30 Sold (MLS) — NECAR
- 2023-04-28 Pending — NECAR
- 2023-04-17 Listed $59,900 NECAR
Property tax history
+4.1%/yrLatest (2024): $347 · +0.4% YoY. Source: county tax records.
Cash-flow waterfall
monthlySold comps — $/sqft
last 12 mo · ≤1 miLoading sold comps…