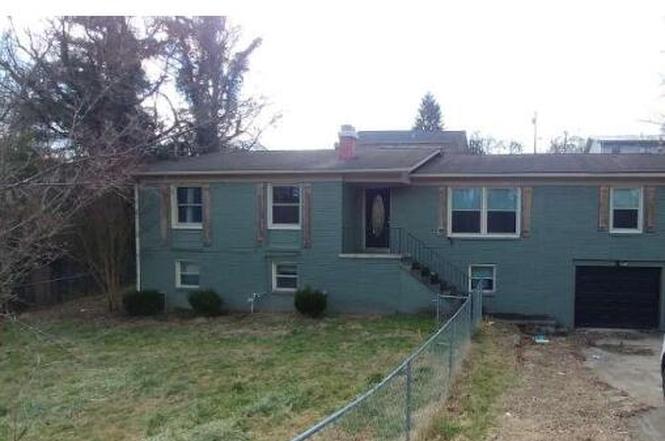
1398 Mckinley Ave · Corbin, KY
Flood risk 5/10 · Moderate
- FEMA flood zone
- X (unshaded)
- Chance of flooding over 30 yrs
- 0.27%
- Est. flood insurance / yr
- $473 – $860
Fire risk 2/10 · Minimal
- Est. fire insurance / yr
- $839 – $1,559
Heat risk 4/10 · Minor
- Hot days now (above 99°F)
- 7 days/yr
- Hot days in 30 yrs
- 19 days/yr
Wind risk 2/10 · Minimal
- Chance of severe wind over 30 yrs
- 4.0%
Air-quality risk 2/10 · Minimal
- Unhealthy air days now
- 0 days/yr
- Unhealthy air days in 30 yrs
- 1 days/yr
Risk factors via First Street. Map © Google.
Why this score? — see what drove the B grade
The composite is a weighted blend of 9 inputs, each scored 0–100. Each bar is that input's sub-score; the figure is the points it added to the 100-point composite (weight × sub-score).
- Cash flow +26.0/30.0
- ARV discount +15.0/15.0
- DSCR +8.7/10.0
- Appreciation +5.9/10.0
- 1% rule +5.7/10.0
- Schools +3.8/10.0
- Livability +3.5/5.0
- Rent growth +2.5/5.0
- Condition / age +2.5/5.0
$129,900
🖨 Deal sheet 📄 Offer letter ✓ Due diligence
Listing remarks MLS
Brick home offers 4 bedrooms, 2 baths, living room, formal dining, back porch, appliances included, and Corbin City Schools.
Key facts
- 0.23 acre lot
- Garage
- Listed 72 days
Property features AI
Exterior
- Parking: Attached garage; Driveway; Has garage
- Utilities: Public sewer
- Home design: House
- Construction: Brick veneer exterior; Block foundation; 1,590 building area total
- Exterior features: Public water; Not on waterfront; No significant view
Interior
- Bedrooms: 3 total rooms
- Flooring: Carpet; Concrete; Vinyl
- Bathrooms: 2 full bathrooms
- Interior features: Unfinished basement; No fireplace
Neighborhood map
What this means for you Summary
Snapshot
- This is a 4-bed/2.5-bath single-family listed at $130k.
Deal economics
- At list price, monthly cash flow is $323 ($4k/yr) — positive.
- The deal already cash-flows at list — no discount required.
- Meets the 1% rule at list price ($1k rent vs $130k).
- Recommended offer: $122k (6.0% below list) — sets the bar for market timing.
- Cap rate 9.3% vs local median 3.3% in Corbin — top-decile yield for the area; either an underpriced asset or a hidden risk that comps aren't pricing in. Stress-test before assuming the spread holds.
Location & tenants
- Location reads 69/100 on livability (#179 in KY) — a middle-class / working-renter tenant base. Strengths: cost of living A+, housing A+, crime A-; Watch: amenities F, commute F, employment F.
- Corbin Independent (town): math 42% / reading 50% proficiency, ranked #20 of 165 in KY (top 12%) — families likely to look elsewhere, expect single-tenant / working-renter base with shorter leases.
- Zoned schools: Corbin Primary (math 42% / reading 32%, grade F, #255 of 676 statewide, top 42%, 769 students, 60% FRL); Corbin Middle School (math 46% / reading 56%, grade C, #20 of 217 statewide, top 10%, 646 students, 58% FRL); Corbin High School (math 22% / reading 42%, grade F, #97 of 254 statewide, top 46%, 829 students, 53% FRL).
- Market conditions: 332 active listings in the ZIP; 65 units permitted in Whitley County in 2024 (0 in 5+ unit buildings).
Forward outlook
- In year one you build about $3k of equity ($898 loan paydown + $2k appreciation (1.8% local appreciation)).
- Whitley County population projected to shrink 8% by 2050 — rents likely to lag national; underwrite the cash flow, not the appreciation.
- At projected returns (1.8% appreciation + 3.0% rent growth), your $36k cash investment doubles in ~5 years — after that, you're playing with house money.
- By year 10, paydown + projected appreciation supports a ~$32k cash-out refi (75% LTV) — recoverable capital for the next deal without selling this one.
Negotiation context
- It's been on market 72 days — a 6% lower offer ($122k) is reasonable based on typical stale-listing flexibility.
- 4 sale attempts since 16y ago; this cycle's ask has dropped $15k (10%) from the opening price — seller is motivated, your offer sets the floor, not the list.
Risks & watch-outs
- Climate carrying-cost: moderate flood risk — expect insurance premiums to compound above CPI over the hold.
Questions for the listing agent
- It's been on market 72 days. Have you received any prior offers? Is the seller open to a 6% concession, seller financing, or rate buy-down credit?
- Why hasn't it sold? Are there any deal-killer items the seller is aware of (foundation, flood, title, zoning, code violations)?
- Is there a deadline driving the sale (1031 exchange, divorce, estate, relocation)? That informs how much negotiation room exists.
- Schools are B-rated — typically a magnet for longer-tenancy family renters. What's the average tenant stay here, and is there a school-zone premium baked into asking?
- What's the average days-on-market for RENTAL listings here right now (not sales)? A rising rental-DOM trend means longer vacancies and softer asking-rent achievability than the comps imply.
- What's the recent tenant-quality profile in this submarket — average credit score on applications, eviction rate, late-payment / NSF rate, and stable-employment percentage? A property-management company in the area should have these aggregated.
- How much new for-sale + rental construction is in the pipeline within 1–3 miles? Heavy new supply typically softens prices + rents 12–24 months out; constrained supply supports both.
Investment metrics
- 1% rule
- 1.07% ✓
- Cap rate
- 9.27%
- Cash-on-cash
- 10.64%
- DSCR
- 1.47
- GRM
- 7.8
CMA / ARV
- ARV (on-the-fly)
- $213,840
- Comps found
- 7
Show comp detail 7 sales within ~0.75 mi
| Address | Dist | Beds/Ba | Sqft | Sold | Price | $/sf | Match |
|---|---|---|---|---|---|---|---|
| 1307 Roosevelt St | 0.07mi | 3/2.5 (-1) | 2,100 (-3%) | 16mo | $265,000 | $126 | 74 |
| 1313 Roosevelt St | 0.07mi | 3/2.5 (-1) | 1,916 (-11%) | 2mo | $254,000 | $133 | 71 |
| 805 Holly Ln | 0.22mi | 3/2.5 (-1) | 2,431 (+12%) | 14mo | $235,000 | $97 | 52 |
| 1507 Sherwood Dr | 0.50mi | 3/2.5 (-1) | 2,080 (-4%) | 23mo | $206,000 | $99 | 47 |
| 911 W 8th St | 0.50mi | 3/2.0 (-1) | 2,353 (+9%) | 14mo | $205,000 | $87 | 44 |
| 600 Lee St | 0.51mi | 4/1.0 | 1,908 (-12%) | 18mo | $159,900 | $84 | 36 |
| 321 West 8th St | 0.40mi | 4/2.0 | 1,852 (-14%) | 24mo | $309,900 | $167 | 36 |
Match score weights: distance 35% · size 25% · config 20% · recency 20%. Top-matched comps best support the ARV.
Projected returns pro-forma
1.82% appreciation · 3.0% rent growth · sell at horizon
- IRR
- 14.5%
- Equity multiple
- 1.78×
- Total profit
- $28,244
- Equity at exit
- $50,007
- IRR
- 17.2%
- Equity multiple
- 3.25×
- Total profit
- $82,013
- Equity at exit
- $71,078
Cash invested: $36,372 (down + closing). Projections, not guarantees.
Landlord ↔ Tenant lean methodology
- Overall (STATE)
- 83 Strongly Landlord-Friendly
- State Kentucky
- 83 Strongly Landlord-Friendly · R+16
- County
- — inherits STATE
- City
- — inherits STATE
ZIP-level market 40701
- Home prices YoY
- 0.6%
- Active inventory
- 332
- Price-to-rent
- 7.8×
Monthly cashflow live
- Estimated rent
- $1,392 medium interval (Pro) →
- Mortgage (P&I)
- −$681
- Tax from tax record
- −$42 /mo · $503/yr
- Insurance
- −$54
- HOA
- −$0
- Vacancy / Maint / Mgmt
- −$292
- Net cashflow
- $323
Break-even live
UW: 25.0% down · 7.5% · 30yr · 1.5% tax · 5.0% vac · 8.0% maint · 8.0% mgmt
Financing live
Cash to close
- Down payment
- $32,475
- Closing costs
- $3,897
- Reserves months
- —
- Total cash needed
- —
Loan-product check · same deal, 3 products live
Conventional
25% down · 7.5% · 30yr
- Down + closing
- —
- Monthly P&I
- —
- Monthly cashflow
- —
- DSCR
- —
- Eligible?
- —
Personal DTI + credit; lowest rate.
DSCR
20% down · 8.5% · 30yr
- Down + closing
- —
- Monthly P&I
- —
- Monthly cashflow
- —
- DSCR
- —
- Eligible?
- —
No personal income docs; deal must DSCR.
Hard money
10% down · 12.0% · 12mo
- Down + closing
- —
- Monthly P&I
- —
- Monthly cashflow
- —
- DSCR
- —
- Eligible?
- —
Short-term bridge; refi at stabilization.
Listing history 17 events
-
2026-05-13status Pending
-
2026-03-17price $129,900
-
2026-02-27$144,900 Active
-
2022-08-01historical
-
2022-07-19price $190,000
-
2022-07-12price $199,500
-
2022-07-02price $210,000
-
2022-05-24price $220,000
-
2022-05-02$231,000 Active
-
2021-09-13soldstatus $153,000 Closed 124-char remark
Show marketing remark (124 chars)
Brick home offers 4 bedrooms, 2 baths, living room, formal dining, back porch, appliances included, and Corbin City Schools.
-
2021-09-13soldstatus $153,000
Show marketing remark (124 chars)
Brick home offers 4 bedrooms, 2 baths, living room, formal dining, back porch, appliances included, and Corbin City Schools.
-
2021-08-11status Pending 124-char remark
Show marketing remark (124 chars)
Brick home offers 4 bedrooms, 2 baths, living room, formal dining, back porch, appliances included, and Corbin City Schools.
-
2021-07-26price $179,900 124-char remark
Show marketing remark (124 chars)
Brick home offers 4 bedrooms, 2 baths, living room, formal dining, back porch, appliances included, and Corbin City Schools.
-
2021-07-13$189,900 Active 124-char remark
Show marketing remark (124 chars)
Brick home offers 4 bedrooms, 2 baths, living room, formal dining, back porch, appliances included, and Corbin City Schools.
-
2011-11-22soldstatus $87,500
-
2011-10-16historical
-
2010-12-08$104,900
ⓘ Source: listings_history table (triggers on properties + properties_extension) + one-shot
backfill from property_details.listing_events for pre-trigger history.
Tax reassessment forecast KY · Resets to sale price
- Current annual tax
- $503 · $42/mo
- Projected year-2 tax
- $1,117 · $93/mo
- Expected delta
- +$614/yr (+$51/mo · 121.9%)
ⓘ Screening estimate from a state-policy table — verify with the county assessor before closing.
Climate risk First Street
- Flood 5/10 Major FEMA zone X (unshaded) · 27% chance over 30 yrs
- Wildfire 2/10 Low
- Heat 4/10 Moderate 7 d/yr ≥99°F today · 19 d/yr by 30 yrs out
- Wind 2/10 Low 4% chance of damaging wind over 30 yrs
- Air quality 2/10 Low 0 unhealthy d/yr today · 1 by 30 yrs out
Nearby sold comps map
Loading sold comps map…
Walkable amenities ~0.75 mi
Loading nearby amenities…
Taxation est. · year 1
- Rental income
- $16,707
- − Mortgage interest
- −$7,276
- − Property taxes
- −$503
- − Insurance
- −$650
- − Repairs & maintenance
- −$1,337
- − Management
- −$1,337
- − Depreciation
- −$3,779
- Taxable income
- $1,826
- Est. tax owed @ 24.0%
- −$438
- After-tax cash flow
- $3,433/yr
For passive investors: Depreciation is non-cash, so a rental often shows a tax loss while cash-flowing — sheltering income. Rental losses are passive: they offset passive income freely, and up to $25,000/yr can offset ordinary (W-2) income if you actively participate and your MAGI is under $100k (phasing out to $0 by $150k); unused losses carry forward. On sale, claimed depreciation is recaptured at up to 25%, and gains may owe capital-gains tax (a 1031 exchange can defer both). Figures are a year-1 estimate at your 24.0% rate — not tax advice; consult a CPA.
Schools (NCES district)
- District
- Corbin Independent
- NCES district ID
- 2101320
- Math proficiency
- 42% ▼ -19.00%
- Reading proficiency
- 50% ▼ -13.00%
- Median HH income
- $36,928
- Composite
- 38.19/100
- National rank
- #4259
- State rank
- #20 of 165 in KY
Livability — Corbin
- Score
- 69/100
- State rank
- #179
- US rank
- #8891
Category grades
Schools grade is shown separately in the Schools card above.
Census & demographics
- Census place
- Corbin, KY
- Population (ZIP)
- 29,767
Population outlook (Whitley County) Hauer SSP2
- Today (2025)
- 35,362 people
- By 2030
- 34,807 · -1.6%
- By 2040
- 33,525 · -5.2%
- By 2050
- 32,550 · -8.0%
- By 2075
- 29,555 · -16.4%
- By 2100
- 24,308 · -31.3%
Race, ethnicity, and origin ACS 2023
- Neighborhood character
- Predominantly White (95%)
- Race & ethnicity
- White 95% Two or more races 3% Hispanic / Latino 1%
- Common ancestry
- Serbian 2% Slovak 2% Italian 1%
- Foreign-born
- 1% · Canada
- Languages at home
- 99% English-only · Spanish 1%
Political lean MEDSL · Whitley
- 2024 margin
- Solid R (+69.3) · D 14.8% · R 84.2% · Other 1.0%
- 2008→2024 swing
- -21.7pp toward R · 2008: -47.7pp · 2024: -69.3pp
- All cycles
- 2024: R+69.3 2020: R+65.2 2016: R+67.2 2012: R+57.8 2008: R+47.7
Not yet ingested
- Civics
- —
Market trends
- HPI YoY
- ▲ 1.82%
- Current HPI
- 294.7961
- Rent YoY
- —
- Metro
- —
- State GDP YoY
- ▲ 1.81%
- F500 in state
- 4
Industry mix (Fortune 500 HQ in KY)
| Industry | F500 HQs | Revenue |
|---|---|---|
| Healthcare | 1 | $118B |
|
||
| Food / Beverage | 1 | $7B |
|
||
Price history
+23.8% since first listed17 events — show timeline
- 2026-05-13 Pending — ImagineMLS
- 2026-03-17 Price Changed $129,900 ImagineMLS
- 2026-02-27 Listed $144,900 ImagineMLS
- 2022-08-01 Listing Removed — ImagineMLS
- 2022-07-19 Price Changed $190,000 ImagineMLS
- 2022-07-12 Price Changed $199,500 ImagineMLS
- 2022-07-02 Price Changed $210,000 ImagineMLS
- 2022-05-24 Price Changed $220,000 ImagineMLS
- 2022-05-02 Listed $231,000 ImagineMLS
- 2021-09-13 Sold (Public Records) $153,000 Public Records
- 2021-09-13 Sold (MLS) $153,000 ImagineMLS
- 2021-08-11 Pending — ImagineMLS
- 2021-07-26 Price Changed $179,900 ImagineMLS
- 2021-07-13 Listed $189,900 ImagineMLS
- 2011-11-22 Sold (MLS) $87,500 ImagineMLS
- 2011-10-16 Listing Removed — ImagineMLS
- 2010-12-08 Listed $104,900 ImagineMLS
Property tax history
+2.7%/yrLatest (2024): $503 · -3.8% YoY. Source: county tax records.
Cash-flow waterfall
monthlySold comps — $/sqft
last 12 mo · ≤1 miLoading sold comps…