4315 N Flowing Wells Rd · Flowing Wells, AZ
Flood risk 1/10 · Minimal
- FEMA flood zone
- X (unshaded)
- Chance of flooding over 30 yrs
- 0.0%
- Est. flood insurance / yr
- $507 – $1,088
Fire risk 5/10 · Moderate
- Est. fire insurance / yr
- $610 – $1,132
Heat risk 8/10 · Major
- Hot days now (above 107°F)
- 7 days/yr
- Hot days in 30 yrs
- 18 days/yr
Wind risk 1/10 · Minimal
- Chance of severe wind over 30 yrs
- —
Air-quality risk 1/10 · Minimal
- Unhealthy air days now
- 0 days/yr
- Unhealthy air days in 30 yrs
- 0 days/yr
Risk factors via First Street. Map © Google.
Why this score? — see what drove the D grade
The composite is a weighted blend of 9 inputs, each scored 0–100. Each bar is that input's sub-score; the figure is the points it added to the 100-point composite (weight × sub-score).
- Cash flow +15.0/30.0
- ARV discount +7.5/15.0
- 1% rule +5.0/10.0
- DSCR +5.0/10.0
- Livability +3.7/5.0
- Rent growth +2.6/5.0
- Condition / age +2.5/5.0
- Schools +2.2/10.0
- Appreciation +0.0/10.0
$8,000
🖨 Deal sheet 📄 Offer letter ✓ Due diligence
Listing remarks MLS
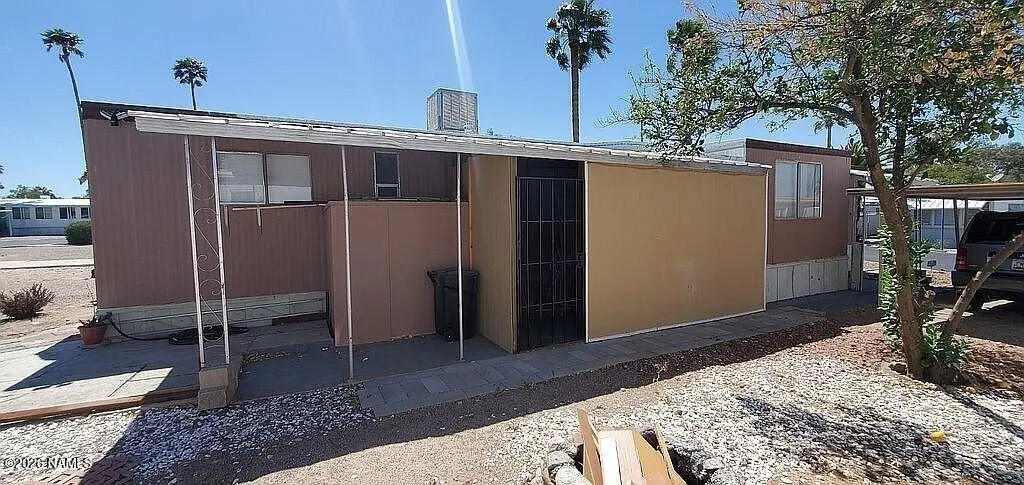
Charming Split-Plan Home in a Quiet, Amenity-Rich Community This cozy and comfortable split-plan home offers a thoughtfully designed layout with a separate dining area and plenty of functional space. An enclosed porch currently serves as a workshop, perfect for hobbies or extra storage. The home features central ducting for the evaporative cooler. The evaporative cooler works great and just needs its routine spring service. Their is a furnace, however it is in need of repair or replacement. Residents have access to an impressive clubhouse with a full kitchen, media area, showers, and pool table. Outdoor amenities include shuffleboard courts, putting greens, BBQ areas, and a heated pool available year-round, complete with a covered patio and fire pit. A wonderful blend of comfort, convenience, and community living. Sold as is.
Key facts
- Covered patio
- Enclosed porch
- Impressive clubhouse
Tags
Neighborhood map
What this means for you Summary
Snapshot
- This is a 2-bed/2.0-bath land listed at $8k.
Deal economics
- At list price, monthly cash flow is $1k ($16k/yr) — positive.
- The deal already cash-flows at list — no discount required.
- Meets the 1% rule at list price ($2k rent vs $8k).
- Recommended offer: $7k (12.0% below list) — sets the bar for market timing.
- Cap rate 211.8% vs local median 6.1% in Flowing Wells — top-decile yield for the area; either an underpriced asset or a hidden risk that comps aren't pricing in. Stress-test before assuming the spread holds.
Location & tenants
- Location reads 73/100 on livability (#21 in AZ) — a middle-class / working-renter tenant base. Strengths: commute A+, cost of living A+, health & safety A+; Watch: schools D+, crime F, amenities F.
- Flowing Wells Unified District (4405) (suburban): math 23% / reading 30% proficiency, ranked #143 of 249 in AZ (top 57%) — low school quality limits family demand, transient renter base, plan for 1-2y turnover; 64% free/reduced lunch — lower-income household profile, screen leases tightly.
- Market conditions: Rents flat; 177 active listings in the ZIP; 4 comparable units currently listed for rent nearby; rentals leasing fast (median 2d on market — plan ~1-2 weeks tenant-placement turnaround); lower-income renter base — watch delinquency; 5,268 units permitted in Pima County in 2024 (996 in 5+ unit buildings).
- At $1,804/mo this rent would consume 58% of the median local household income ($37k/yr) (locally 4240% of renters already pay >50% of income on rent) — very limited rent-growth headroom before tenants either downsize or default.
Forward outlook
- Local home prices are declining (-3.0%/yr); year-one equity from $55 of loan paydown is wiped out by about $240 of value loss. Plan a longer hold.
- Pima County population projected at +8% by 2050 — modest demand growth; plan on rents tracking national, not racing it.
- At projected returns (-3.0% appreciation + 0.3% rent growth), your $2k cash investment doubles in ~1 year — after that, you're playing with house money.
Negotiation context
- It's been on market 129 days — a 12% lower offer ($7k) is reasonable based on typical stale-listing flexibility.
Risks & watch-outs
- Climate carrying-cost: moderate wildfire risk; extreme-heat days projected 7→18/yr by 2055 (HVAC capex compounding) — expect insurance premiums to compound above CPI over the hold.
Questions for the listing agent
- It's been on market 129 days. Have you received any prior offers? Is the seller open to a 12% concession, seller financing, or rate buy-down credit?
- Built in 1972 — when were the roof, HVAC, electrical panel, plumbing, and water heater last replaced?
- Why hasn't it sold? Are there any deal-killer items the seller is aware of (foundation, flood, title, zoning, code violations)?
- Is there a deadline driving the sale (1031 exchange, divorce, estate, relocation)? That informs how much negotiation room exists.
- Schools are D-rated, which usually means shorter tenancies and higher turnover. Who's the typical renter profile here, and what's been the actual vacancy rate?
- Crime grade is F in this area — have there been break-ins, vandalism, or insurance claims at this property in the last 3 years? What carrier currently insures it and at what premium?
- The area grade is low — what's the realistic commute time and amenity access for the typical tenant pool here? Any planned neighborhood developments (good or bad) we should know about?
- What's the average days-on-market for RENTAL listings here right now (not sales)? A rising rental-DOM trend means longer vacancies and softer asking-rent achievability than the comps imply.
- What's the recent tenant-quality profile in this submarket — average credit score on applications, eviction rate, late-payment / NSF rate, and stable-employment percentage? A property-management company in the area should have these aggregated.
- How much new for-sale + rental construction is in the pipeline within 1–3 miles? Heavy new supply typically softens prices + rents 12–24 months out; constrained supply supports both.
Investment metrics
- 1% rule
- 22.55% ✓
- Cap rate
- 211.81%
- Cash-on-cash
- 733.99%
- DSCR
- 33.66
- GRM
- 0.4
CMA / ARV
- ARV (median comp)
- $140,000
- List price
- $8,000
- Delta
- -94.29%
- Verdict
- UNDERPRICED
- Comps
- 19 within 1.0 mi
Projected returns pro-forma
-3.0% appreciation · 0.3% rent growth · sell at horizon
- IRR
- —
- Equity multiple
- 37.26×
- Total profit
- $81,221
- Equity at exit
- $1,193
- IRR
- —
- Equity multiple
- 74.50×
- Total profit
- $164,646
- Equity at exit
- $692
Cash invested: $2,240 (down + closing). Projections, not guarantees.
Landlord ↔ Tenant lean methodology
- Overall (STATE)
- 87 Strongly Landlord-Friendly
- State Arizona
- 87 Strongly Landlord-Friendly · R+3
- County
- — inherits STATE
- City
- — inherits STATE
ZIP-level market 85705
- Rents YoY
- 0.3%
- Active inventory
- 177
- Price-to-rent
- 0.4×
Monthly cashflow live
- Estimated rent
- $1,804 medium interval (Pro) →
- Mortgage (P&I)
- −$42
- Tax est. 1.5%
- −$10 /mo · $120/yr
- Insurance
- −$3
- HOA
- −$0
- Vacancy / Maint / Mgmt
- −$379
- Net cashflow
- $1,370
Break-even live
UW: 25.0% down · 7.5% · 30yr · 1.5% tax · 5.0% vac · 8.0% maint · 8.0% mgmt
Financing live
Cash to close
- Down payment
- $2,000
- Closing costs
- $240
- Reserves months
- —
- Total cash needed
- —
Loan-product check · same deal, 3 products live
Conventional
25% down · 7.5% · 30yr
- Down + closing
- —
- Monthly P&I
- —
- Monthly cashflow
- —
- DSCR
- —
- Eligible?
- —
Personal DTI + credit; lowest rate.
DSCR
20% down · 8.5% · 30yr
- Down + closing
- —
- Monthly P&I
- —
- Monthly cashflow
- —
- DSCR
- —
- Eligible?
- —
No personal income docs; deal must DSCR.
Hard money
10% down · 12.0% · 12mo
- Down + closing
- —
- Monthly P&I
- —
- Monthly cashflow
- —
- DSCR
- —
- Eligible?
- —
Short-term bridge; refi at stabilization.
Rent comps 4 comps
| Address | Beds | Baths | Sqft | Rent | $/sqft | DOM | Units | Dist |
|---|---|---|---|---|---|---|---|---|
| 1051 W Sea Lion Dr Tucson, AZ | 3.0 | 2.5 | 2010 | $2,495 | $1.24 | 1d | 1 | 1.05mi |
| 5132 Prairie Clover Trl Tucson, AZ | 3.0–4.0 | 2.0–2.5 | 1604 | $1,897 | $1.18 | 1d | 13 | 1.10mi |
| 4170 N Thurston Ln Tucson, AZ | 3.0 | 3.0 | 1700 | $1,999 | $1.18 | 3d | 1 | 1.46mi |
| 4162 N Thurston Ln #100 Tucson, AZ | 3.0 | 3.0 | 1700 | $1,895 | $1.11 | 2d | 1 | 1.46mi |
Listing history 18 events
-
2026-06-18days on market $8,000 Active 129 DOM
-
2026-06-17days on market $8,000 Active 128 DOM
-
2026-06-16days on market $8,000 Active 127 DOM
-
2026-06-15days on market $8,000 Active 126 DOM
-
2026-06-13days on market $8,000 Active 124 DOM
-
2026-06-10days on market $8,000 Active 121 DOM
-
2026-06-09days on market $8,000 Active 120 DOM
-
2026-06-08days on market $8,000 Active 119 DOM
-
2026-06-07days on market $8,000 Active 118 DOM
-
2026-06-05days on market $8,000 Active 115 DOM
-
2026-06-03days on market $8,000 Active 114 DOM
-
2026-06-02days on market $8,000 Active 113 DOM
-
2026-06-01days on market $8,000 Active 112 DOM
-
2026-05-31days on market $8,000 Active 111 DOM
-
2026-02-06$8,000 Active 849-char remark
Show marketing remark (849 chars)
Charming Split-Plan Home in a Quiet, Amenity-Rich Community This cozy and comfortable split-plan home offers a thoughtfully designed layout with a separate dining area and plenty of functional space. An enclosed porch currently serves as a workshop, perfect for hobbies or extra storage. The home features central ducting for the evaporative cooler. The evaporative cooler works great and just needs its routine spring service. Their is a furnace, however it is in need of repair or replacement. Residents have access to an impressive clubhouse with a full kitchen, media area, showers, and pool table. Outdoor amenities include shuffleboard courts, putting greens, BBQ areas, and a heated pool available year-round, complete with a covered patio and fire pit. A wonderful blend of comfort, convenience, and community living. Sold as is.
-
2020-10-21soldstatus $5,275,000
-
1991-12-31soldstatus $278,437
-
1990-02-01soldstatus $1,275,000
ⓘ Source: listings_history table (triggers on properties + properties_extension) + one-shot
backfill from property_details.listing_events for pre-trigger history.
Climate risk First Street
- Flood 1/10 Low FEMA zone X (unshaded) · 0% chance over 30 yrs
- Wildfire 5/10 Major
- Heat 8/10 Severe 7 d/yr ≥107°F today · 18 d/yr by 30 yrs out
- Wind 1/10 Low
- Air quality 1/10 Low 0 unhealthy d/yr today · 0 by 30 yrs out
Nearby sold comps map
Loading sold comps map…
Walkable amenities ~0.75 mi
Loading nearby amenities…
Taxation est. · year 1
- Rental income
- $21,652
- − Mortgage interest
- −$448
- − Property taxes
- −$120
- − Insurance
- −$40
- − Repairs & maintenance
- −$1,732
- − Management
- −$1,732
- − Depreciation
- −$233
- Taxable income
- $17,346
- Est. tax owed @ 24.0%
- −$4,163
- After-tax cash flow
- $12,278/yr
For passive investors: Depreciation is non-cash, so a rental often shows a tax loss while cash-flowing — sheltering income. Rental losses are passive: they offset passive income freely, and up to $25,000/yr can offset ordinary (W-2) income if you actively participate and your MAGI is under $100k (phasing out to $0 by $150k); unused losses carry forward. On sale, claimed depreciation is recaptured at up to 25%, and gains may owe capital-gains tax (a 1031 exchange can defer both). Figures are a year-1 estimate at your 24.0% rate — not tax advice; consult a CPA.
Schools (NCES district)
- District
- Flowing Wells Unified District (4405)
- NCES district ID
- 0403010
- Math proficiency
- 23% ▼ -19.00%
- Reading proficiency
- 30% ▼ -14.00%
- Median HH income
- $33,361
- Composite
- 21.69/100
- National rank
- #8271
- State rank
- #143 of 249 in AZ
Livability — Flowing Wells
- Score
- 73/100
- State rank
- #21
- US rank
- #5288
Category grades
Schools grade is shown separately in the Schools card above.
Census & demographics
- Census place
- Flowing Wells, AZ
- County
- Pima County · 1,012,107 people
- Metro
- Tucson, AZ
- Population (ZIP)
- 54,700
- Household income
- $37,194
- Rent vs Own
- Severe rent burden
- 4240.0
Population outlook (Pima County) Hauer SSP2
- Today (2025)
- 1,066,056 people
- By 2030
- 1,086,684 · +1.9%
- By 2040
- 1,117,160 · +4.8%
- By 2050
- 1,149,778 · +7.9%
- By 2075
- 1,271,480 · +19.3%
- By 2100
- 1,321,160 · +23.9%
Race, ethnicity, and origin ACS 2023
- Neighborhood character
- Diverse neighborhood (Simpson 0.63)
- Race & ethnicity
- Hispanic / Latino 45% White 41% Two or more races 18% Asian 4% Black 3% Native American 3%
- Hispanic origin (detail)
- Mexican 41%
- Common ancestry
- Portuguese 2% Romanian 2% Lithuanian 2%
- Foreign-born
- 18% · Canada, China, Vietnam
- Languages at home
- 65% English-only · Spanish 30% Chinese 1% Vietnamese 1%
Political lean MEDSL · Pima
- 2024 margin
- D (+15.2) · D 57.0% · R 41.8% · Other 1.2%
- 2008→2024 swing
- +9.1pp toward D · 2008: 6.1pp · 2024: 15.2pp
- All cycles
- 2024: D+15.2 2020: D+18.7 2016: D+13.5 2012: D+5.8 2008: D+6.1
Not yet ingested
- Civics
- —
Market trends
- HPI YoY
- ▼ -163.31%
- Current HPI
- 283.0647
- Rent YoY
- ▲ 0.30%
- Metro
- Tucson, AZ
- State GDP YoY
- ▲ 4.54%
- F500 in state
- 20
Industry mix (Fortune 500 HQ in AZ)
| Industry | F500 HQs | Revenue |
|---|---|---|
| Technology | 2 | $13B |
|
||
| Mining / Metals | 1 | $23B |
|
||
| Environmental Services | 1 | $16B |
|
||
| Metals / Steel | 1 | $14B |
|
||
| Technology Distribution | 1 | $9B |
|
||
| Homebuilding | 1 | $8B |
|
||
Price history
-99.4% since first listed4 events — show timeline
- 2026-02-06 Listed $8,000 NAZMLS
- 2020-10-21 Sold (Public Records) $5,275,000 Public Records
- 1991-12-31 Sold (Public Records) $278,437 Public Records
- 1990-02-01 Sold (Public Records) $1,275,000 Public Records
Property tax history
+5.1%/yrLatest (2025): $31,746 · +14.6% YoY. Source: county tax records.
Cash-flow waterfall
monthlySold comps — $/sqft
last 12 mo · ≤1 miLoading sold comps…