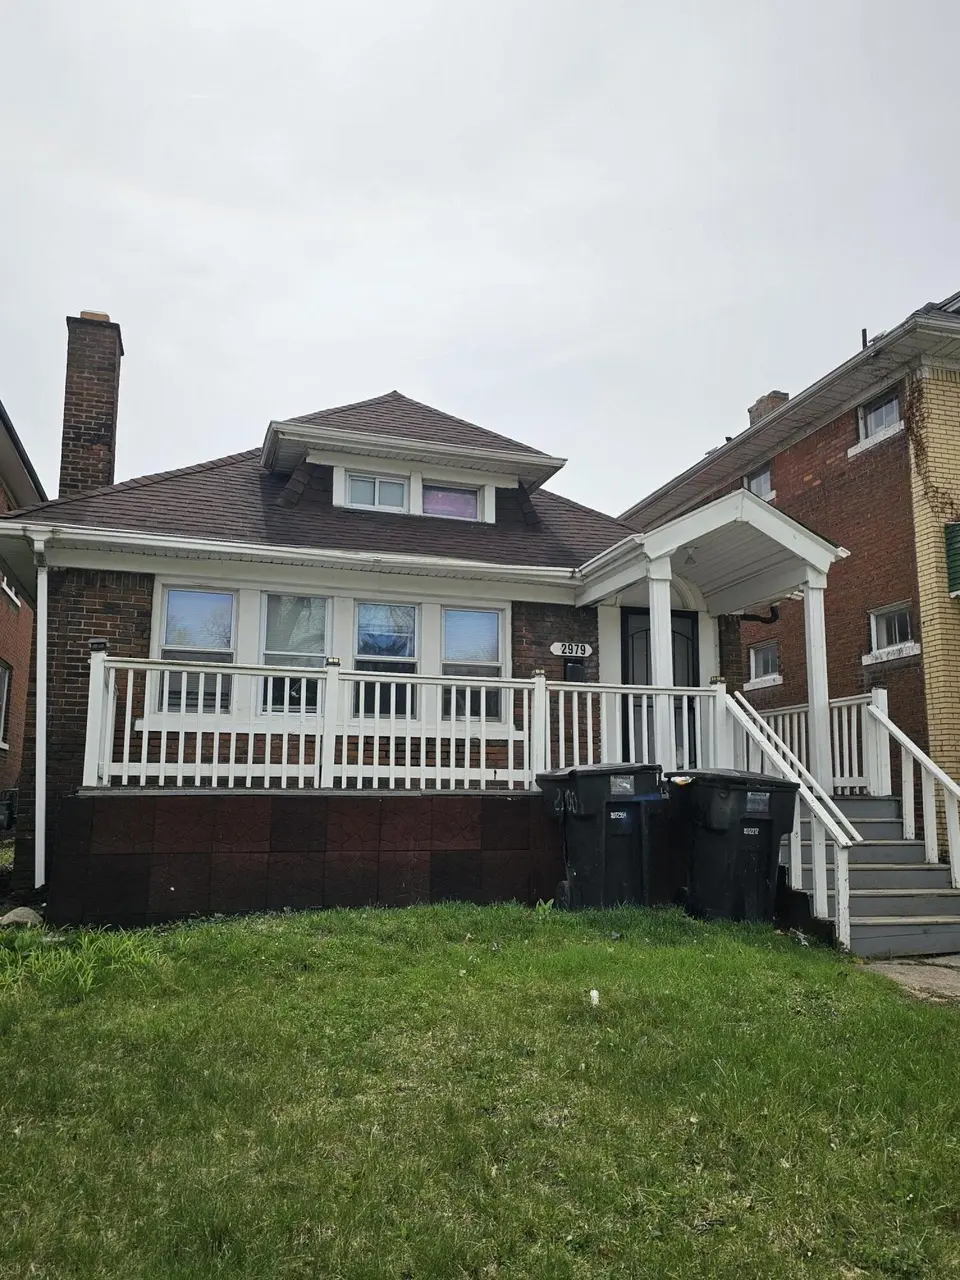
2979 Glendale St · Detroit, MI
Flood risk 1/10 · Minimal
- FEMA flood zone
- X (unshaded)
- Chance of flooding over 30 yrs
- 0.0%
- Est. flood insurance / yr
- $473 – $860
Fire risk 1/10 · Minimal
- Est. fire insurance / yr
- $784 – $1,456
Heat risk 3/10 · Minor
- Hot days now (above 97°F)
- 7 days/yr
- Hot days in 30 yrs
- 15 days/yr
Wind risk 2/10 · Minimal
- Chance of severe wind over 30 yrs
- —
Air-quality risk 4/10 · Minor
- Unhealthy air days now
- 4 days/yr
- Unhealthy air days in 30 yrs
- 6 days/yr
Risk factors via First Street. Map © Google.
Why this score? — see what drove the B- grade
The composite is a weighted blend of 9 inputs, each scored 0–100. Each bar is that input's sub-score; the figure is the points it added to the 100-point composite (weight × sub-score).
- Cash flow +30.0/30.0
- 1% rule +10.0/10.0
- DSCR +10.0/10.0
- ARV discount +7.5/15.0
- Rent growth +4.0/5.0
- Livability +3.7/5.0
- Condition / age +2.5/5.0
- Schools +1.3/10.0
- Appreciation +0.0/10.0
$64,900
🖨 Deal sheet 📄 Offer letter ✓ Due diligence
Listing remarks MLS
Three bedroom, 2 full bathrooms brick bungalow. Updated kitchen and baths. Great opportunity for homeowners and investors.
Key facts
- 4,356 sq ft lot
- Built 1924
- Listed 130 days
Neighborhood map
What this means for you Summary
Snapshot
- This is a 3-bed/1.0-bath single-family listed at $65k.
Deal economics
- At list price, monthly cash flow is $425 ($5k/yr) — positive.
- The deal already cash-flows at list — no discount required.
- Meets the 1% rule at list price ($1k rent vs $65k).
- Recommended offer: $57k (12.0% below list) — sets the bar for market timing.
- Cap rate 14.1% vs local median 10.2% in Detroit — top-decile yield for the area; either an underpriced asset or a hidden risk that comps aren't pricing in. Stress-test before assuming the spread holds.
Location & tenants
- Location reads 73/100 on livability (#218 in MI) — a middle-class / working-renter tenant base. Strengths: amenities A+, commute A+, cost of living A+; Watch: schools F, crime F, employment F.
- Detroit Public Schools Community District (urban): math 10% / reading 24% proficiency, ranked #499 of 540 in MI (top 92%) — low school quality limits family demand, transient renter base, plan for 1-2y turnover; 90% free/reduced lunch — lower-income household profile, screen leases tightly.
- Market conditions: Rents rising fast (+6.1%/yr); 346 active listings in the ZIP; 40 comparable units currently listed for rent nearby; rentals at typical pace (median 24d on market — plan ~3-4 weeks tenant-placement turnaround); 40% of comp listings sitting > 30 days — soft ceiling on asking rent; lower-income renter base — watch delinquency; 2,639 units permitted in Wayne County in 2024 (1,216 in 5+ unit buildings).
- This rent runs 43% of the median local income ($33k/yr) — at the standard rent-burdened threshold; future hikes will face affordability resistance.
Forward outlook
- Local home prices are declining (-3.0%/yr); year-one equity from $449 of loan paydown is wiped out by about $2k of value loss. Plan a longer hold.
- Wayne County population projected at -17% by 2050 — secular population decline; favor cash flow + early exit over multi-decade hold.
- At projected returns (-3.0% appreciation + 6.1% rent growth), your $18k cash investment doubles in ~4 years — after that, you're playing with house money.
Negotiation context
- It's been on market 130 days — a 12% lower offer ($57k) is reasonable based on typical stale-listing flexibility.
- 16 sale attempts since 24y ago; this cycle's ask has dropped $25k (28%) from the opening price — seller is motivated, your offer sets the floor, not the list.
Risks & watch-outs
- Watch-outs: property tax is 3.0% of price; built in 1924 — expect roof / HVAC / electrical / plumbing capex.
Questions for the listing agent
- It's been on market 130 days. Have you received any prior offers? Is the seller open to a 12% concession, seller financing, or rate buy-down credit?
- Built in 1924 — when were the roof, HVAC, electrical panel, plumbing, and water heater last replaced?
- Property tax is high relative to price — has the assessment been appealed recently, and will the sale trigger a re-assessment?
- Why hasn't it sold? Are there any deal-killer items the seller is aware of (foundation, flood, title, zoning, code violations)?
- Is there a deadline driving the sale (1031 exchange, divorce, estate, relocation)? That informs how much negotiation room exists.
- Schools are F-rated, which usually means shorter tenancies and higher turnover. Who's the typical renter profile here, and what's been the actual vacancy rate?
- Crime grade is F in this area — have there been break-ins, vandalism, or insurance claims at this property in the last 3 years? What carrier currently insures it and at what premium?
- What's the average days-on-market for RENTAL listings here right now (not sales)? A rising rental-DOM trend means longer vacancies and softer asking-rent achievability than the comps imply.
- What's the recent tenant-quality profile in this submarket — average credit score on applications, eviction rate, late-payment / NSF rate, and stable-employment percentage? A property-management company in the area should have these aggregated.
- How much new for-sale + rental construction is in the pipeline within 1–3 miles? Heavy new supply typically softens prices + rents 12–24 months out; constrained supply supports both.
Investment metrics
- 1% rule
- 1.86% ✓
- Cap rate
- 14.14%
- Cash-on-cash
- 28.03%
- DSCR
- 2.25
- GRM
- 4.5
CMA / ARV
- ARV (median comp)
- $40,206
- List price
- $64,900
- Delta
- 61.42%
- Verdict
- OVERPRICED
- Comps
- 20 within 1.0 mi
Show comp detail 12 sales within ~0.75 mi
| Address | Dist | Beds/Ba | Sqft | Sold | Price | $/sf | Match |
|---|---|---|---|---|---|---|---|
| 3735 W Buena Vista St | 0.32mi | 3/1.5 | 1,213 (+5%) | 3mo | $164,900 | $136 | 72 |
| 2509 Richton St | 0.46mi | 3/1.0 | 1,114 (-3%) | 2mo | $15,000 | $13 | 72 |
| 2268 Highland St | 0.58mi | 3/1.0 | 1,163 (+1%) | 0mo | $10,000 | $9 | 71 |
| 2474 Sturtevant St | 0.38mi | 3/1.0 | 1,092 (-5%) | 4mo | $28,000 | $26 | 70 |
| 4052 W Buena Vista St | 0.49mi | 3/1.5 | 1,242 (+8%) | 1mo | $160,000 | $129 | 62 |
| 2401 Cortland St | 0.51mi | 3/1.0 | 1,176 (+2%) | 15mo | $18,000 | $15 | 61 |
| 4225 Tyler St | 0.57mi | 2/1.0 (-1) | 1,144 (-1%) | 13mo | $16,500 | $14 | 56 |
| 2291 Tuxedo St | 0.73mi | 3/1.5 | 1,197 (+4%) | 4mo | $35,000 | $29 | 55 |
| 2505 La Belle St | 0.58mi | 3/1.0 | 1,027 (-11%) | 2mo | $25,000 | $24 | 53 |
| 4232 W Buena Vista St | 0.57mi | 3/1.5 | 1,208 (+5%) | 12mo | $25,000 | $21 | 53 |
| 2420 Monterey St | 0.54mi | 3/1.0 | 1,080 (-6%) | 14mo | $48,000 | $44 | 53 |
| 4203 Monterey St | 0.64mi | 3/1.0 | 1,000 (-13%) | 10mo | $40,000 | $40 | 40 |
Match score weights: distance 35% · size 25% · config 20% · recency 20%. Top-matched comps best support the ARV.
Projected returns pro-forma
-3.0% appreciation · 6.14% rent growth · sell at horizon
- IRR
- 26.1%
- Equity multiple
- 2.13×
- Total profit
- $20,517
- Equity at exit
- $9,677
- IRR
- 35.8%
- Equity multiple
- 4.86×
- Total profit
- $70,145
- Equity at exit
- $5,611
Cash invested: $18,172 (down + closing). Projections, not guarantees.
Landlord ↔ Tenant lean methodology
- Overall (STATE)
- 62 Landlord-Friendly
- State Michigan
- 62 Landlord-Friendly · EVEN
- County
- — inherits STATE
- City
- — inherits STATE
ZIP-level market 48238
- Home prices YoY
- -14.4%
- Rents YoY
- 6.1%
- Active inventory
- 346
- Price-to-rent
- 4.5×
Monthly cashflow live
- Estimated rent
- $1,205 high interval (Pro) →
- Mortgage (P&I)
- −$340
- Tax from tax record
- −$160 /mo · $1,923/yr
- Insurance
- −$27
- HOA
- −$0
- Vacancy / Maint / Mgmt
- −$253
- Net cashflow
- $425
Break-even live
UW: 25.0% down · 7.5% · 30yr · 1.5% tax · 5.0% vac · 8.0% maint · 8.0% mgmt
Financing live
Cash to close
- Down payment
- $16,225
- Closing costs
- $1,947
- Reserves months
- —
- Total cash needed
- —
Loan-product check · same deal, 3 products live
Conventional
25% down · 7.5% · 30yr
- Down + closing
- —
- Monthly P&I
- —
- Monthly cashflow
- —
- DSCR
- —
- Eligible?
- —
Personal DTI + credit; lowest rate.
DSCR
20% down · 8.5% · 30yr
- Down + closing
- —
- Monthly P&I
- —
- Monthly cashflow
- —
- DSCR
- —
- Eligible?
- —
No personal income docs; deal must DSCR.
Hard money
10% down · 12.0% · 12mo
- Down + closing
- —
- Monthly P&I
- —
- Monthly cashflow
- —
- DSCR
- —
- Eligible?
- —
Short-term bridge; refi at stabilization.
Rent comps 40 comps
| Address | Beds | Baths | Sqft | Rent | $/sqft | DOM | Units | Dist |
|---|---|---|---|---|---|---|---|---|
| 2676 Sturtevant St Unit 1 Detroit, MI | 2.0 | 1.0 | 1000 | $1,000 | $1.00 | 24d | 1 | 0.21mi |
| 2638 Richton St Unit 2638 Richton Upper Detroit, MI | 2.0 | 1.0 | 1000 | $900 | $0.90 | 43d | 1 | 0.32mi |
| 3224 Monterey St Unit 2E Detroit, MI | 2.0 | 1.0 | 1200 | $1,350 | $1.12 | 43d | 1 | 0.33mi |
| 3740 Tyler St Unit 1 Detroit, MI | 3.0 | 1.0 | 1300 | $1,300 | $1.00 | 4d | 1 | 0.36mi |
| 2474 Fullerton St Detroit, MI | 3.0 | 1.0 | 1400 | $1,300 | $0.93 | 14d | 1 | 0.37mi |
| 3783 Tyler St Unit Lower Detroit, MI | 3.0 | 1.0 | 1000 | $1,150 | $1.15 | 43d | 1 | 0.38mi |
| 3824 Tyler St Apt 1 Detroit, MI | 3.0 | 1.0 | 900 | $1,523 | $1.69 | 16d | 1 | 0.42mi |
| 4203 Tyler St Detroit, MI | 2.0 | 1.0 | 950 | $895 | $0.94 | 43d | 1 | 0.54mi |
| 13639 La Salle Blvd Detroit, MI | 2.0 | 1.0 | 800 | $695 | $0.87 | 10d | 1 | 0.55mi |
| 4045 Clements St Detroit, MI | 3.0 | 1.0 | 850 | $1,150 | $1.35 | 43d | 1 | 0.55mi |
| 4045 Clements St Detroit, MI | 3.0 | 1.0 | 850 | $1,150 | $1.35 | 24d | 1 | 0.55mi |
| 3812 W Grand St Detroit, MI | 2.0 | 1.0 | 1100 | $1,025 | $0.93 | 16d | 1 | 0.55mi |
| 2433 Pasadena St Unit 2435 Detroit, MI | 2.0 | 1.0 | 700 | $1,025 | $1.46 | 43d | 1 | 0.57mi |
| 2285 Cortland St Detroit, MI | 2.0 | 1.0 | 900 | $1,000 | $1.11 | 16d | 1 | 0.59mi |
| 2034 Ewald Cir Detroit, MI | 2.0 | 1.0 | 1000 | $995 | $0.99 | 4d | 1 | 0.60mi |
| 4268 Cortland St Unit 1 Detroit, MI | 2.0 | 1.0 | 1000 | $1,050 | $1.05 | 43d | 1 | 0.62mi |
| 4336 Buena Vista St Detroit, MI | 3.0 | 1.0 | 1300 | $1,100 | $0.85 | 43d | 1 | 0.67mi |
| 2634 Lawrence St Detroit, MI | 3.0 | 1.5 | 1388 | $1,600 | $1.15 | 1d | 1 | 0.67mi |
| 4287 W Grand St Unit 4289 Detroit, MI | 3.0 | 1.0 | 1250 | $1,000 | $0.80 | 43d | 1 | 0.71mi |
| 3224 Calvert St Detroit, MI | 3.0 | 1.0 | 1150 | $1,150 | $1.00 | 43d | 1 | 0.76mi |
| 3226 Calvert Ave Detroit, MI | 3.0 | 1.0 | 1100 | $1,200 | $1.09 | 12d | 1 | 0.76mi |
| 3266 Calvert Ave Fl 2 Detroit, MI | 3.0 | 1.0 | 1279 | $1,300 | $1.02 | 24d | 1 | 0.77mi |
| 1926 Clements St Unit 1926 Detroit, MI | 3.0 | 1.0 | 1150 | $1,250 | $1.09 | 19d | 1 | 0.79mi |
| 1926 Clements St Detroit, MI | 3.0 | 1.0 | 1150 | $1,150 | $1.00 | 4d | 1 | 0.79mi |
| 2925 Calvert St Detroit, MI | 3.0 | 1.0 | 1400 | $1,300 | $0.93 | 16d | 1 | 0.79mi |
| 2023 Tuxedo St Detroit, MI | 2.0 | 1.0 | 950 | $1,050 | $1.11 | 24d | 1 | 0.80mi |
| 2727 Calvert Ave Unit 1 Detroit, MI | 3.0 | 1.5 | 1350 | $1,200 | $0.89 | 43d | 1 | 0.80mi |
| 2653 Calvert Ave Unit 1 Detroit, MI | 3.0 | 1.0 | 1305 | $1,200 | $0.92 | 43d | 1 | 0.81mi |
| 11704 Broadstreet Ave Detroit, MI | 3.0 | 1.0 | 1200 | $1,050 | $0.88 | 43d | 1 | 0.87mi |
| 12663 Stoepel St Detroit, MI | 2.0 | 1.0 | 1100 | $1,050 | $0.95 | 21d | 1 | 0.95mi |
| 12663 Stoepel St Unit 1 Detroit, MI | 2.0 | 1.0 | 750 | $975 | $1.30 | 17d | 1 | 0.95mi |
| 3295 Rochester St Unit 2 Detroit, MI | 2.0 | 1.0 | 800 | $1,000 | $1.25 | 4d | 1 | 0.97mi |
| 3295 Rochester St Unit 2 Detroit, MI | 2.0 | 1.0 | 782 | $850 | $1.09 | 43d | 1 | 0.97mi |
| 2690 Ewald Cir Detroit, MI | 1.0–2.0 | 1.0 | 750 | $900 | $1.20 | 24d | 4 | 0.97mi |
| 2045 Calvert St Detroit, MI | 2.0 | 2.0 | 1400 | $1,600 | $1.14 | 43d | 1 | 1.00mi |
| 1929 Calvert Ave Unit 2 Detroit, MI | 3.0 | 1.0 | 1414 | $1,199 | $0.85 | 14d | 1 | 1.07mi |
| 12415 Monica St Detroit, MI | 2.0 | 1.0 | 1000 | $1,200 | $1.20 | 43d | 1 | 1.08mi |
| 3422 Edison St Detroit, MI | 3.0 | 1.0 | 1300 | $1,295 | $1.00 | 16d | 1 | 1.10mi |
| 2926 Ewald Cir Detroit, MI | 2.0 | 1.0 | 800 | $900 | $1.12 | 17d | 1 | 1.11mi |
| 13620 Tuller St Detroit, MI | 4.0 | 1.0 | 1064 | $1,374 | $1.29 | 12d | 1 | 1.14mi |
Listing history 50 events
-
2026-06-18days on market $64,900 Active 130 DOM
-
2026-06-17days on market $64,900 Active 129 DOM
-
2026-06-15days on market $64,900 Active 127 DOM
-
2026-06-13days on market $64,900 Active 125 DOM
-
2026-06-13days on market $64,900 Active 124 DOM
-
2026-06-09days on market $64,900 Active 121 DOM
-
2026-06-08days on market $64,900 Active 120 DOM
-
2026-06-07days on market $64,900 Active 119 DOM
-
2026-06-04days on market $64,900 Active 116 DOM
-
2026-06-03days on market $64,900 Active 115 DOM
-
2026-06-01days on market $64,900 Active 113 DOM
-
2026-05-31days on market $64,900 Active 112 DOM
-
2026-04-21price $64,900 122-char remark
Show marketing remark (122 chars)
Three bedroom, 2 full bathrooms brick bungalow. Updated kitchen and baths. Great opportunity for homeowners and investors.
-
2026-04-21price $64,900 122-char remark
Show marketing remark (122 chars)
Three bedroom, 2 full bathrooms brick bungalow. Updated kitchen and baths. Great opportunity for homeowners and investors.
-
2026-04-21price $64,900
Show marketing remark (122 chars)
Three bedroom, 2 full bathrooms brick bungalow. Updated kitchen and baths. Great opportunity for homeowners and investors.
-
2026-02-04$89,900 Active 122-char remark
Show marketing remark (122 chars)
Three bedroom, 2 full bathrooms brick bungalow. Updated kitchen and baths. Great opportunity for homeowners and investors.
-
2026-02-04$89,900 Active 122-char remark
Show marketing remark (122 chars)
Three bedroom, 2 full bathrooms brick bungalow. Updated kitchen and baths. Great opportunity for homeowners and investors.
-
2026-02-04$89,900 Active
Show marketing remark (122 chars)
Three bedroom, 2 full bathrooms brick bungalow. Updated kitchen and baths. Great opportunity for homeowners and investors.
-
2026-01-09historical
-
2026-01-09historical
-
2025-08-06$99,900 Active
-
2025-08-06$99,900 Active
-
2023-11-20soldstatus $99,000
-
2021-01-22soldstatus $69,900
-
2020-07-23soldstatus $69,900
-
2020-04-01historical
-
2020-04-01historical
-
2020-03-20status Active
-
2020-03-17historical
-
2020-02-27historical
-
2020-02-26historical
-
2020-01-31status Active
-
2020-01-08historical
-
2019-11-04$55,000 Active
-
2019-11-04$55,000 Active
-
2019-11-04$55,000 Active
-
2019-11-04$55,000 Active
-
2018-08-30historical
-
2018-08-30historical
-
2018-07-28price $15,500
-
2018-07-27price $15,500
-
2018-07-06status Active
-
2018-07-02historical
-
2018-06-21$18,500 Active
-
2018-06-21$18,500 Active
-
2004-01-12soldstatus $20,800
-
2004-01-12soldstatus $20,800
-
2003-09-24historical
-
2002-12-13$20,800
-
2002-12-12$23,400
ⓘ Source: listings_history table (triggers on properties + properties_extension) + one-shot
backfill from property_details.listing_events for pre-trigger history.
Tax reassessment forecast MI · Partial reset (capped growth)
- Current annual tax
- $1,923 · $160/mo
- Projected year-2 tax
- $1,923 · $160/mo
- Expected delta
- $0/yr ($0/mo · 0.0%)
ⓘ Screening estimate from a state-policy table — verify with the county assessor before closing.
Climate risk First Street
- Flood 1/10 Low FEMA zone X (unshaded) · 0% chance over 30 yrs
- Wildfire 1/10 Low
- Heat 3/10 Moderate 7 d/yr ≥97°F today · 15 d/yr by 30 yrs out
- Wind 2/10 Low
- Air quality 4/10 Moderate 4 unhealthy d/yr today · 6 by 30 yrs out
Nearby sold comps map
Loading sold comps map…
Walkable amenities ~0.75 mi
Loading nearby amenities…
Taxation est. · year 1
- Rental income
- $14,464
- − Mortgage interest
- −$3,635
- − Property taxes
- −$1,923
- − Insurance
- −$324
- − Repairs & maintenance
- −$1,157
- − Management
- −$1,157
- − Depreciation
- −$1,888
- Taxable income
- $4,378
- Est. tax owed @ 24.0%
- −$1,051
- After-tax cash flow
- $4,044/yr
For passive investors: Depreciation is non-cash, so a rental often shows a tax loss while cash-flowing — sheltering income. Rental losses are passive: they offset passive income freely, and up to $25,000/yr can offset ordinary (W-2) income if you actively participate and your MAGI is under $100k (phasing out to $0 by $150k); unused losses carry forward. On sale, claimed depreciation is recaptured at up to 25%, and gains may owe capital-gains tax (a 1031 exchange can defer both). Figures are a year-1 estimate at your 24.0% rate — not tax advice; consult a CPA.
Schools (NCES district)
- District
- Detroit Public Schools Community District
- NCES district ID
- 2601103
- Math proficiency
- 10% ▼ -2.00%
- Reading proficiency
- 24% ▲ 6.00%
- Median HH income
- $25,815
- Composite
- 13.06/100
- National rank
- #9564
- State rank
- #499 of 540 in MI
Livability — Detroit
- Score
- 73/100
- State rank
- #218
- US rank
- #5427
Category grades
Schools grade is shown separately in the Schools card above.
Census & demographics
- Census place
- Detroit, MI
- County
- Wayne County · 1,562,939 people
- City population
- 572,865
- Metro
- Detroit-Warren-Dearborn, MI
- Population (ZIP)
- 24,731
- Household income
- $33,315
- Rent vs Own
- Severe rent burden
- 2172.0
Population outlook (Wayne County) Hauer SSP2
- Today (2025)
- 1,675,273 people
- By 2030
- 1,620,300 · -3.3%
- By 2040
- 1,502,341 · -10.3%
- By 2050
- 1,384,039 · -17.4%
- By 2075
- 1,124,592 · -32.9%
- By 2100
- 881,193 · -47.4%
Race, ethnicity, and origin ACS 2023
- Neighborhood character
- Predominantly Black (94%)
- Race & ethnicity
- Black 94% Two or more races 3% White 1%
- Foreign-born
- 1%
Political lean MEDSL · Wayne
- 2024 margin
- Strong D (+29.0) · D 62.7% · R 33.7% · Other 3.6%
- 2008→2024 swing
- -20.5pp toward R · 2008: 49.5pp · 2024: 29.0pp
- All cycles
- 2024: D+29.0 2020: D+38.1 2016: D+37.3 2012: D+46.9 2008: D+49.5
Not yet ingested
- Civics
- —
Market trends
- HPI YoY
- ▼ -31.96%
- Current HPI
- 189.6227
- Rent YoY
- ▲ 6.14%
- Metro
- Detroit-Warren-Dearborn, MI
- State GDP YoY
- ▲ 1.37%
- F500 in state
- 28
Industry mix (Fortune 500 HQ in MI)
| Industry | F500 HQs | Revenue |
|---|---|---|
| Automotive Parts | 3 | $48B |
|
||
| Automotive | 2 | $372B |
|
||
| Chemicals | 1 | $45B |
|
||
| Automotive Retail | 1 | $29B |
|
||
| Healthcare / Medical Devices | 1 | $23B |
|
||
| Automotive Technology | 1 | $20B |
|
||
Price history
+177.4% since first listed38 events — show timeline
- 2026-04-21 Price Changed $64,900 MiRealSource-MiMLS
- 2026-04-21 Price Changed $64,900 REALCOMP
- 2026-04-21 Price Changed $64,900 SW Michigan MLS
- 2026-02-04 Listed $89,900 SW Michigan MLS
- 2026-02-04 Listed $89,900 REALCOMP
- 2026-02-04 Listed $89,900 MiRealSource-MiMLS
- 2026-01-09 Listing Removed — MiRealSource-MiMLS
- 2026-01-09 Listing Removed — REALCOMP
- 2025-08-06 Listed $99,900 MiRealSource-MiMLS
- 2025-08-06 Listed $99,900 REALCOMP
- 2023-11-20 Sold (Public Records) $99,000 Public Records
- 2021-01-22 Sold (Public Records) $69,900 Public Records
- 2020-07-23 Sold (Public Records) $69,900 Public Records
- 2020-04-01 Listing Removed — REALCOMP
- 2020-04-01 Listing Removed — MiRealSource-MiMLS
- 2020-03-20 Relisted — REALCOMP
- 2020-03-17 Listing Removed — REALCOMP
- 2020-02-27 Listing Removed — REALCOMP
- 2020-02-26 Listing Removed — MiRealSource-MiMLS
- 2020-01-31 Relisted — REALCOMP
- 2020-01-08 Listing Removed — REALCOMP
- 2019-11-04 Listed $55,000 MiRealSource-MiMLS
- 2019-11-04 Listed $55,000 MiRealSource-MiMLS
- 2019-11-04 Listed $55,000 REALCOMP
- 2019-11-04 Listed $55,000 REALCOMP
- 2018-08-30 Listing Removed — REALCOMP
- 2018-08-30 Listing Removed — MiRealSource-MiMLS
- 2018-07-28 Price Changed $15,500 MiRealSource-MiMLS
- 2018-07-27 Price Changed $15,500 REALCOMP
- 2018-07-06 Relisted — REALCOMP
- 2018-07-02 Listing Removed — REALCOMP
- 2018-06-21 Listed $18,500 MiRealSource-MiMLS
- 2018-06-21 Listed $18,500 REALCOMP
- 2004-01-12 Sold (MLS) $20,800 MiRealSource-MiMLS
- 2004-01-12 Sold (MLS) $20,800 REALCOMP
- 2003-09-24 Listing Removed — MiRealSource-MiMLS
- 2002-12-13 Listed $20,800 REALCOMP
- 2002-12-12 Listed $23,400 MiRealSource-MiMLS
Property tax history
+20.8%/yrLatest (2025): $1,923 · -10.0% YoY. Source: county tax records.
Cash-flow waterfall
monthlySold comps — $/sqft
last 12 mo · ≤1 miLoading sold comps…