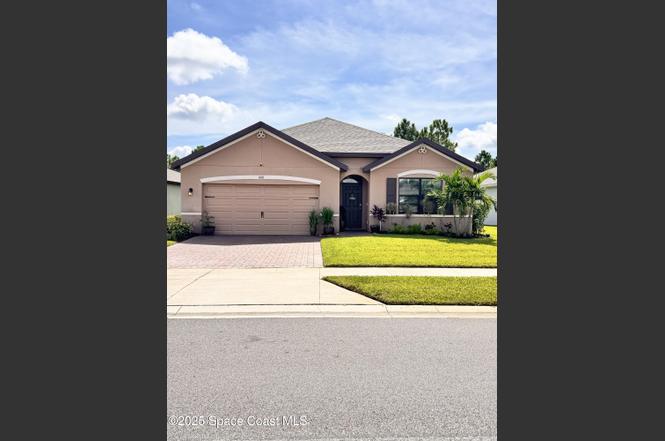
668 Old Country Rd SE · Palm Bay, FL
Flood risk 1/10 · Minimal
- FEMA flood zone
- X (unshaded)
- Chance of flooding over 30 yrs
- 0.0%
- Est. flood insurance / yr
- $507 – $1,088
Fire risk 4/10 · Minor
- Est. fire insurance / yr
- $947 – $1,759
Heat risk 9/10 · Severe
- Hot days now (above 106°F)
- 7 days/yr
- Hot days in 30 yrs
- 21 days/yr
Wind risk 10/10 · Severe
- Chance of severe wind over 30 yrs
- 99.0%
Air-quality risk 1/10 · Minimal
- Unhealthy air days now
- 0 days/yr
- Unhealthy air days in 30 yrs
- 0 days/yr
Risk factors via First Street. Map © Google.
Why this score? — see what drove the D grade
The composite is a weighted blend of 9 inputs, each scored 0–100. Each bar is that input's sub-score; the figure is the points it added to the 100-point composite (weight × sub-score).
- Appreciation +10.0/10.0
- ARV discount +7.5/15.0
- Cash flow +6.4/30.0
- Schools +4.7/10.0
- Livability +3.6/5.0
- Rent growth +3.4/5.0
- Condition / age +2.5/5.0
- 1% rule +1.5/10.0
- DSCR +0.7/10.0
$350,000
🖨 Deal sheet (PDF) 📄 Offer letter ✓ Due diligence
Listing remarks
Welcome to this beautifully spacious 4bed, 2bath 2car garage home, offering 1,918 sq. ft. of comfortable living space. Backing up to a peaceful wooded preserve, this property provides both privacy and serene natural views. The open-concept layout features a large family room that flows seamlessly into the kitchen and dining areas--perfect for both everyday living and entertaining. The kitchen is well-appointed with granite countertops, upgraded stainless steel appliances and 42'' cabinets with crown molding. Step outside to enjoy a fully fenced backyard and a screened lanai, ideal for relaxing on warm Florida days. Located within a gated community in Bayside Lakes, residents enjoy access t
Key facts
- Gated community
- Community pool
- Screened lanai
Tags
Property features AI
Finance
- Other: Living area reported as 1,918 (informational)
- HOA & community: Association: Towers Management; Quarterly association fee of $210; Community amenities include clubhouse, fitness center, sauna, basketball court, tennis courts, gated entry, and RV/boat storage
Exterior
- Parking: Attached 2-car garage
- Security: Gated community / Security gate
- Utilities: Public sewer; Electricity connected; Sewer connected
- Home design: Single family residence; Faces northwest
- Construction: Block, concrete and stucco construction; Shingle roof; Pets allowed
- Exterior features: Patio (screened); Fenced backyard; Sprinklers in front and rear; Asphalt road access; Security gate
Interior
- Kitchen: Dishwasher; Disposal; Electric cooktop; Electric oven; Microwave; Refrigerator; Electric water heater
- Bedrooms: 4 bedrooms
- Bathrooms: 2 full bathrooms
- Heating & cooling: Central heating (electric); Central air conditioning
- Interior features: Open floorplan; Kitchen island; His and hers closets; Walk-in closets; Smart home / Smart technology; Central living area
- Laundry & utility: Unfurnished (no included washer/dryer listed)
Neighborhood map
What this means for you Summary
Snapshot
- This is a 4-bed/2.0-bath single-family listed at $350k.
Deal economics
- At list price, monthly cash flow is $-600 ($-7k/yr) — negative.
- To cash-flow at today's rent, offer at most $244k (30.3% below list).
- To meet the 1% rule (rent ≥ 1% of price), the offer needs to be $229k (34.7% below list).
- Recommended offer: $229k (34.7% below list) — sets the bar for 1% rule.
Location & tenants
- Location reads 72/100 on livability (#366 in FL) — a middle-class / working-renter tenant base. Strengths: cost of living A+, housing A+; Watch: employment D+, amenities F, health & safety D-.
- Brevard (suburban): math 53% / reading 57% proficiency, ranked #19 of 73 in FL (top 26%) — acceptable for families but not a draw, mixed tenant base, ~2y average lease.
- Zoned schools: Westside Elementary School (math 51% / reading 58%, grade C, #892 of 2,144 statewide, top 44%, 798 students, 52% FRL); Southwest Middle School (math 40% / reading 39%, grade F, #373 of 571 statewide, top 66%, 920 students, 58% FRL); Bayside High School (math 27% / reading 40%, grade F, #400 of 667 statewide, top 61%, 1,854 students, 51% FRL).
- Zoned-school proficiency averages 42% at this address vs 55% district-wide (-12 pts) — the specific schools serving this property underperform the Brevard average; the district grade overstates school quality for this exact location.
- Market conditions: Rents rising (+3.7%/yr); 1123 active listings in the ZIP; 25 comparable units currently listed for rent nearby; rentals at typical pace (median 23d on market — plan ~3-4 weeks tenant-placement turnaround); solid renter incomes; 4,602 units permitted in Brevard County in 2024 (702 in 5+ unit buildings).
- This rent runs 34% of the median local income ($80k/yr) — at the standard rent-burdened threshold; future hikes will face affordability resistance.
Forward outlook
- In year one you build about $37k of equity ($2k loan paydown + $35k appreciation (10.0% local appreciation)).
- Brevard County population projected at +15% by 2050 — modest demand growth; plan on rents tracking national, not racing it.
- By year 2, paydown + projected appreciation supports a ~$60k cash-out refi (75% LTV) — recoverable capital for the next deal without selling this one.
Negotiation context
- It's been on market 212 days — a 12% lower offer ($308k) is reasonable based on typical stale-listing flexibility.
- 6 sale attempts since 5y ago; this cycle's ask is 6% above the opening price — seller raised mid-cycle; expect resistance to lowballs.
Risks & watch-outs
- Climate carrying-cost: severe wind risk, 99% chance of damaging wind over 30y; extreme-heat days projected 7→21/yr by 2055 (HVAC capex compounding) — expect insurance premiums to compound above CPI over the hold.
Questions for the listing agent
- What do current leases actually rent for vs. the listed asking? Can we see a recent rent roll and the last 12 months of T-12 income?
- It's been on market 212 days. Have you received any prior offers? Is the seller open to a 35% concession, seller financing, or rate buy-down credit?
- What does the HOA fee cover, when was the last increase, and are there any pending special assessments or reserve-fund shortfalls?
- Why hasn't it sold? Are there any deal-killer items the seller is aware of (foundation, flood, title, zoning, code violations)?
- Is there a deadline driving the sale (1031 exchange, divorce, estate, relocation)? That informs how much negotiation room exists.
- The area grade is low — what's the realistic commute time and amenity access for the typical tenant pool here? Any planned neighborhood developments (good or bad) we should know about?
- What's the average days-on-market for RENTAL listings here right now (not sales)? A rising rental-DOM trend means longer vacancies and softer asking-rent achievability than the comps imply.
- What's the recent tenant-quality profile in this submarket — average credit score on applications, eviction rate, late-payment / NSF rate, and stable-employment percentage? A property-management company in the area should have these aggregated.
- How much new for-sale + rental construction is in the pipeline within 1–3 miles? Heavy new supply typically softens prices + rents 12–24 months out; constrained supply supports both.
Investment metrics
- 1% rule
- 0.65% ✗
- Cap rate
- 4.24%
- Cash-on-cash
- -7.35%
- DSCR
- 0.67
- GRM
- 12.8
CMA / ARV
No comps found within radius.
Projected returns pro-forma
10.0% appreciation · 3.67% rent growth · sell at horizon
- IRR
- 19.3%
- Equity multiple
- 2.57×
- Total profit
- $153,987
- Equity at exit
- $315,308
- IRR
- 17.9%
- Equity multiple
- 5.97×
- Total profit
- $486,799
- Equity at exit
- $679,973
Cash invested: $98,000 (down + closing). Projections, not guarantees.
Landlord ↔ Tenant lean methodology
- Overall (STATE)
- 87 Strongly Landlord-Friendly
- State Florida
- 87 Strongly Landlord-Friendly · R+3
- County
- — inherits STATE
- City
- — inherits STATE
ZIP-level market 32909
- Home prices YoY
- 6.0%
- Rents YoY
- 3.7%
- Active inventory
- 1123
- Price-to-rent
- 12.8×
Monthly cashflow live
- Estimated rent
- $2,285 high interval (Pro) →
- Mortgage (P&I)
- −$1,835
- Tax from tax record
- −$354 /mo · $4,246/yr
- Insurance
- −$146
- HOA
- −$70
- Vacancy / Maint / Mgmt
- −$480
- Net cashflow
- $-600
Break-even live
Sensitivity live
| Price | -10% $-402 | -5% $-501 | +0% $-600 | +5% $-699 | +10% $-798 |
|---|---|---|---|---|---|
| Rent | -10% $-780 | -5% $-690 | +0% $-600 | +5% $-510 | +10% $-419 |
| Rate | -1.0pp $-424 | -0.5pp $-511 | base $-600 | +0.5pp $-691 | +1.0pp $-783 |
UW: 25.0% down · 7.5% · 30yr · 1.5% tax · 5.0% vac · 8.0% maint · 8.0% mgmt
Financing live
Cash to close
- Down payment
- $87,500
- Closing costs
- $10,500
- Reserves months
- —
- Total cash needed
- —
Loan-product check · same deal, 3 products live
Conventional
25% down · 7.5% · 30yr
- Down + closing
- —
- Monthly P&I
- —
- Monthly cashflow
- —
- DSCR
- —
- Eligible?
- —
Personal DTI + credit; lowest rate.
DSCR
20% down · 8.5% · 30yr
- Down + closing
- —
- Monthly P&I
- —
- Monthly cashflow
- —
- DSCR
- —
- Eligible?
- —
No personal income docs; deal must DSCR.
Hard money
10% down · 12.0% · 12mo
- Down + closing
- —
- Monthly P&I
- —
- Monthly cashflow
- —
- DSCR
- —
- Eligible?
- —
Short-term bridge; refi at stabilization.
Rent comps 25 comps
| Address | Beds | Baths | Sqft | Rent | $/sqft | DOM | Units | Dist |
|---|---|---|---|---|---|---|---|---|
| 978 Remington Green Dr SE Palm Bay, FL | 4.0 | 2.0 | 1830 | $2,200 | $1.20 | 25d | 1 | 0.13mi |
| 2250 Chinaberry Cir SE Palm Bay, FL | 3.0 | 2.0 | 1669 | $1,995 | $1.20 | 25d | 1 | 0.39mi |
| 830 Painesville St SE Palm Bay, FL | 3.0 | 2.0 | 2029 | $2,220 | $1.09 | 15d | 1 | 0.50mi |
| 1224 Dillard Dr SE Palm Bay, FL | 3.0 | 2.0 | 1770 | $2,336 | $1.32 | 15d | 1 | 0.66mi |
| 590 Trymore Dr SE Palm Bay, FL | 4.0 | 2.0 | 1873 | $2,250 | $1.20 | 16d | 1 | 0.69mi |
| 1165 Rabbit St SE Palm Bay, FL | 3.0 | 2.0 | 1994 | $1,895 | $0.95 | 21d | 1 | 0.72mi |
| 2691 Tepee Ave SE Palm Bay, FL | 4.0 | 2.0 | 1833 | $2,040 | $1.11 | 23d | 1 | 0.74mi |
| 2036 Walsh Ave SE Palm Bay, FL | 3.0 | 2.0 | 1331 | $1,930 | $1.45 | 25d | 1 | 0.82mi |
| 402 Breckenridge Cir SE Palm Bay, FL | 3.0 | 2.0 | 1960 | $2,200 | $1.12 | 25d | 1 | 0.95mi |
| 555 Gagnon St SE Palm Bay, FL | 4.0 | 3.0 | 2373 | $2,400 | $1.01 | 25d | 1 | 0.98mi |
| 1198 Venus St SE Palm Bay, FL | 3.0 | 2.0 | 1535 | $1,961 | $1.28 | 23d | 1 | 1.01mi |
| 1454 Graves St SE Palm Bay, FL | 3.0 | 2.0 | 1621 | $2,100 | $1.30 | 16d | 1 | 1.02mi |
| 543 Reading St SE Palm Bay, FL | 4.0 | 2.0 | 1833 | $2,010 | $1.10 | 23d | 1 | 1.09mi |
| 1406 Martinez St SE Palm Bay, FL | 4.0 | 2.0 | 2083 | $2,100 | $1.01 | 25d | 1 | 1.15mi |
| 1416 Martinez St SE Palm Bay, FL | 3.0 | 2.0 | 1747 | $2,000 | $1.14 | 16d | 1 | 1.16mi |
| 2749 Freehold Ave SE Palm Bay, FL | 3.0 | 2.0 | 1386 | $1,800 | $1.30 | 25d | 1 | 1.22mi |
| 1150 Tiger St SE Palm Bay, FL | 3.0 | 2.0 | 1690 | $1,950 | $1.15 | 16d | 1 | 1.23mi |
| 1068 Saint Johns St SE Palm Bay, FL | 3.0 | 2.0 | 1332 | $2,000 | $1.50 | 25d | 1 | 1.29mi |
| 2242 Mantilla Ave SE Palm Bay, FL | 5.0 | 2.0 | 2516 | $2,176 | $0.86 | 23d | 1 | 1.29mi |
| 2785 Gabboys Ave SE Palm Bay, FL | 3.0 | 2.0 | 1475 | $1,849 | $1.25 | 25d | 1 | 1.31mi |
| 486 Dadeville St SE Palm Bay, FL | 4.0 | 2.0 | 1833 | $1,995 | $1.09 | 16d | 1 | 1.37mi |
| 2910 Emerson Dr SE Palm Bay, FL | 3.0 | 2.0 | 1700 | $1,950 | $1.15 | 16d | 1 | 1.43mi |
| 2877 Palisades Dr SE Palm Bay, FL | 3.0 | 2.0 | 1974 | $2,150 | $1.09 | 21d | 1 | 1.44mi |
| 1660 Lizette St SE Unit 1 Palm Bay, FL | 4.0 | 2.0 | 1736 | $2,199 | $1.27 | 25d | 1 | 1.46mi |
| 1677 Lizette St SE Unit A Palm Bay, FL | 3.0 | 2.0 | 2080 | $1,900 | $0.91 | 16d | 1 | 1.48mi |
HOA detail
- Monthly dues
- $70 · $840/yr
- Likely covers
- security
Listing history 29 events
-
2026-06-22days on market $350,000 Active 212 DOM
-
2026-06-18days on market $350,000 Active 209 DOM
-
2026-06-17days on market $350,000 Active 208 DOM
-
2026-06-16days on market $350,000 Active 207 DOM
-
2026-06-15days on market $350,000 Active 206 DOM
-
2026-06-14days on market $350,000 Active 204 DOM
-
2026-06-10days on market $350,000 Active 201 DOM
-
2026-06-08days on market $350,000 Active 199 DOM
-
2026-06-07days on market $350,000 Active 198 DOM
-
2026-06-05days on market $350,000 Active 195 DOM
-
2026-06-03days on market $350,000 Active 194 DOM
-
2026-06-02days on market $350,000 Active 193 DOM
-
2026-06-01days on market $350,000 Active 192 DOM
-
2026-05-31days on market $350,000 Active 191 DOM
-
2026-05-31days on market $350,000 Active 190 DOM
-
2026-03-04status Active
-
2026-03-01historical
-
2026-02-13price $350,000
-
2026-02-11status Active
-
2025-12-08status Pending
-
2025-12-08historical
-
2025-09-22$330,000 Active
-
2025-09-12price $330,000
-
2025-09-12price $330,000
-
2025-08-29$350,000 Active
-
2025-08-28$350,000 Active
-
2021-12-29soldstatus $309,085 Closed
-
2021-07-26historical Contingent
-
2021-07-16$309,085 Active
ⓘ Source: listings_history table (triggers on properties + properties_extension) + one-shot
backfill from property_details.listing_events for pre-trigger history.
Tax reassessment forecast FL · Resets to sale price
- Current annual tax
- $4,246 · $354/mo
- Projected year-2 tax
- $4,246 · $354/mo
- Expected delta
- $0/yr ($0/mo · 0.0%)
ⓘ Screening estimate from a state-policy table — verify with the county assessor before closing.
Climate risk First Street
- Flood 1/10 Low FEMA zone X (unshaded) · 0% chance over 30 yrs
- Wildfire 4/10 Moderate
- Heat 9/10 Extreme 7 d/yr ≥106°F today · 21 d/yr by 30 yrs out
- Wind 10/10 Extreme 99% chance of damaging wind over 30 yrs
- Air quality 1/10 Low 0 unhealthy d/yr today · 0 by 30 yrs out
Nearby sold comps map
Loading sold comps map…
Walkable amenities ~0.75 mi
Loading nearby amenities…
Taxation est. · year 1
- Rental income
- $27,421
- − Mortgage interest
- −$19,605
- − Property taxes
- −$4,246
- − Insurance
- −$1,750
- − Repairs & maintenance
- −$2,194
- − Management
- −$2,194
- − HOA
- −$840
- − Depreciation
- −$10,182
- Taxable loss
- −$13,590
- Est. tax savings @ 24.0%
- +$3,262
- After-tax cash flow
- $-3,937/yr
For passive investors: Depreciation is non-cash, so a rental often shows a tax loss while cash-flowing — sheltering income. Rental losses are passive: they offset passive income freely, and up to $25,000/yr can offset ordinary (W-2) income if you actively participate and your MAGI is under $100k (phasing out to $0 by $150k); unused losses carry forward. On sale, claimed depreciation is recaptured at up to 25%, and gains may owe capital-gains tax (a 1031 exchange can defer both). Figures are a year-1 estimate at your 24.0% rate — not tax advice; consult a CPA.
Schools (NCES district)
- District
- Brevard
- NCES district ID
- 1200150
- Math proficiency
- 53% ▼ -9.00%
- Reading proficiency
- 57% ▼ -4.00%
- Median HH income
- $49,426
- Composite
- 46.86/100
- National rank
- #2370
- State rank
- #19 of 73 in FL
Livability — Palm Bay
- Score
- 72/100
- State rank
- #366
- US rank
- #6458
Category grades
Schools grade is shown separately in the Schools card above.
Census & demographics
- Census place
- Palm Bay, FL
- County
- Brevard County · 602,871 people
- City population
- 132,211
- Metro
- Palm Bay-Melbourne-Titusville, FL
- Population (ZIP)
- 41,804
- Household income
- $79,977
- Rent vs Own
- Severe rent burden
- 697.0
Population outlook (Brevard County) Hauer SSP2
- Today (2025)
- 623,254 people
- By 2030
- 648,420 · +4.0%
- By 2040
- 690,009 · +10.7%
- By 2050
- 715,669 · +14.8%
- By 2075
- 775,744 · +24.5%
- By 2100
- 776,687 · +24.6%
Race, ethnicity, and origin ACS 2023
- Neighborhood character
- Diverse neighborhood (Simpson 0.70)
- Race & ethnicity
- White 46% Black 21% Hispanic / Latino 20% Two or more races 16% Asian 4%
- Hispanic origin (detail)
- Mexican 2% Puerto Rican 8% Cuban 5%
- Common ancestry
- Hispanic 3% Slovak 2% Lithuanian 2%
- Foreign-born
- 17% · Canada, China, Jamaica
- Languages at home
- 84% English-only · Spanish 9% French/Haitian/Cajun 4% Chinese 1%
Political lean MEDSL · Brevard
- 2024 margin
- Strong R (+20.8) · D 39.1% · R 59.9% · Other 1.0%
- 2008→2024 swing
- -10.4pp toward R · 2008: -10.4pp · 2024: -20.8pp
- All cycles
- 2024: R+20.8 2020: R+16.4 2016: R+19.8 2012: R+12.7 2008: R+10.4
Not yet ingested
- Civics
- —
Market trends
- HPI YoY
- ▲ 18.81%
- Current HPI
- 330.8595
- Rent YoY
- ▲ 3.67%
- Metro
- Palm Bay-Melbourne-Titusville, FL
- State GDP YoY
- ▲ 3.28%
- F500 in state
- 36
Industry mix (Fortune 500 HQ in FL)
| Industry | F500 HQs | Revenue |
|---|---|---|
| Industrial Technology | 2 | $29B |
|
||
| Insurance | 2 | $17B |
|
||
| Retail | 1 | $60B |
|
||
| Technology Distribution | 1 | $58B |
|
||
| Homebuilding | 1 | $35B |
|
||
| Technology Manufacturing | 1 | $35B |
|
||
Price history
+13.2% since first listed14 events — show timeline
- 2026-03-04 Relisted — SCMLS
- 2026-03-01 Listing Removed — Beaches MLS
- 2026-02-13 Price Changed $350,000 SCMLS
- 2026-02-11 Relisted — SCMLS
- 2025-12-08 Pending — SCMLS
- 2025-12-08 Listing Removed — SCMLS
- 2025-09-22 Listed $330,000 Beaches MLS
- 2025-09-12 Price Changed $330,000 RAIRCMLS
- 2025-09-12 Price Changed $330,000 SCMLS
- 2025-08-29 Listed $350,000 RAIRCMLS
- 2025-08-28 Listed $350,000 SCMLS
- 2021-12-29 Sold (MLS) $309,085 SCMLS
- 2021-07-26 Contingent — SCMLS
- 2021-07-16 Listed $309,085 SCMLS
Property tax history
+90.4%/yrLatest (2025): $4,246 · +2.4% YoY. Source: county tax records.
Cash-flow waterfall
monthlySold comps — $/sqft
last 12 mo · ≤1 miLoading sold comps…