 Duplex
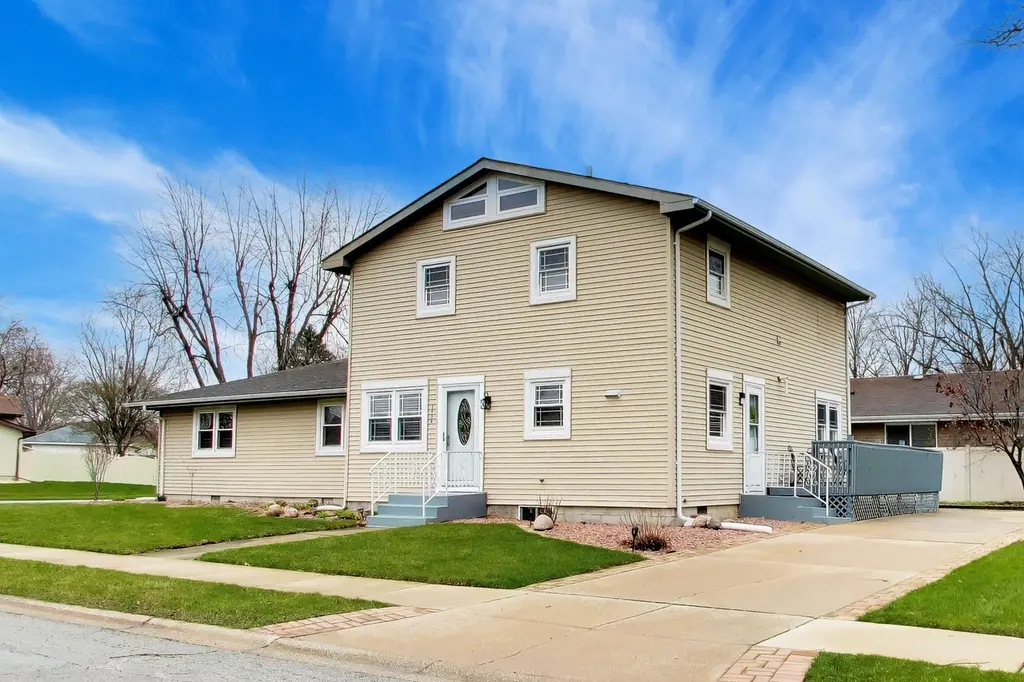
1936-1938 Patti Ln · Schererville, IN
Flood risk 1/10 · Minimal
- FEMA flood zone
- X (unshaded)
- Chance of flooding over 30 yrs
- 0.0%
- Est. flood insurance / yr
- $507 – $1,088
Fire risk 1/10 · Minimal
- Est. fire insurance / yr
- $717 – $1,331
Heat risk 3/10 · Minor
- Hot days now (above 101°F)
- 7 days/yr
- Hot days in 30 yrs
- 15 days/yr
Wind risk 2/10 · Minimal
- Chance of severe wind over 30 yrs
- 0.0%
Air-quality risk 3/10 · Minor
- Unhealthy air days now
- 2 days/yr
- Unhealthy air days in 30 yrs
- 3 days/yr
Risk factors via First Street. Map © Google.
Why this score? — see what drove the D- grade
The composite is a weighted blend of 9 inputs, each scored 0–100. Each bar is that input's sub-score; the figure is the points it added to the 100-point composite (weight × sub-score).
- Cash flow +10.5/30.0
- ARV discount +7.5/15.0
- Schools +4.5/10.0
- Livability +3.4/5.0
- DSCR +3.0/10.0
- Rent growth +2.5/5.0
- Condition / age +2.5/5.0
- 1% rule +2.3/10.0
- Appreciation +0.0/10.0
$397,000
🖨 Deal sheet (PDF) 📄 Offer letter ✓ Due diligence
Multi-family units
County records classify this as Multi-Family (2-4 Unit). Listing-text estimate: 2 units. confirmed
Listing remarks
Exceptional investment opportunity in a prime Schererville location near schools, a community park, and local amenities. This well-maintained duplex offers flexibility for an owner occupant or investor, with one unit currently owner-occupied and the other tenant occupied. Unit 1936 is a 2-bedroom, 1-bath ranch featuring an updated eat-in kitchen and living room. The tenant pays all utilities, providing a low maintenance income stream. Unit 1938 is a spacious 3-bedroom, 2.5-bath two-story home with an updated eat-in kitchen, living room, formal dining room, and family room. The main floor includes a laundry area and full bath. The upper level offers a primary bedroom with an ensuite bath and
Key facts
- 0.33 acre lot
- 2 garage spots
- Built 1977
Tags
Neighborhood map
What this means for you Summary
Snapshot
- This is a 1×2bd/1ba + 1×3bd/2.5ba units multifamily listed at $397k.
Deal economics
- At list price, monthly cash flow is $-202 ($-2k/yr) — negative. Per door: $-101/mo.
- To cash-flow at today's rent, offer at most $361k (9.0% below list).
- To meet the 1% rule (rent ≥ 1% of price), the offer needs to be $288k (27.4% below list).
- Recommended offer: $288k (27.4% below list) — sets the bar for 1% rule.
- Cap rate 5.7% vs local median 4.0% in Schererville — top-decile yield for the area; either an underpriced asset or a hidden risk that comps aren't pricing in. Stress-test before assuming the spread holds.
Location & tenants
- Location reads 68/100 on livability (#226 in IN) — a middle-class / working-renter tenant base. Strengths: cost of living A+, housing A+, crime A; Watch: amenities F, commute F, health & safety F.
- Lake Central School Corporation (suburban): math 45% / reading 54% proficiency, ranked #41 of 301 in IN (top 14%) — families likely to look elsewhere, expect single-tenant / working-renter base with shorter leases; only 15% free/reduced lunch — higher-income household profile.
- Zoned schools: Lake Central High School (math 46% / reading 74%, grade C+, #46 of 369 statewide, top 13%, 3,069 students, 23% FRL).
- Market conditions: 165 active listings in the ZIP; 7 comparable units currently listed for rent nearby; rentals leasing fast (median 9d on market — plan ~1-2 weeks tenant-placement turnaround); solid renter incomes; 1,642 units permitted in Lake County in 2024 (14 in 5+ unit buildings).
- This rent runs 37% of the median local income ($93k/yr) — at the standard rent-burdened threshold; future hikes will face affordability resistance.
Forward outlook
- Local home prices are declining (-3.0%/yr); year-one equity from $3k of loan paydown is wiped out by about $12k of value loss. Plan a longer hold.
- Lake County population projected to shrink 7% by 2050 — rents likely to lag national; underwrite the cash flow, not the appreciation.
Negotiation context
- Only 4 days on market — expect competitive offers; lowballing is unlikely to land.
Questions for the listing agent
- What do current leases actually rent for vs. the listed asking? Can we see a recent rent roll and the last 12 months of T-12 income?
- Can we see the unit-by-unit rent roll, current vacancy, and any below-market leases? What's the average tenancy length?
- What capital expenditures (roof, boiler, parking lot, exteriors) have been made in the last 5 years, and what's planned in the next 2?
- Built in 1977 — when were the roof, HVAC, electrical panel, plumbing, and water heater last replaced?
- Is there a deadline driving the sale (1031 exchange, divorce, estate, relocation)? That informs how much negotiation room exists.
- Schools are B-rated — typically a magnet for longer-tenancy family renters. What's the average tenant stay here, and is there a school-zone premium baked into asking?
- The area grade is low — what's the realistic commute time and amenity access for the typical tenant pool here? Any planned neighborhood developments (good or bad) we should know about?
- What's the average days-on-market for RENTAL listings here right now (not sales)? A rising rental-DOM trend means longer vacancies and softer asking-rent achievability than the comps imply.
- What's the recent tenant-quality profile in this submarket — average credit score on applications, eviction rate, late-payment / NSF rate, and stable-employment percentage? A property-management company in the area should have these aggregated.
- How much new apartment / multifamily construction is in the pipeline within 1–3 miles? Heavy new supply (>2% of stock underway) typically softens rents 12–24 months out; light construction supports rent growth.
Investment metrics
- 1% rule
- 0.73% ✗
- Cap rate
- 5.68%
- Cash-on-cash
- -2.18%
- DSCR
- 0.90
- GRM
- 11.5
CMA / ARV
No comps found within radius.
Projected returns pro-forma
-3.0% appreciation · 3.0% rent growth · sell at horizon
- IRR
- -19.9%
- Equity multiple
- 0.30×
- Total profit
- $-77,290
- Equity at exit
- $59,194
- IRR
- -13.0%
- Equity multiple
- 0.24×
- Total profit
- $-84,321
- Equity at exit
- $34,325
Cash invested: $111,160 (down + closing). Projections, not guarantees.
Landlord ↔ Tenant lean methodology
- Overall (STATE)
- 90 Strongly Landlord-Friendly
- State Indiana
- 90 Strongly Landlord-Friendly · R+11
- County
- — inherits STATE
- City
- — inherits STATE
ZIP-level market 46375
- Active inventory
- 165
- Price-to-rent
- 24.8×
Monthly cashflow live
- Estimated rent
- $2,882 medium interval (Pro) →
- Mortgage (P&I)
- −$2,082
- Tax from tax record
- −$231 /mo · $2,773/yr
- Insurance
- −$165
- HOA
- −$0
- Vacancy / Maint / Mgmt
- −$605
- Net cashflow
- $-202
Break-even live
Sensitivity live
| Price | -10% $23 | -5% $-89 | +0% $-202 | +5% $-314 | +10% $-426 |
|---|---|---|---|---|---|
| Rent | -10% $-429 | -5% $-315 | +0% $-202 | +5% $-88 | +10% $26 |
| Rate | -1.0pp $-2 | -0.5pp $-101 | base $-202 | +0.5pp $-304 | +1.0pp $-409 |
2-unit breakdown (identical units grouped — click to expand)
| Units | Beds | Baths | Est. rent |
|---|---|---|---|
| 1× unit | 2 | 1 | $1,333 |
| 1× unit | 3 | 2.5 | $1,549 |
| Total (2 units) | $2,882 | ||
UW: 25.0% down · 7.5% · 30yr · 1.5% tax · 5.0% vac · 8.0% maint · 8.0% mgmt
Financing live
Cash to close
- Down payment
- $99,250
- Closing costs
- $11,910
- Reserves months
- —
- Total cash needed
- —
Loan-product check · same deal, 3 products live
Conventional
25% down · 7.5% · 30yr
- Down + closing
- —
- Monthly P&I
- —
- Monthly cashflow
- —
- DSCR
- —
- Eligible?
- —
Personal DTI + credit; lowest rate.
DSCR
20% down · 8.5% · 30yr
- Down + closing
- —
- Monthly P&I
- —
- Monthly cashflow
- —
- DSCR
- —
- Eligible?
- —
No personal income docs; deal must DSCR.
Hard money
10% down · 12.0% · 12mo
- Down + closing
- —
- Monthly P&I
- —
- Monthly cashflow
- —
- DSCR
- —
- Eligible?
- —
Short-term bridge; refi at stabilization.
Rent comps 7 comps
| Address | Beds | Baths | Sqft | Rent | $/sqft | DOM | Units | Dist |
|---|---|---|---|---|---|---|---|---|
| 1841 Austin Ave Schererville, IN | 1.0 | 1.0 | 540 | $1,025 | $1.90 | 0d | 1 | 0.52mi |
| 1825 Austin Ave Schererville, IN | 1.0 | 1.0 | 540 | $1,040 | $1.93 | 22d | 1 | 0.55mi |
| 1825 Austin Ave Schererville, IN | 2.0 | 1.0 | 875 | $1,235 | $1.41 | 5d | 1 | 0.55mi |
| 1825 Austin Ave Unit 16 Schererville, IN | 2.0 | 1.0 | 875 | $1,235 | $1.41 | 9d | 1 | 0.55mi |
| 1825 Austin Ave Unit 17 Schererville, IN | 1.0 | 1.0 | 540 | $1,040 | $1.93 | 26d | 1 | 0.55mi |
| 2615 Morningside Dr Crown Point, IN | 2.0 | 1.0 | 1000 | $1,475 | $1.48 | 5d | 1 | 1.48mi |
| 2615 Morningside Dr Unit A4 Crown Point, IN | 2.0 | 1.0 | 1000 | $1,475 | $1.48 | 26d | 1 | 1.48mi |
Listing history 2 events
-
2026-04-26status Pending
-
2026-04-22$397,000 Active
ⓘ Source: listings_history table (triggers on properties + properties_extension) + one-shot
backfill from property_details.listing_events for pre-trigger history.
Tax reassessment forecast IN · Partial reset (capped growth)
- Current annual tax
- $2,773 · $231/mo
- Projected year-2 tax
- $3,074 · $256/mo
- Expected delta
- +$301/yr (+$25/mo · 10.9%)
ⓘ Screening estimate from a state-policy table — verify with the county assessor before closing.
Climate risk First Street
- Flood 1/10 Low FEMA zone X (unshaded) · 0% chance over 30 yrs
- Wildfire 1/10 Low
- Heat 3/10 Moderate 7 d/yr ≥101°F today · 15 d/yr by 30 yrs out
- Wind 2/10 Low 0% chance of damaging wind over 30 yrs
- Air quality 3/10 Moderate 2 unhealthy d/yr today · 3 by 30 yrs out
Nearby sold comps map
Loading sold comps map…
Walkable amenities ~0.75 mi
Loading nearby amenities…
Taxation est. · year 1
- Rental income
- $34,584
- − Mortgage interest
- −$22,238
- − Property taxes
- −$2,773
- − Insurance
- −$1,985
- − Repairs & maintenance
- −$2,767
- − Management
- −$2,767
- − Depreciation
- −$11,549
- Taxable loss
- −$9,494
- Est. tax savings @ 24.0%
- +$2,279
- After-tax cash flow
- $-140/yr
For passive investors: Depreciation is non-cash, so a rental often shows a tax loss while cash-flowing — sheltering income. Rental losses are passive: they offset passive income freely, and up to $25,000/yr can offset ordinary (W-2) income if you actively participate and your MAGI is under $100k (phasing out to $0 by $150k); unused losses carry forward. On sale, claimed depreciation is recaptured at up to 25%, and gains may owe capital-gains tax (a 1031 exchange can defer both). Figures are a year-1 estimate at your 24.0% rate — not tax advice; consult a CPA.
Schools (NCES district)
- District
- Lake Central School Corporation
- NCES district ID
- 1805450
- Math proficiency
- 45% ▼ -9.00%
- Reading proficiency
- 54% ▼ -11.00%
- Median HH income
- $75,957
- Composite
- 44.82/100
- National rank
- #2736
- State rank
- #41 of 301 in IN
Livability — Schererville
- Score
- 68/100
- State rank
- #226
- US rank
- #9897
Category grades
Schools grade is shown separately in the Schools card above.
Census & demographics
- Census place
- Schererville, IN
- County
- Lake County · 422,878 people
- City population
- 24,188
- Metro
- Chicago-Naperville-Elgin, IL-IN-WI
- Population (ZIP)
- 24,188
- Household income
- $93,160
- Rent vs Own
- Severe rent burden
- 283.0
Population outlook (Lake County) Hauer SSP2
- Today (2025)
- 484,026 people
- By 2030
- 478,091 · -1.2%
- By 2040
- 462,974 · -4.3%
- By 2050
- 449,894 · -7.1%
- By 2075
- 436,169 · -9.9%
- By 2100
- 426,607 · -11.9%
Race, ethnicity, and origin ACS 2023
- Neighborhood character
- Predominantly White (72%)
- Race & ethnicity
- White 72% Hispanic / Latino 13% Two or more races 10% Black 7% Asian 4%
- Hispanic origin (detail)
- Mexican 11% Puerto Rican 1%
- Common ancestry
- Romanian 15% Iranian 4% Italian 1%
- Foreign-born
- 10% · Canada, Vietnam, South Korea
- Languages at home
- 85% English-only · Spanish 6% Russian/Polish/Slavic 5% Vietnamese 2%
Political lean MEDSL · Lake
- 2024 margin
- Lean D (+5.6) · D 52.1% · R 46.5% · Other 1.5%
- 2008→2024 swing
- -28.6pp toward R · 2008: 34.3pp · 2024: 5.6pp
- All cycles
- 2024: D+5.6 2020: D+15.1 2016: D+20.6 2012: D+31.0 2008: D+34.3
Not yet ingested
- Civics
- —
Market trends
- HPI YoY
- ▼ -172.42%
- Current HPI
- 204.9394
- Rent YoY
- —
- Metro
- Chicago-Naperville-Elgin, IL-IN-WI
- State GDP YoY
- ▲ 2.90%
- F500 in state
- 18
Industry mix (Fortune 500 HQ in IN)
| Industry | F500 HQs | Revenue |
|---|---|---|
| Industrial Machinery | 2 | $37B |
|
||
| Healthcare | 1 | $177B |
|
||
| Pharmaceuticals | 1 | $45B |
|
||
| Metals / Steel | 1 | $18B |
|
||
| Agriculture | 1 | $17B |
|
||
| Packaging | 1 | $12B |
|
||
Price history
2 events — show timeline
- 2026-04-26 Pending — NIRA MLS as Distributed by MLS Grid
- 2026-04-22 Listed $397,000 NIRA MLS as Distributed by MLS Grid
Property tax history
+0.6%/yrLatest (2024): $2,773 · +2.7% YoY. Source: county tax records.
Cash-flow waterfall
monthlySold comps — $/sqft
last 12 mo · ≤1 miLoading sold comps…