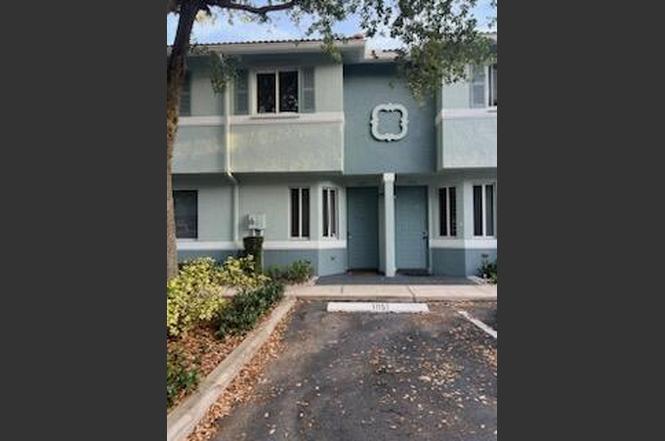
1951 Gardenia Ct · Riviera Beach, FL
Flood risk 1/10 · Minimal
- FEMA flood zone
- X (unshaded)
- Chance of flooding over 30 yrs
- 0.0%
- Est. flood insurance / yr
- $507 – $1,088
Fire risk 1/10 · Minimal
- Est. fire insurance / yr
- $947 – $1,759
Heat risk 9/10 · Severe
- Hot days now (above 106°F)
- 6 days/yr
- Hot days in 30 yrs
- 19 days/yr
Wind risk 10/10 · Severe
- Chance of severe wind over 30 yrs
- 99.0%
Air-quality risk 2/10 · Minimal
- Unhealthy air days now
- 0 days/yr
- Unhealthy air days in 30 yrs
- 1 days/yr
Risk factors via First Street. Map © Google.
Why this score? — see what drove the C+ grade
The composite is a weighted blend of 9 inputs, each scored 0–100. Each bar is that input's sub-score; the figure is the points it added to the 100-point composite (weight × sub-score).
- Cash flow +25.1/30.0
- 1% rule +10.0/10.0
- DSCR +8.2/10.0
- ARV discount +7.5/15.0
- Schools +4.3/10.0
- Livability +3.4/5.0
- Condition / age +2.5/5.0
- Rent growth +2.3/5.0
- Appreciation +0.0/10.0
$209,000
🖨 Deal sheet (PDF) 📄 Offer letter ✓ Due diligence
Listing remarks MLS
SEE BROKER REMARKS FOR SHOWING INSTRUCTIONS. LOVELY 2 BED 2.5 BATH TOWNHOUSE LOCATED IN RIVIERA BEACH. MAIN LIVING AREA ON LOWER LEVEL, BEDROOMS LOCATED UPSTAIRS. WASHER AND DRYER INCLUDED IN UNIT. 24 HOURS GATED COMMUNITY, POOL, CLUBHOUSE , FITNESS CENTER, TENNIS COURT & MORE! TENANT OCCUPIED UNTIL 05/31/2022 PAYING $1200/MONTH. INVESTORS ONLY!
Key facts
- Gated community
- Fitness center
- Clubhouse
Tags
Property features AI
Finance
- Other: Pets allowed (cats and dogs OK)
- HOA & community: Monthly HOA fee of $456; HOA includes insurance, grounds maintenance, sewer, trash, water and common areas; Community amenities: clubhouse, fitness center, pool, spa/hot tub, tennis courts, on-site management/manager
Exterior
- Parking: Assigned parking; Guest parking; Two total parking spaces
- Security: Gated community with guard; Smoke detectors
- Utilities: Public water; Public sewer; Water available
- Home design: Condominium; Resale condition; Faces east; 2 stories
- Construction: Built with CBS construction; Tile roof
- Exterior features: No waterfront
Interior
- Kitchen: Dishwasher; Electric range; Microwave; Refrigerator; Electric water heater
- Bedrooms: One main-level bedroom
- Flooring: Ceramic tile; Vinyl
- Bathrooms: Two full bathrooms; One half bathroom; One bathroom on the main level
- Heating & cooling: Central heating; Individual central heating; Central air conditioning; Individual central cooling
- Interior features: High ceilings; Closet cabinetry; Unfurnished
Neighborhood map
What this means for you Summary
Snapshot
- This is a 2-bed/2.5-bath condo listed at $209k.
Deal economics
- At list price, monthly cash flow is $464 ($6k/yr) — positive.
- The deal already cash-flows at list — no discount required.
- Meets the 1% rule at list price ($3k rent vs $209k).
Location & tenants
- Location reads 67/100 on livability (#581 in FL) — a middle-class / working-renter tenant base. Strengths: housing A+, health & safety A+, cost of living A-; Watch: employment D, crime F, amenities F.
- Palm Beach (suburban): math 46% / reading 53% proficiency, ranked #34 of 73 in FL (top 47%) — families likely to look elsewhere, expect single-tenant / working-renter base with shorter leases.
- Zoned schools: Washington Elementary Magnet School (math 42% / reading 37%, grade F, #1,513 of 2,144 statewide, top 73%, 253 students, 85% FRL); John F. Kennedy Middle School (math 28% / reading 29%, grade F, #482 of 571 statewide, top 85%, 826 students, 78% FRL); Palm Beach Gardens High School (math 19% / reading 40%, grade F, #447 of 667 statewide, top 68%, 2,570 students, 61% FRL) — zoned schools average 75% FRL vs 52% district-wide (23 pts higher); higher-poverty schools than district average — tighter screening recommended.
- Zoned-school proficiency averages 32% at this address vs 50% district-wide (-17 pts) — the specific schools serving this property underperform the Palm Beach average; the district grade overstates school quality for this exact location.
- Market conditions: Rents soft (-0.7%/yr); 506 active listings in the ZIP; 6 comparable units currently listed for rent nearby; rentals at typical pace (median 26d on market — plan ~3-4 weeks tenant-placement turnaround); 3,974 units permitted in Palm Beach County in 2024 (1,012 in 5+ unit buildings).
- At $3,169/mo this rent would consume 58% of the median local household income ($65k/yr) (locally 1838% of renters already pay >50% of income on rent) — very limited rent-growth headroom before tenants either downsize or default.
Forward outlook
- Local home prices are declining (-3.0%/yr); year-one equity from $1k of loan paydown is wiped out by about $6k of value loss. Plan a longer hold.
- Palm Beach County population projected at +30% by 2050 — long-run rental-demand tailwind backs the buy-and-hold thesis.
Negotiation context
- Only 5 days on market — expect competitive offers; lowballing is unlikely to land.
- 7 sale attempts since 7y ago with the ask held roughly flat each time — persistent listings suggest the price (not the market) is what's stuck; bring a comps-based counter.
- Current owner paid $166k; 26% above their basis — modest negotiation headroom, anchor on the comps not their cost.
Risks & watch-outs
- Climate carrying-cost: severe wind risk, 99% chance of damaging wind over 30y; extreme-heat days projected 6→19/yr by 2055 (HVAC capex compounding) — expect insurance premiums to compound above CPI over the hold.
Questions for the listing agent
- What does the HOA fee cover, when was the last increase, and are there any pending special assessments or reserve-fund shortfalls?
- Any open or pending special assessments — roof, HVAC, plumbing, elevator, façade? What's the per-unit balance and payoff schedule, and is the seller paying it off at close or rolling it to the buyer?
- Is there a deadline driving the sale (1031 exchange, divorce, estate, relocation)? That informs how much negotiation room exists.
- Crime grade is F in this area — have there been break-ins, vandalism, or insurance claims at this property in the last 3 years? What carrier currently insures it and at what premium?
- What's the average days-on-market for RENTAL listings here right now (not sales)? A rising rental-DOM trend means longer vacancies and softer asking-rent achievability than the comps imply.
- What's the recent tenant-quality profile in this submarket — average credit score on applications, eviction rate, late-payment / NSF rate, and stable-employment percentage? A property-management company in the area should have these aggregated.
- How much new apartment / multifamily construction is in the pipeline within 1–3 miles? Heavy new supply (>2% of stock underway) typically softens rents 12–24 months out; light construction supports rent growth.
Investment metrics
- 1% rule
- 1.52% ✓
- Cap rate
- 8.96%
- Cash-on-cash
- 9.51%
- DSCR
- 1.42
- GRM
- 5.5
CMA / ARV
No comps found within radius.
Projected returns pro-forma
-3.0% appreciation · 0.0% rent growth · sell at horizon
- IRR
- -6.3%
- Equity multiple
- 0.77×
- Total profit
- $-13,197
- Equity at exit
- $31,163
- IRR
- -2.4%
- Equity multiple
- 0.87×
- Total profit
- $-7,659
- Equity at exit
- $18,071
Cash invested: $58,520 (down + closing). Projections, not guarantees.
Landlord ↔ Tenant lean methodology
- Overall (STATE)
- 87 Strongly Landlord-Friendly
- State Florida
- 87 Strongly Landlord-Friendly · R+3
- County
- — inherits STATE
- City
- — inherits STATE
ZIP-level market 33404
- Home prices YoY
- -31.1%
- Rents YoY
- -0.7%
- Active inventory
- 506
- Price-to-rent
- 5.5×
Monthly cashflow live
- Estimated rent
- $3,169 high interval (Pro) →
- Mortgage (P&I)
- −$1,096
- Tax from tax record
- −$400 /mo · $4,804/yr
- Insurance
- −$87
- HOA
- −$456
- Vacancy / Maint / Mgmt
- −$665
- Net cashflow
- $464
Break-even live
Sensitivity live
| Price | -10% $582 | -5% $523 | +0% $464 | +5% $405 | +10% $346 |
|---|---|---|---|---|---|
| Rent | -10% $214 | -5% $339 | +0% $464 | +5% $589 | +10% $714 |
| Rate | -1.0pp $569 | -0.5pp $517 | base $464 | +0.5pp $410 | +1.0pp $355 |
UW: 25.0% down · 7.5% · 30yr · 1.5% tax · 5.0% vac · 8.0% maint · 8.0% mgmt
Financing live
Cash to close
- Down payment
- $52,250
- Closing costs
- $6,270
- Reserves months
- —
- Total cash needed
- —
Loan-product check · same deal, 3 products live
Conventional
25% down · 7.5% · 30yr
- Down + closing
- —
- Monthly P&I
- —
- Monthly cashflow
- —
- DSCR
- —
- Eligible?
- —
Personal DTI + credit; lowest rate.
DSCR
20% down · 8.5% · 30yr
- Down + closing
- —
- Monthly P&I
- —
- Monthly cashflow
- —
- DSCR
- —
- Eligible?
- —
No personal income docs; deal must DSCR.
Hard money
10% down · 12.0% · 12mo
- Down + closing
- —
- Monthly P&I
- —
- Monthly cashflow
- —
- DSCR
- —
- Eligible?
- —
Short-term bridge; refi at stabilization.
Rent comps 6 comps
| Address | Beds | Baths | Sqft | Rent | $/sqft | DOM | Units | Dist |
|---|---|---|---|---|---|---|---|---|
| 855 Date Palm Dr West Palm Beach, FL | 3.0 | 3.0 | 1216 | $3,150 | $2.59 | 26d | 1 | 0.92mi |
| 901 W 37th St Riviera Beach, FL | 3.0 | 1.0 | 900 | $2,895 | $3.22 | 26d | 1 | 1.01mi |
| 8731 Uranus Ter West Palm Beach, FL | 2.0 | 1.0 | 900 | $3,200 | $3.56 | 26d | 1 | 1.06mi |
| 321 Sandtree Dr Palm Beach Gardens, FL | 3.0 | 2.5 | 1480 | $3,000 | $2.03 | 12d | 1 | 1.11mi |
| 321 Sandtree Dr Palm Beach Gardens, FL | 3.0 | 2.5 | 1480 | $3,000 | $2.03 | 26d | 1 | 1.11mi |
| 520 W 28th St Riviera Beach, FL | 3.0 | 1.0 | 1296 | $6,000 | $4.63 | 4d | 1 | 1.39mi |
HOA detail condo
- Monthly dues
- $456 · $5,472/yr
- Likely covers
- poolgymsecurity
- Assessments
- None detected in remarks — confirm with the listing agent.
Listing history 4 events
-
2026-06-21days on market $209,000 Active 5 DOM
-
2026-06-18days on market $209,000 Active 2 DOM
-
2026-06-17remarks 235-char remark
-
2026-06-17$209,000 Active 1 DOM
ⓘ Source: listings_history table (triggers on properties + properties_extension) + one-shot
backfill from property_details.listing_events for pre-trigger history.
Tax reassessment forecast FL · Resets to sale price
- Current annual tax
- $4,804 · $400/mo
- Projected year-2 tax
- $4,804 · $400/mo
- Expected delta
- $0/yr ($0/mo · 0.0%)
ⓘ Screening estimate from a state-policy table — verify with the county assessor before closing.
Climate risk First Street
- Flood 1/10 Low FEMA zone X (unshaded) · 0% chance over 30 yrs
- Wildfire 1/10 Low
- Heat 9/10 Extreme 6 d/yr ≥106°F today · 19 d/yr by 30 yrs out
- Wind 10/10 Extreme 99% chance of damaging wind over 30 yrs
- Air quality 2/10 Low 0 unhealthy d/yr today · 1 by 30 yrs out
Nearby sold comps map
Loading sold comps map…
Walkable amenities ~0.75 mi
Loading nearby amenities…
Taxation est. · year 1
- Rental income
- $38,024
- − Mortgage interest
- −$11,707
- − Property taxes
- −$4,804
- − Insurance
- −$1,045
- − Repairs & maintenance
- −$3,042
- − Management
- −$3,042
- − HOA
- −$5,472
- − Depreciation
- −$6,080
- Taxable income
- $2,832
- Est. tax owed @ 24.0%
- −$680
- After-tax cash flow
- $4,886/yr
For passive investors: Depreciation is non-cash, so a rental often shows a tax loss while cash-flowing — sheltering income. Rental losses are passive: they offset passive income freely, and up to $25,000/yr can offset ordinary (W-2) income if you actively participate and your MAGI is under $100k (phasing out to $0 by $150k); unused losses carry forward. On sale, claimed depreciation is recaptured at up to 25%, and gains may owe capital-gains tax (a 1031 exchange can defer both). Figures are a year-1 estimate at your 24.0% rate — not tax advice; consult a CPA.
Schools (NCES district)
- District
- Palm Beach
- NCES district ID
- 1201500
- Math proficiency
- 46% ▼ -16.00%
- Reading proficiency
- 53% ▼ -4.00%
- Median HH income
- $53,943
- Composite
- 42.72/100
- National rank
- #3160
- State rank
- #34 of 73 in FL
Livability — Riviera Beach
- Score
- 67/100
- State rank
- #581
- US rank
- #11060
Category grades
Schools grade is shown separately in the Schools card above.
Census & demographics
- Census place
- Riviera Beach, FL
- County
- Palm Beach County · 1,438,312 people
- City population
- 30,912
- Metro
- Miami-Fort Lauderdale-Pompano Beach, FL
- Population (ZIP)
- 30,912
- Household income
- $65,063
- Rent vs Own
- Severe rent burden
- 1838.0
Population outlook (Palm Beach County) Hauer SSP2
- Today (2025)
- 1,637,487 people
- By 2030
- 1,743,255 · +6.5%
- By 2040
- 1,948,712 · +19.0%
- By 2050
- 2,132,979 · +30.3%
- By 2075
- 2,530,027 · +54.5%
- By 2100
- 2,706,979 · +65.3%
Race, ethnicity, and origin ACS 2023
- Neighborhood character
- Majority Black (64%)
- Race & ethnicity
- Black 64% White 22% Hispanic / Latino 9% Two or more races 8%
- Hispanic origin (detail)
- Mexican 1% Puerto Rican 1%
- Common ancestry
- Hispanic 8% Romanian 1% Italian 1%
- Foreign-born
- 21% · Canada, Jamaica
- Languages at home
- 82% English-only · Spanish 8% French/Haitian/Cajun 7% Other Indo-European 1%
Political lean MEDSL · Palm Beach
- 2024 margin
- Toss-up / Even · D 50.0% · R 49.2%
- 2008→2024 swing
- -22.1pp toward R · 2008: 22.9pp · 2024: 0.8pp
- All cycles
- 2024: D+0.8 2020: D+12.8 2016: D+15.3 2012: D+17.0 2008: D+22.9
Not yet ingested
- Civics
- —
Market trends
- HPI YoY
- ▼ -153.74%
- Current HPI
- 341.1761
- Rent YoY
- ▼ -0.72%
- Metro
- Miami-Fort Lauderdale-Pompano Beach, FL
- State GDP YoY
- ▲ 3.28%
- F500 in state
- 36
Industry mix (Fortune 500 HQ in FL)
| Industry | F500 HQs | Revenue |
|---|---|---|
| Industrial Technology | 2 | $29B |
|
||
| Insurance | 2 | $17B |
|
||
| Retail | 1 | $60B |
|
||
| Technology Distribution | 1 | $58B |
|
||
| Homebuilding | 1 | $35B |
|
||
| Technology Manufacturing | 1 | $35B |
|
||
Price history
-87.8% since first listed22 events — show timeline
- 2026-06-16 Listed $209,000 Beaches MLS
- 2023-06-22 Listing Removed — Beaches MLS
- 2023-06-16 Price Changed $259,900 Beaches MLS
- 2023-06-08 Rental Removed — RMLSFL
- 2023-06-05 Price Changed $269,900 Beaches MLS
- 2023-05-26 Listed $279,900 Beaches MLS
- 2022-01-14 Sold (Public Records) $166,000 Public Records
- 2022-01-14 Sold (MLS) $166,000 Beaches MLS
- 2021-09-29 Pending — Beaches MLS
- 2021-09-23 Price Changed $167,000 Beaches MLS
- 2021-09-23 Relisted — Beaches MLS
- 2021-02-15 Listed $132,000 Beaches MLS
- 2021-02-15 Listing Removed — Beaches MLS
- 2021-01-11 Listing Removed — Beaches MLS
- 2020-09-23 Listing Removed — Beaches MLS
- 2020-09-23 Listed $132,000 Beaches MLS
- 2020-02-25 Price Changed $132,000 Beaches MLS
- 2020-01-22 Listing Removed — Beaches MLS
- 2020-01-22 Listed $135,000 Beaches MLS
- 2019-06-25 Listed $135,000 Beaches MLS
- 2015-04-15 Sold (Public Records) $102,300 Public Records
- 2010-04-12 Sold (Public Records) $1,715,000 Public Records
Property tax history
+5.8%/yrLatest (2025): $4,804 · +5.3% YoY. Source: county tax records.
Cash-flow waterfall
monthlySold comps — $/sqft
last 12 mo · ≤1 miLoading sold comps…