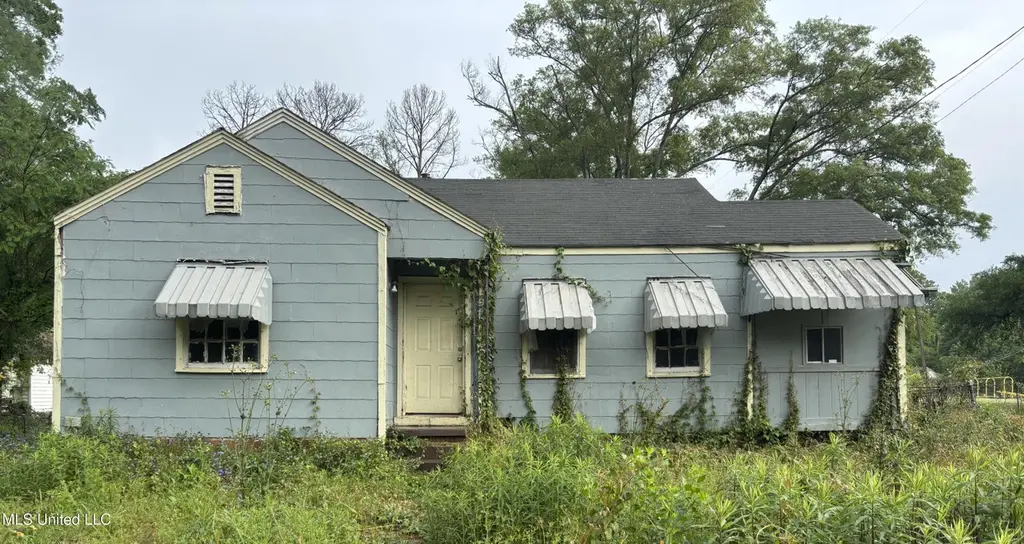
2602 Latimer Ave · Jackson, MS
Flood risk 1/10 · Minimal
- FEMA flood zone
- X (unshaded)
- Chance of flooding over 30 yrs
- 0.0%
- Est. flood insurance / yr
- $507 – $1,088
Fire risk 1/10 · Minimal
- Est. fire insurance / yr
- $1,241 – $2,305
Heat risk 7/10 · Major
- Hot days now (above 108°F)
- 7 days/yr
- Hot days in 30 yrs
- 18 days/yr
Wind risk 8/10 · Major
- Chance of severe wind over 30 yrs
- 80.0%
Air-quality risk 1/10 · Minimal
- Unhealthy air days now
- 0 days/yr
- Unhealthy air days in 30 yrs
- 0 days/yr
Risk factors via First Street. Map © Google.
Why this score? — see what drove the C grade
The composite is a weighted blend of 9 inputs, each scored 0–100. Each bar is that input's sub-score; the figure is the points it added to the 100-point composite (weight × sub-score).
- Cash flow +15.0/30.0
- ARV discount +15.0/15.0
- Appreciation +10.0/10.0
- 1% rule +5.0/10.0
- DSCR +5.0/10.0
- Livability +3.4/5.0
- Rent growth +2.5/5.0
- Condition / age +2.5/5.0
- Schools +1.1/10.0
$19,000
🖨 Deal sheet (PDF) 📄 Offer letter ✓ Due diligence
Listing remarks MLS
Great investment opportunity with a little TLC! This 3-bedroom, 2-bath home is close to schools and shopping. Schedule a showing today!
Key facts
- 0.23 acre lot
- Built 1947
- Listed 387 days
Neighborhood map
What this means for you Summary
Snapshot
- This is a 3-bed/1.0-bath single-family listed at $19k.
Deal economics
- At list price, monthly cash flow is $651 ($8k/yr) — positive.
- The deal already cash-flows at list — no discount required.
- Meets the 1% rule at list price ($1k rent vs $19k).
- Recommended offer: $17k (12.0% below list) — sets the bar for market timing.
- Cap rate 47.4% vs local median 9.9% in Jackson — top-decile yield for the area; either an underpriced asset or a hidden risk that comps aren't pricing in. Stress-test before assuming the spread holds.
Location & tenants
- Location reads 68/100 on livability (#66 in MS) — a middle-class / working-renter tenant base. Strengths: commute A+, cost of living A+, housing A+; Watch: amenities F, employment F, health & safety F.
- Jackson Public School District (urban): math 9% / reading 18% proficiency, ranked #112 of 130 in MS (top 86%) — low school quality limits family demand, transient renter base, plan for 1-2y turnover; 88% free/reduced lunch — lower-income household profile, screen leases tightly.
- Zoned schools: Pecan Park Elementary School (math 3% / reading 15%, grade F, #332 of 375 statewide, top 88%, 463 students, 100% FRL); Bailey Middle Apac School (math 46% / reading 62%, grade B-, #18 of 179 statewide, top 10%, 247 students, 100% FRL); Provine High School (math 4% / reading 15%, grade F, #179 of 197 statewide, top 92%, 774 students, 100% FRL).
- Market conditions: 165 active listings in the ZIP; 10 comparable units currently listed for rent nearby; rentals lingering (median 46d on market — plan ~5-8 weeks vacancy on turnover, expect pricing pressure); 60% of comp listings sitting > 30 days — soft ceiling on asking rent; lower-income renter base — watch delinquency; 167 units permitted in Hinds County in 2024 (0 in 5+ unit buildings).
- This rent runs 34% of the median local income ($36k/yr) — at the standard rent-burdened threshold; future hikes will face affordability resistance.
Forward outlook
- In year one you build about $2k of equity ($131 loan paydown + $2k appreciation (10.0% local appreciation)).
- Hinds County population projected to shrink 6% by 2050 — rents likely to lag national; underwrite the cash flow, not the appreciation.
- At projected returns (10.0% appreciation + 3.0% rent growth), your $5k cash investment doubles in ~1 year — after that, you're playing with house money.
Negotiation context
- It's been on market 387 days — a 12% lower offer ($17k) is reasonable based on typical stale-listing flexibility.
Risks & watch-outs
- Watch-outs: property tax is 3.2% of price; built in 1947 — expect roof / HVAC / electrical / plumbing capex.
- Climate carrying-cost: severe wind risk, 80% chance of damaging wind over 30y; extreme-heat days projected 7→18/yr by 2055 (HVAC capex compounding) — expect insurance premiums to compound above CPI over the hold.
Questions for the listing agent
- It's been on market 387 days. Have you received any prior offers? Is the seller open to a 12% concession, seller financing, or rate buy-down credit?
- Built in 1947 — when were the roof, HVAC, electrical panel, plumbing, and water heater last replaced?
- Property tax is high relative to price — has the assessment been appealed recently, and will the sale trigger a re-assessment?
- Why hasn't it sold? Are there any deal-killer items the seller is aware of (foundation, flood, title, zoning, code violations)?
- Is there a deadline driving the sale (1031 exchange, divorce, estate, relocation)? That informs how much negotiation room exists.
- Schools are F-rated, which usually means shorter tenancies and higher turnover. Who's the typical renter profile here, and what's been the actual vacancy rate?
- What's the average days-on-market for RENTAL listings here right now (not sales)? A rising rental-DOM trend means longer vacancies and softer asking-rent achievability than the comps imply.
- What's the recent tenant-quality profile in this submarket — average credit score on applications, eviction rate, late-payment / NSF rate, and stable-employment percentage? A property-management company in the area should have these aggregated.
- How much new for-sale + rental construction is in the pipeline within 1–3 miles? Heavy new supply typically softens prices + rents 12–24 months out; constrained supply supports both.
Investment metrics
- 1% rule
- 5.40% ✓
- Cap rate
- 47.40%
- Cash-on-cash
- 146.81%
- DSCR
- 7.53
- GRM
- 1.5
CMA / ARV
- ARV (median comp)
- $29,663
- List price
- $19,000
- Delta
- -35.95%
- Verdict
- UNDERPRICED
- Comps
- 20 within 1.0 mi
Show comp detail 9 sales within ~0.75 mi
| Address | Dist | Beds/Ba | Sqft | Sold | Price | $/sf | Match |
|---|---|---|---|---|---|---|---|
| 409 Houston Ave | 0.09mi | 3/2.0 | 988 (0%) | 8mo | $25,000 | $25 | 85 |
| 2629 Latimer Ave | 0.05mi | 3/1.0 | 1,063 (+8%) | 3mo | $19,000 | $18 | 83 |
| 350 Houston Ave | 0.09mi | 3/1.0 | 1,064 (+8%) | 11mo | $29,000 | $27 | 74 |
| 269 O Ferrell Ave | 0.53mi | 3/1.0 | 1,036 (+5%) | 3mo | $22,000 | $21 | 64 |
| 227 Columbus St | 0.55mi | 3/1.0 | 1,008 (+2%) | 9mo | $35,500 | $35 | 63 |
| 220 Lemly Ave | 0.43mi | 3/1.5 | 1,036 (+5%) | 15mo | $66,800 | $64 | 58 |
| 423 Willaman St | 0.66mi | 2/1.0 (-1) | 919 (-7%) | 1mo | $32,000 | $35 | 52 |
| 173 Parkside Pl | 0.64mi | 2/1.0 (-1) | 896 (-9%) | 11mo | $17,000 | $19 | 40 |
| 207 Lindsey Dr | 0.74mi | 3/1.0 | 936 (-5%) | 22mo | $19,900 | $21 | 38 |
Match score weights: distance 35% · size 25% · config 20% · recency 20%. Top-matched comps best support the ARV.
Projected returns pro-forma
10.0% appreciation · 3.0% rent growth · sell at horizon
- IRR
- —
- Equity multiple
- 10.74×
- Total profit
- $51,835
- Equity at exit
- $17,117
- IRR
- —
- Equity multiple
- 23.58×
- Total profit
- $120,110
- Equity at exit
- $36,913
Cash invested: $5,320 (down + closing). Projections, not guarantees.
Landlord ↔ Tenant lean methodology
- Overall (STATE)
- 90 Strongly Landlord-Friendly
- State Mississippi
- 90 Strongly Landlord-Friendly · R+11
- County
- — inherits STATE
- City
- — inherits STATE
ZIP-level market 39209
- Home prices YoY
- 7.7%
- Active inventory
- 165
- Price-to-rent
- 1.5×
Monthly cashflow live
- Estimated rent
- $1,025 high interval (Pro) →
- Mortgage (P&I)
- −$100
- Tax from tax record
- −$51 /mo · $617/yr
- Insurance
- −$8
- HOA
- −$0
- Vacancy / Maint / Mgmt
- −$215
- Net cashflow
- $651
Break-even live
Sensitivity live
| Price | -10% $662 | -5% $656 | +0% $651 | +5% $645 | +10% $640 |
|---|---|---|---|---|---|
| Rent | -10% $570 | -5% $610 | +0% $651 | +5% $691 | +10% $732 |
| Rate | -1.0pp $660 | -0.5pp $656 | base $651 | +0.5pp $646 | +1.0pp $641 |
UW: 25.0% down · 7.5% · 30yr · 1.5% tax · 5.0% vac · 8.0% maint · 8.0% mgmt
Financing live
Cash to close
- Down payment
- $4,750
- Closing costs
- $570
- Reserves months
- —
- Total cash needed
- —
Loan-product check · same deal, 3 products live
Conventional
25% down · 7.5% · 30yr
- Down + closing
- —
- Monthly P&I
- —
- Monthly cashflow
- —
- DSCR
- —
- Eligible?
- —
Personal DTI + credit; lowest rate.
DSCR
20% down · 8.5% · 30yr
- Down + closing
- —
- Monthly P&I
- —
- Monthly cashflow
- —
- DSCR
- —
- Eligible?
- —
No personal income docs; deal must DSCR.
Hard money
10% down · 12.0% · 12mo
- Down + closing
- —
- Monthly P&I
- —
- Monthly cashflow
- —
- DSCR
- —
- Eligible?
- —
Short-term bridge; refi at stabilization.
Rent comps 10 comps
| Address | Beds | Baths | Sqft | Rent | $/sqft | DOM | Units | Dist |
|---|---|---|---|---|---|---|---|---|
| 1818 Saint Charles St Jackson, MS | 3.0 | 1.0 | 983 | $995 | $1.01 | 45d | 1 | 0.58mi |
| 205 Lindsey Dr Jackson, MS | 2.0 | 1.0 | 676 | $850 | $1.26 | 45d | 1 | 0.76mi |
| 255 S Prentiss St Jackson, MS | 2.0 | 1.0 | 729 | $1,000 | $1.37 | 45d | 1 | 0.84mi |
| 1711 Robinson St Jackson, MS | 2.0 | 1.0 | 800 | $800 | $1.00 | 25d | 1 | 0.91mi |
| 4567 Meadowmont Dr Jackson, MS | 3.0 | 1.0 | 912 | $800 | $0.88 | 45d | 1 | 1.02mi |
| 723 Glenmont Dr Jackson, MS | 3.0 | 1.0 | 1018 | $1,000 | $0.98 | 45d | 1 | 1.05mi |
| 1240 Lawnview Pl Jackson, MS | 1.0–2.0 | 1.0 | 650 | $845 | $1.30 | 15d | 13 | 1.12mi |
| 1204 First Ave Jackson, MS | 2.0 | 1.0 | 800 | $725 | $0.91 | 25d | 1 | 1.17mi |
| 2157 Ludlow Ave Unit Na Jackson, MS | 3.0 | 2.0 | 1123 | $1,450 | $1.29 | 15d | 1 | 1.29mi |
| 2157 Ludlow Ave Jackson, MS | 3.0 | 2.0 | 1123 | $1,300 | $1.16 | 45d | 1 | 1.29mi |
Listing history 6 events
-
2026-05-31days on market $19,000 Active 387 DOM
-
2026-05-30days on market $19,000 Active 386 DOM
-
2025-09-08price $19,000 135-char remark
Show marketing remark (135 chars)
Great investment opportunity with a little TLC! This 3-bedroom, 2-bath home is close to schools and shopping. Schedule a showing today!
-
2025-05-09$25,000 Active 135-char remark
Show marketing remark (135 chars)
Great investment opportunity with a little TLC! This 3-bedroom, 2-bath home is close to schools and shopping. Schedule a showing today!
-
2004-09-01soldstatus
-
1964-11-11soldstatus
ⓘ Source: listings_history table (triggers on properties + properties_extension) + one-shot
backfill from property_details.listing_events for pre-trigger history.
Tax reassessment forecast MS · Resets to sale price
- Current annual tax
- $617 · $51/mo
- Projected year-2 tax
- $617 · $51/mo
- Expected delta
- $0/yr ($0/mo · 0.0%)
ⓘ Screening estimate from a state-policy table — verify with the county assessor before closing.
Climate risk First Street
- Flood 1/10 Low FEMA zone X (unshaded) · 0% chance over 30 yrs
- Wildfire 1/10 Low
- Heat 7/10 Severe 7 d/yr ≥108°F today · 18 d/yr by 30 yrs out
- Wind 8/10 Severe 80% chance of damaging wind over 30 yrs
- Air quality 1/10 Low 0 unhealthy d/yr today · 0 by 30 yrs out
Nearby sold comps map
Loading sold comps map…
Walkable amenities ~0.75 mi
Loading nearby amenities…
Taxation est. · year 1
- Rental income
- $12,301
- − Mortgage interest
- −$1,064
- − Property taxes
- −$617
- − Insurance
- −$95
- − Repairs & maintenance
- −$984
- − Management
- −$984
- − Depreciation
- −$553
- Taxable income
- $8,004
- Est. tax owed @ 24.0%
- −$1,921
- After-tax cash flow
- $5,889/yr
For passive investors: Depreciation is non-cash, so a rental often shows a tax loss while cash-flowing — sheltering income. Rental losses are passive: they offset passive income freely, and up to $25,000/yr can offset ordinary (W-2) income if you actively participate and your MAGI is under $100k (phasing out to $0 by $150k); unused losses carry forward. On sale, claimed depreciation is recaptured at up to 25%, and gains may owe capital-gains tax (a 1031 exchange can defer both). Figures are a year-1 estimate at your 24.0% rate — not tax advice; consult a CPA.
Schools (NCES district)
- District
- Jackson Public School District
- NCES district ID
- 2802190
- Math proficiency
- 9% ▼ -14.00%
- Reading proficiency
- 18% ▼ -7.00%
- Median HH income
- $33,234
- Composite
- 10.89/100
- National rank
- #9755
- State rank
- #112 of 130 in MS
Livability — Jackson
- Score
- 68/100
- State rank
- #66
- US rank
- #9695
Category grades
Schools grade is shown separately in the Schools card above.
Census & demographics
- Census place
- Jackson, MS
- County
- Hinds County · 167,040 people
- City population
- 140,204
- Metro
- Jackson, MS
- Population (ZIP)
- 25,776
- Household income
- $36,344
- Rent vs Own
- Severe rent burden
- 1627.0
Population outlook (Hinds County) Hauer SSP2
- Today (2025)
- 242,528 people
- By 2030
- 241,113 · -0.6%
- By 2040
- 235,557 · -2.9%
- By 2050
- 226,946 · -6.4%
- By 2075
- 199,995 · -17.5%
- By 2100
- 164,165 · -32.3%
Race, ethnicity, and origin ACS 2023
- Neighborhood character
- Predominantly Black (90%)
- Race & ethnicity
- Black 90% White 7% Two or more races 2% Hispanic / Latino 1%
- Foreign-born
- 1% · Canada
- Languages at home
- 98% English-only · Spanish 2%
Political lean MEDSL · Hinds
- 2024 margin
- Solid D (+46.1) · D 72.4% · R 26.3% · Other 1.4%
- 2008→2024 swing
- +7.1pp toward D · 2008: 39.0pp · 2024: 46.1pp
- All cycles
- 2024: D+46.1 2020: D+48.3 2016: D+43.7 2012: D+45.1 2008: D+39.0
Not yet ingested
- Civics
- —
Market trends
- HPI YoY
- ▲ 22.28%
- Current HPI
- 312.6754
- Rent YoY
- —
- Metro
- Jackson, MS
- State GDP YoY
- —
- F500 in state
- 0
Price history
-24.0% since first listed4 events — show timeline
- 2025-09-08 Price Changed $19,000 MLSU
- 2025-05-09 Listed $25,000 MLSU
- 2004-09-01 Sold (Public Records) — Public Records
- 1964-11-11 Sold (Public Records) — Public Records
Property tax history
-0.1%/yrLatest (2025): $617 · -0.3% YoY. Source: county tax records.
Cash-flow waterfall
monthlySold comps — $/sqft
last 12 mo · ≤1 miLoading sold comps…