1770 N Valley Dr #65 · Apache Junction, AZ
Flood risk 1/10 · Minimal
- FEMA flood zone
- X (shaded)
- Chance of flooding over 30 yrs
- 0.0%
- Est. flood insurance / yr
- $507 – $1,088
Fire risk 6/10 · Moderate
- Est. fire insurance / yr
- $610 – $1,132
Heat risk 8/10 · Major
- Hot days now (above 111°F)
- 6 days/yr
- Hot days in 30 yrs
- 16 days/yr
Wind risk 1/10 · Minimal
- Chance of severe wind over 30 yrs
- —
Air-quality risk 3/10 · Minor
- Unhealthy air days now
- 2 days/yr
- Unhealthy air days in 30 yrs
- 3 days/yr
Risk factors via First Street. Map © Google.
Why this score? — see what drove the B grade
The composite is a weighted blend of 9 inputs, each scored 0–100. Each bar is that input's sub-score; the figure is the points it added to the 100-point composite (weight × sub-score).
- Cash flow +30.0/30.0
- ARV discount +15.0/15.0
- 1% rule +10.0/10.0
- DSCR +10.0/10.0
- Livability +3.3/5.0
- Condition / age +2.2/5.0
- Rent growth +1.6/5.0
- Schools +1.5/10.0
- Appreciation +0.0/10.0
$39,999
🖨 Deal sheet 📄 Offer letter ✓ Due diligence
Key facts
- 1,300 sq ft lot
- 2 parking spots
- Community pool
Property features AI
Finance
- HOA & community: Land lease of $695 per month; Association fee includes: Other (see remarks); Community pool
Exterior
- Parking: 1 covered parking space; 1 open parking space; 1 carport space
- Utilities: Private sewer; Private water company
- Home design: Manufactured/mobile home (leasehold)
- Construction: Building area reported by owner
- Exterior features: Other construction materials; Other fencing; Other roof
Interior
- Bedrooms: Up to 2 bedrooms
- Bathrooms: 1 full bathroom
- Heating & cooling: Mini-split heating; Mini-split cooling
- Interior features: No interior laundry hookups reported
- Laundry & utility: No laundry features listed
Neighborhood map
What this means for you Summary
Snapshot
- This is a 2-bed/1.0-bath manufactured listed at $40k. Condition is rated fair.
Deal economics
- At list price, monthly cash flow is $958 ($11k/yr) — positive.
- The deal already cash-flows at list — no discount required.
- Meets the 1% rule at list price ($2k rent vs $40k).
- Recommended offer: $39k (3.0% below list) — sets the bar for market timing.
- Cap rate 35.0% vs local median 3.5% in Apache Junction — top-decile yield for the area; either an underpriced asset or a hidden risk that comps aren't pricing in. Stress-test before assuming the spread holds.
Location & tenants
- Location reads 66/100 on livability (#70 in AZ) — a middle-class / working-renter tenant base. Strengths: cost of living A+, housing A+; Watch: crime D+, amenities F, commute F.
- Apache Junction Unified District (4443) (suburban): math 15% / reading 20% proficiency, ranked #195 of 249 in AZ (top 78%) — low school quality limits family demand, transient renter base, plan for 1-2y turnover.
- Zoned schools: Desert Vista Elementary School (math 18% / reading 23%, grade F, #729 of 1,109 statewide, top 67%, 536 students, 50% FRL); Cactus Canyon Junior High (math 14% / reading 19%, grade F, #151 of 218 statewide, top 70%, 702 students, 50% FRL); Apache Junction High School (math 12% / reading 17%, grade F, #267 of 381 statewide, top 72%, 999 students, 48% FRL) — zoned schools at 49% FRL track the district average.
- Market conditions: Rents falling (-3.5%/yr); 455 active listings in the ZIP; 6 comparable units currently listed for rent nearby; rentals at typical pace (median 24d on market — plan ~3-4 weeks tenant-placement turnaround); 9,504 units permitted in Pinal County in 2024 (776 in 5+ unit buildings).
- This rent runs 32% of the median local income ($58k/yr) — at the standard rent-burdened threshold; future hikes will face affordability resistance.
Forward outlook
- Local home prices are declining (-3.0%/yr); year-one equity from $276 of loan paydown is wiped out by about $1k of value loss. Plan a longer hold.
- At projected returns (-3.0% appreciation + 0.0% rent growth), your $11k cash investment doubles in ~2 years — after that, you're playing with house money.
Negotiation context
- It's been on market 49 days — a 3% lower offer ($39k) is reasonable based on typical stale-listing flexibility.
Risks & watch-outs
- Climate carrying-cost: major wildfire risk; extreme-heat days projected 6→16/yr by 2055 (HVAC capex compounding) — expect insurance premiums to compound above CPI over the hold.
Questions for the listing agent
- It's been on market 49 days. Have you received any prior offers? Is the seller open to a 3% concession, seller financing, or rate buy-down credit?
- Have any recent inspections been done? Can we get a copy of the seller's disclosures and any deferred-maintenance estimates?
- Is there a deadline driving the sale (1031 exchange, divorce, estate, relocation)? That informs how much negotiation room exists.
- Schools are F-rated, which usually means shorter tenancies and higher turnover. Who's the typical renter profile here, and what's been the actual vacancy rate?
- Crime grade is D in this area — have there been break-ins, vandalism, or insurance claims at this property in the last 3 years? What carrier currently insures it and at what premium?
- What's the average days-on-market for RENTAL listings here right now (not sales)? A rising rental-DOM trend means longer vacancies and softer asking-rent achievability than the comps imply.
- What's the recent tenant-quality profile in this submarket — average credit score on applications, eviction rate, late-payment / NSF rate, and stable-employment percentage? A property-management company in the area should have these aggregated.
- How much new for-sale + rental construction is in the pipeline within 1–3 miles? Heavy new supply typically softens prices + rents 12–24 months out; constrained supply supports both.
Investment metrics
- 1% rule
- 3.91% ✓
- Cap rate
- 35.03%
- Cash-on-cash
- 102.64%
- DSCR
- 5.57
- GRM
- 2.1
CMA / ARV
- ARV (on-the-fly)
- $56,448
- Comps found
- 12
Show comp detail 12 sales within ~0.75 mi
| Address | Dist | Beds/Ba | Sqft | Sold | Price | $/sf | Match |
|---|---|---|---|---|---|---|---|
| 1784 N Main Dr | 0.44mi | 2/1.0 | 833 (-7%) | 4mo | $249,995 | $300 | 64 |
| 2292 N Ironwood Dr #55 | 0.41mi | 2/2.0 | 960 (+7%) | 3mo | $57,000 | $59 | 62 |
| 2292 N Ironwood Dr #110 | 0.41mi | 3/2.0 (+1) | 960 (+7%) | 0mo | $67,000 | $70 | 60 |
| 2292 N Ironwood Dr #56 | 0.42mi | 3/2.0 (+1) | 960 (+7%) | 2mo | $59,000 | $61 | 58 |
| 2292 N Ironwood Dr #78 | 0.41mi | 3/2.0 (+1) | 960 (+7%) | 4mo | $60,000 | $63 | 57 |
| 2292 N Ironwood Dr #103 | 0.32mi | 2/2.0 | 1,008 (+12%) | 5mo | $18,000 | $18 | 56 |
| 2292 N Ironwood Dr #3 | 0.32mi | 3/2.0 (+1) | 960 (+7%) | 11mo | $65,000 | $68 | 55 |
| 980 N Ironwood Dr #15 | 0.63mi | 2/1.0 | 975 (+9%) | 2mo | $77,900 | $80 | 54 |
| 900 N San Marcos Dr #95 | 0.64mi | 2/1.0 | 980 (+9%) | 4mo | $20,000 | $20 | 52 |
| 2292 N Ironwood Dr #84 | 0.41mi | 2/2.0 | 1,024 (+14%) | 3mo | $25,000 | $24 | 51 |
| 2292 N Ironwood Dr #34 | 0.32mi | 3/2.0 (+1) | 1,024 (+14%) | 5mo | $60,000 | $59 | 48 |
| 1363 N Plaza Dr #9 | 0.71mi | 2/2.0 | 1,027 (+15%) | 3mo | $135,000 | $131 | 36 |
Match score weights: distance 35% · size 25% · config 20% · recency 20%. Top-matched comps best support the ARV.
Projected returns pro-forma
-3.0% appreciation · 0.0% rent growth · sell at horizon
- IRR
- —
- Equity multiple
- 5.46×
- Total profit
- $49,975
- Equity at exit
- $5,964
- IRR
- —
- Equity multiple
- 10.33×
- Total profit
- $104,479
- Equity at exit
- $3,458
Cash invested: $11,200 (down + closing). Projections, not guarantees.
Landlord ↔ Tenant lean methodology
- Overall (STATE)
- 87 Strongly Landlord-Friendly
- State Arizona
- 87 Strongly Landlord-Friendly · R+3
- County
- — inherits STATE
- City
- — inherits STATE
ZIP-level market 85120
- Home prices YoY
- -29.0%
- Rents YoY
- -3.5%
- Active inventory
- 455
- Price-to-rent
- 2.1×
Monthly cashflow live
- Estimated rent
- $1,562 high interval (Pro) →
- Mortgage (P&I)
- −$210
- Tax est. 1.5%
- −$50 /mo · $600/yr
- Insurance
- −$17
- HOA
- −$0
- Vacancy / Maint / Mgmt
- −$328
- Net cashflow
- $958
Break-even live
UW: 25.0% down · 7.5% · 30yr · 1.5% tax · 5.0% vac · 8.0% maint · 8.0% mgmt
Financing live
Cash to close
- Down payment
- $10,000
- Closing costs
- $1,200
- Reserves months
- —
- Total cash needed
- —
Loan-product check · same deal, 3 products live
Conventional
25% down · 7.5% · 30yr
- Down + closing
- —
- Monthly P&I
- —
- Monthly cashflow
- —
- DSCR
- —
- Eligible?
- —
Personal DTI + credit; lowest rate.
DSCR
20% down · 8.5% · 30yr
- Down + closing
- —
- Monthly P&I
- —
- Monthly cashflow
- —
- DSCR
- —
- Eligible?
- —
No personal income docs; deal must DSCR.
Hard money
10% down · 12.0% · 12mo
- Down + closing
- —
- Monthly P&I
- —
- Monthly cashflow
- —
- DSCR
- —
- Eligible?
- —
Short-term bridge; refi at stabilization.
Rent comps 6 comps
| Address | Beds | Baths | Sqft | Rent | $/sqft | DOM | Units | Dist |
|---|---|---|---|---|---|---|---|---|
| 1440 N Idaho Rd Apache Junction, AZ | 1.0–2.0 | 1.0–1.5 | 1010 | $1,900 | $1.88 | 24d | 3 | 0.82mi |
| 2185 W Ohio St Apache Junction, AZ | 2.0 | 1.0 | 1000 | $1,295 | $1.29 | 4d | 1 | 1.00mi |
| 455 N Delaware Dr Unit 7 Apache Junction, AZ | 2.0 | 2.0 | 1060 | $1,900 | $1.79 | 24d | 1 | 1.09mi |
| 135 N Palo Verde Dr Apache Junction, AZ | 1.0 | 1.0 | 750 | $915 | $1.22 | 20d | 1 | 1.15mi |
| 135 N Palo Verde Dr Unit 8 Apache Junction, AZ | 1.0 | 1.0 | 750 | $925 | $1.23 | 24d | 1 | 1.15mi |
| 695 E Superstition Blvd Apache Junction, AZ | 1.0–3.0 | 1.0–2.0 | 983 | $1,860 | $1.89 | 2d | 13 | 1.43mi |
Listing history 14 events
-
2026-06-18days on market $39,999 Active 49 DOM
-
2026-06-17days on market $39,999 Active 48 DOM
-
2026-06-16days on market $39,999 Active 47 DOM
-
2026-06-15days on market $39,999 Active 46 DOM
-
2026-06-13days on market $39,999 Active 44 DOM
-
2026-06-09days on market $39,999 Active 40 DOM
-
2026-06-08days on market $39,999 Active 39 DOM
-
2026-06-07days on market $39,999 Active 38 DOM
-
2026-06-04days on market $39,999 Active 35 DOM
-
2026-06-03days on market $39,999 Active 34 DOM
-
2026-06-02days on market $39,999 Active 33 DOM
-
2026-06-01days on market $39,999 Active 32 DOM
-
2026-05-31days on market $39,999 Active 31 DOM
-
2026-04-29$39,999 Active
ⓘ Source: listings_history table (triggers on properties + properties_extension) + one-shot
backfill from property_details.listing_events for pre-trigger history.
Climate risk First Street
- Flood 1/10 Low FEMA zone X (shaded) · 0% chance over 30 yrs
- Wildfire 6/10 Major
- Heat 8/10 Severe 6 d/yr ≥111°F today · 16 d/yr by 30 yrs out
- Wind 1/10 Low
- Air quality 3/10 Moderate 2 unhealthy d/yr today · 3 by 30 yrs out
Nearby sold comps map
Loading sold comps map…
Walkable amenities ~0.75 mi
Loading nearby amenities…
Taxation est. · year 1
- Rental income
- $18,750
- − Mortgage interest
- −$2,241
- − Property taxes
- −$600
- − Insurance
- −$200
- − Repairs & maintenance
- −$1,500
- − Management
- −$1,500
- − Depreciation
- −$1,164
- Taxable income
- $11,546
- Est. tax owed @ 24.0%
- −$2,771
- After-tax cash flow
- $8,724/yr
For passive investors: Depreciation is non-cash, so a rental often shows a tax loss while cash-flowing — sheltering income. Rental losses are passive: they offset passive income freely, and up to $25,000/yr can offset ordinary (W-2) income if you actively participate and your MAGI is under $100k (phasing out to $0 by $150k); unused losses carry forward. On sale, claimed depreciation is recaptured at up to 25%, and gains may owe capital-gains tax (a 1031 exchange can defer both). Figures are a year-1 estimate at your 24.0% rate — not tax advice; consult a CPA.
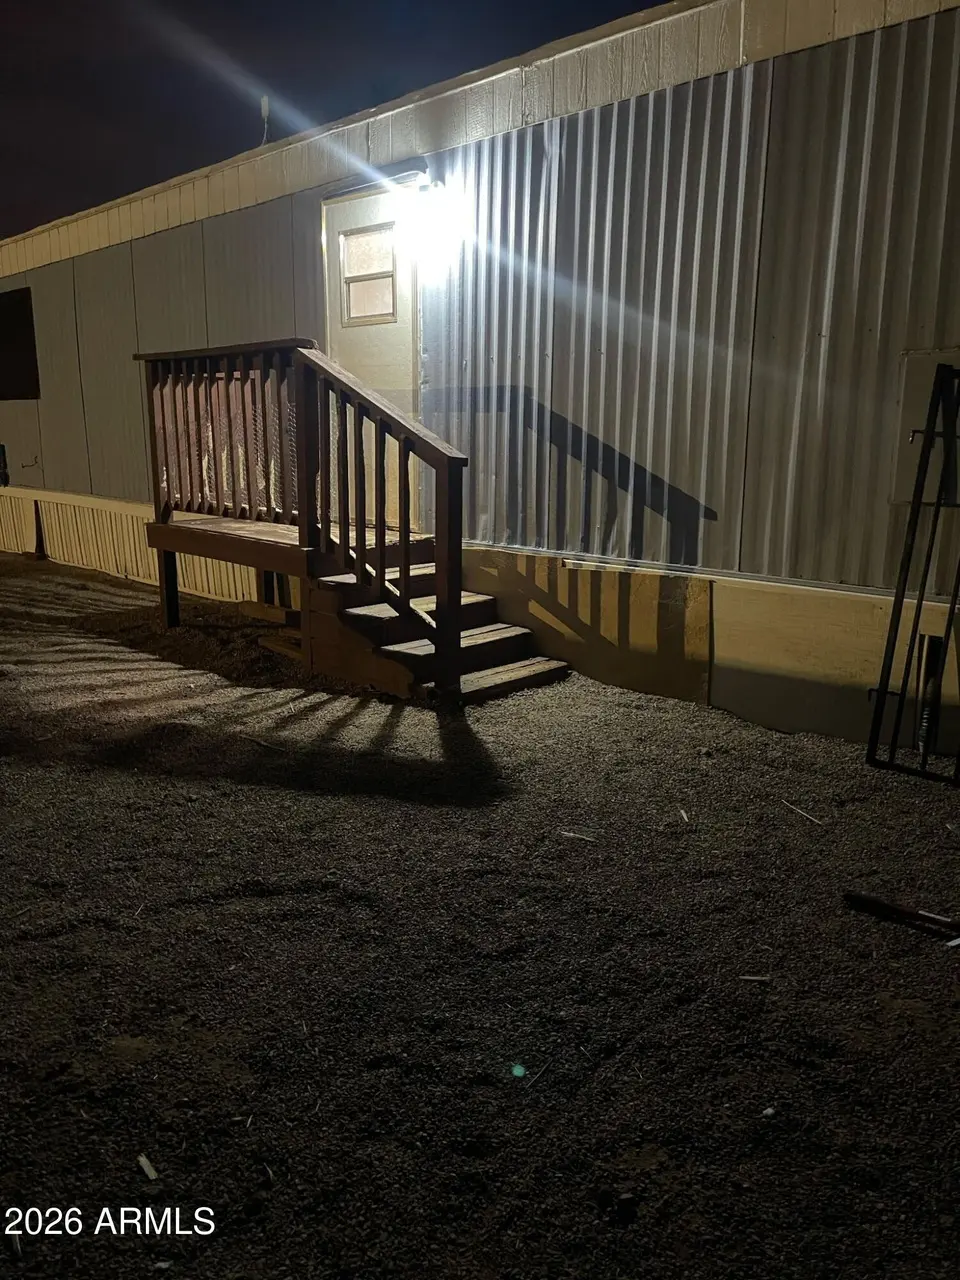
Condition & rehab AI · 6 photos
The property requires significant repairs and maintenance, particularly to the exterior and landscaping, to improve its condition and value.
Repairs flagged
- Major Exterior framing and siding — Exposed framing and potential structural issues.
- Major Flooring — Worn carpet, potential moisture damage.
- Major Landscaping — Overgrown yard, no landscaping features visible.
Value-add opportunities
- Both Paint interior walls — Enhances curb appeal and interior aesthetics.
- Both Replace carpet — Improves comfort and reduces maintenance costs.
- Both Landscaping and yard maintenance — Enhances curb appeal and property value.
- Both Replace exterior siding and framing — Fixes structural issues and improves property value.
- Both Replace HVAC system — Improves comfort and energy efficiency, reducing utility costs.
Renovation cost estimate screening
| Repair item | Severity | Est. cost |
|---|---|---|
| Exterior framing and siding · Exposed framing and potential structural issues. | Major | $15,000–50,000 |
| Flooring · Worn carpet, potential moisture damage. | Major | $15,000–50,000 |
| Landscaping · Overgrown yard, no landscaping features visible. | Major | $15,000–50,000 |
| Total estimated repair cost · 3 items | $45,000–150,000 |
Value-add ROI direction
- Both Paint interior walls — Enhances curb appeal and interior aesthetics. ↑
- Both Replace carpet — Improves comfort and reduces maintenance costs. ↑
- Both Landscaping and yard maintenance — Enhances curb appeal and property value. ↑
- Both Replace exterior siding and framing — Fixes structural issues and improves property value. ↑
- Both Replace HVAC system — Improves comfort and energy efficiency, reducing utility costs. ↑
ⓘ Cost ranges are severity-bucket heuristics (US national rule-of-thumb). Get contractor quotes + a written scope before underwriting a rehab budget.
Schools (NCES district)
- District
- Apache Junction Unified District (4443)
- NCES district ID
- 0400790
- Math proficiency
- 15% ▼ -17.00%
- Reading proficiency
- 20% ▼ -13.00%
- Median HH income
- $44,930
- Composite
- 15.34/100
- National rank
- #9325
- State rank
- #195 of 249 in AZ
Livability — Apache Junction
- Score
- 66/100
- State rank
- #70
- US rank
- #11242
Category grades
Schools grade is shown separately in the Schools card above.
Census & demographics
- Census place
- Apache Junction, AZ
- County
- Pinal County · 399,947 people
- City population
- 56,611
- Metro
- Phoenix-Mesa-Chandler, AZ
- Population (ZIP)
- 31,191
- Household income
- $57,786
- Rent vs Own
- Severe rent burden
- 686.0
Population outlook (Pinal County) Hauer SSP2
- Today (2025)
- 437,574 people
- By 2030
- 446,903 · +2.1%
- By 2040
- 452,589 · +3.4%
- By 2050
- 444,126 · +1.5%
- By 2075
- 430,300 · -1.7%
- By 2100
- 393,536 · -10.1%
Race, ethnicity, and origin ACS 2023
- Neighborhood character
- Predominantly White (77%)
- Race & ethnicity
- White 77% Hispanic / Latino 16% Two or more races 10% Asian 1%
- Hispanic origin (detail)
- Mexican 13%
- Common ancestry
- Romanian 3% Lithuanian 3% Portuguese 3%
- Foreign-born
- 7% · Canada
- Languages at home
- 89% English-only · Spanish 8% Tagalog/Filipino 1%
Political lean MEDSL · Pinal
- 2024 margin
- Strong R (+22.1) · D 38.5% · R 60.6%
- 2008→2024 swing
- -7.6pp toward R · 2008: -14.5pp · 2024: -22.1pp
- All cycles
- 2024: R+22.1 2020: R+17.3 2016: R+19.3 2012: R+17.1 2008: R+14.5
Not yet ingested
- Civics
- —
Market trends
- HPI YoY
- ▼ -128.31%
- Current HPI
- 313.4666
- Rent YoY
- ▼ -3.50%
- Metro
- Phoenix-Mesa-Chandler, AZ
- State GDP YoY
- ▲ 4.54%
- F500 in state
- 20
Industry mix (Fortune 500 HQ in AZ)
| Industry | F500 HQs | Revenue |
|---|---|---|
| Technology | 2 | $13B |
|
||
| Mining / Metals | 1 | $23B |
|
||
| Environmental Services | 1 | $16B |
|
||
| Metals / Steel | 1 | $14B |
|
||
| Technology Distribution | 1 | $9B |
|
||
| Homebuilding | 1 | $8B |
|
||
Price history
1 event — show timeline
- 2026-04-29 Listed $39,999 ARMLS
Cash-flow waterfall
monthlySold comps — $/sqft
last 12 mo · ≤1 miLoading sold comps…