 🌊 Lakefront
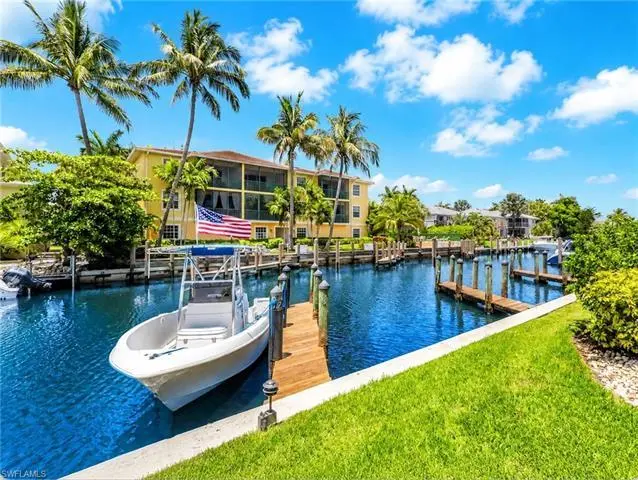
1533 Chesapeake Ave Unit A5 · Naples, FL
Flood risk 9/10 · Severe
- FEMA flood zone
- AE
- Chance of flooding over 30 yrs
- 0.99%
- Est. flood insurance / yr
- $1,737 – $8,500
Fire risk 1/10 · Minimal
- Est. fire insurance / yr
- $947 – $1,759
Heat risk 10/10 · Severe
- Hot days now (above 107°F)
- 7 days/yr
- Hot days in 30 yrs
- 26 days/yr
Wind risk 10/10 · Severe
- Chance of severe wind over 30 yrs
- 99.0%
Air-quality risk 3/10 · Minor
- Unhealthy air days now
- 3 days/yr
- Unhealthy air days in 30 yrs
- 3 days/yr
Risk factors via First Street. Map © Google.
Why this score? — see what drove the B- grade
The composite is a weighted blend of 9 inputs, each scored 0–100. Each bar is that input's sub-score; the figure is the points it added to the 100-point composite (weight × sub-score).
- Cash flow +22.9/30.0
- 1% rule +8.2/10.0
- ARV discount +7.5/15.0
- DSCR +7.4/10.0
- Appreciation +7.0/10.0
- Schools +5.0/10.0
- Rent growth +4.7/5.0
- Livability +4.0/5.0
- Condition / age +2.5/5.0
$415,000
🖨 Deal sheet 📄 Offer letter ✓ Due diligence
Listing remarks
Wake up to sparkling canal views, step aboard your boat just moments away, and spend the day cruising to the Gulf of Mexico—this is the Naples waterfront lifestyle you've been dreaming of. Perfectly positioned in one of Naples' most desirable boating communities, this beautifully customized TURNKEY residence offers the rare combination of Gulf-access boating, luxurious interior finishes, and an unbeatable location just minutes from Downtown Naples, 5th Avenue South, and the white-sand beaches of the Gulf Coast. Inside, the residence exudes warmth, character, and coastal sophistication. Rich hardwood flooring flows throughout the main living areas and bedrooms, creating an inviting amb
Key facts
- Vessel sinks
- Canal views
- Gulf access boating
Tags
Property features AI
Finance
- Other: Property is part of the CHESAPEAKE LANDINGS development; 12 units in complex; 6 units in building; 2 units per floor; single-story building; Section 10, Lot unit 5; Restrictions: Architectural, Deeded, No RV
- Financial info: Total annual recurring HOA fees listed; Total one-time HOA fees listed
- HOA & community: Mandatory homeowners association; Quarterly condominium fee; Condo fee: quarterly; Professional management; HOA covers insurance, irrigation water, lawn/land maintenance, legal/accounting, manager, exterior pest control, trash removal, and water; Community amenities include a community boat dock; Community type: boating community, non-gated
Exterior
- Parking: 1 assigned paved parking space
- Utilities: Central water; Central sewer; Cable available
- Home design: Residential end-unit; Low-rise building (1-3 stories); Built in 1973; Rear exposure faces north
- Construction: Concrete block construction; Stucco exterior; Built-up/flat and tile roofs; Property measures from Property Appraiser Office
- Exterior features: Canal frontage with canal view; Wooden dock included; Dock access for boating (Gulf access, no bridges); Paved road access; Zero lot line; Central irrigation
Interior
- Kitchen: Island; Pantry; Electric cooktop; Self-cleaning oven; Dishwasher; Disposal; Microwave; Refrigerator/ice maker
- Bedrooms: 2 bedrooms; Split bedroom floor plan
- Flooring: Tile; Wood
- Bathrooms: 2 full bathrooms; Master bath with combo tub and shower
- Heating & cooling: Central electric heat; Central electric air conditioning; Ceiling fans
- Interior features: Cable pre-wired; Closet cabinets; Custom mirrors; High-speed internet available; Pantry; Smoke detectors; Turnkey furnished; Family room; Guest room; Guest bath; Screened lanai/porch
- Laundry & utility: Washer and dryer in residence
Neighborhood map
What this means for you Summary
Snapshot
- This is a 2-bed/2.0-bath condo listed at $415k.
Deal economics
- At list price, monthly cash flow is $303 ($4k/yr) — positive.
- The deal already cash-flows at list — no discount required.
- Meets the 1% rule at list price ($5k rent vs $415k).
Location & tenants
- Location reads 80/100 on livability (#126 in FL, #1,903 nationally) — a professional / high-income tenant draw. Strengths: crime A+, amenities A+, employment A+; Watch: commute D+, cost of living F.
- Collier (suburban): math 60% / reading 56% proficiency, ranked #16 of 73 in FL (top 22%) — acceptable for families but not a draw, mixed tenant base, ~2y average lease.
- Market conditions: Rents rising fast (+8.8%/yr); 614 active listings in the ZIP; 40 comparable units currently listed for rent nearby; rentals at typical pace (median 23d on market — plan ~3-4 weeks tenant-placement turnaround); high-income renter base; 3,520 units permitted in Collier County in 2024 (959 in 5+ unit buildings).
- At $5,490/mo this rent would consume 50% of the median local household income ($131k/yr) (locally 333% of renters already pay >50% of income on rent) — very limited rent-growth headroom before tenants either downsize or default.
Forward outlook
- In year one you build about $20k of equity ($3k loan paydown + $17k appreciation (4.1% local appreciation)).
- Collier County population projected at +30% by 2050 — long-run rental-demand tailwind backs the buy-and-hold thesis.
- At projected returns (4.1% appreciation + 8.0% rent growth), your $116k cash investment doubles in ~4 years — after that, you're playing with house money.
- By year 2, paydown + projected appreciation supports a ~$32k cash-out refi (75% LTV) — recoverable capital for the next deal without selling this one.
Negotiation context
- Only 14 days on market — expect competitive offers; lowballing is unlikely to land.
- 5 sale attempts since 9y ago with the ask held roughly flat each time — persistent listings suggest the price (not the market) is what's stuck; bring a comps-based counter.
- Current owner paid $265k; list at $415k implies a 57% gain — meaningful room to come down on a strong offer.
Risks & watch-outs
- Watch-outs: flood insurance adds $427/mo.
- Climate carrying-cost: in FEMA flood zone AE (mandatory federal flood insurance); severe wind risk, 99% chance of damaging wind over 30y; extreme-heat days projected 7→26/yr by 2055 (HVAC capex compounding) — expect insurance premiums to compound above CPI over the hold.
Questions for the listing agent
- Built in 1973 — when were the roof, HVAC, electrical panel, plumbing, and water heater last replaced?
- What's the actual annual flood-insurance premium (NFIP or private), and is the property in a SFHA with mandatory coverage?
- What does the HOA fee cover, when was the last increase, and are there any pending special assessments or reserve-fund shortfalls?
- Any open or pending special assessments — roof, HVAC, plumbing, elevator, façade? What's the per-unit balance and payoff schedule, and is the seller paying it off at close or rolling it to the buyer?
- Is there a deadline driving the sale (1031 exchange, divorce, estate, relocation)? That informs how much negotiation room exists.
- Schools are B-rated — typically a magnet for longer-tenancy family renters. What's the average tenant stay here, and is there a school-zone premium baked into asking?
- This sits on a lake — are riparian / water-frontage rights deeded with the parcel? Any dock permits, shoreline easements, or HOA water-use restrictions?
- What's the documented flood / surge / shoreline-erosion history here (FEMA AND non-FEMA — e.g., storm surge, creek backup, septic-field saturation)?
- Any water-quality or seasonal algae-bloom issues that affect tenant satisfaction or short-term-rental demand?
- What's the average days-on-market for RENTAL listings here right now (not sales)? A rising rental-DOM trend means longer vacancies and softer asking-rent achievability than the comps imply.
- What's the recent tenant-quality profile in this submarket — average credit score on applications, eviction rate, late-payment / NSF rate, and stable-employment percentage? A property-management company in the area should have these aggregated.
- How much new apartment / multifamily construction is in the pipeline within 1–3 miles? Heavy new supply (>2% of stock underway) typically softens rents 12–24 months out; light construction supports rent growth.
Investment metrics
- 1% rule
- 1.32% ✓
- Cap rate
- 8.40%
- Cash-on-cash
- 7.54%
- DSCR
- 1.34
- GRM
- 6.3
CMA / ARV
No comps found within radius.
Projected returns pro-forma
4.08% appreciation · 8.0% rent growth · sell at horizon
- IRR
- 16.9%
- Equity multiple
- 2.06×
- Total profit
- $123,408
- Equity at exit
- $212,439
- IRR
- 20.8%
- Equity multiple
- 4.78×
- Total profit
- $438,800
- Equity at exit
- $349,090
Cash invested: $116,200 (down + closing). Projections, not guarantees.
Landlord ↔ Tenant lean methodology
- Overall (STATE)
- 87 Strongly Landlord-Friendly
- State Florida
- 87 Strongly Landlord-Friendly · R+3
- County
- — inherits STATE
- City
- — inherits STATE
ZIP-level market 34102
- Home prices YoY
- 1.3%
- Rents YoY
- 8.8%
- Active inventory
- 614
- Price-to-rent
- 6.3×
Monthly cashflow live
- Estimated rent
- $5,490 high interval (Pro) →
- Mortgage (P&I)
- −$2,176
- Tax from tax record
- −$310 /mo · $3,716/yr
- Insurance
- −$173
- Flood insurance flood zone
- −$427 /mo · $5,118/yr
- HOA
- −$948
- Vacancy / Maint / Mgmt
- −$1,153
- Net cashflow
- $303
Break-even live
UW: 25.0% down · 7.5% · 30yr · 1.5% tax · 5.0% vac · 8.0% maint · 8.0% mgmt
Financing live
Cash to close
- Down payment
- $103,750
- Closing costs
- $12,450
- Reserves months
- —
- Total cash needed
- —
Loan-product check · same deal, 3 products live
Conventional
25% down · 7.5% · 30yr
- Down + closing
- —
- Monthly P&I
- —
- Monthly cashflow
- —
- DSCR
- —
- Eligible?
- —
Personal DTI + credit; lowest rate.
DSCR
20% down · 8.5% · 30yr
- Down + closing
- —
- Monthly P&I
- —
- Monthly cashflow
- —
- DSCR
- —
- Eligible?
- —
No personal income docs; deal must DSCR.
Hard money
10% down · 12.0% · 12mo
- Down + closing
- —
- Monthly P&I
- —
- Monthly cashflow
- —
- DSCR
- —
- Eligible?
- —
Short-term bridge; refi at stabilization.
Rent comps 40 comps
| Address | Beds | Baths | Sqft | Rent | $/sqft | DOM | Units | Dist |
|---|---|---|---|---|---|---|---|---|
| 1501 Chesapeake Ave Unit 1296210P Naples, FL | 2.0 | 2.0 | 1377 | $4,110 | $2.98 | 13d | 1 | 0.04mi |
| 1535 Chesapeake Ave Unit A2 Naples, FL | 2.0 | 2.0 | 1080 | $2,000 | $1.85 | 23d | 1 | 0.05mi |
| 1376 Chesapeake Ave #2 Naples, FL | 2.0 | 2.0 | 1218 | $2,300 | $1.89 | 23d | 1 | 0.10mi |
| 1605 Chesapeake Ave #2 Naples, FL | 2.0 | 1.0 | 850 | $2,300 | $2.71 | 23d | 1 | 0.10mi |
| 1555 Blue Point Ave Unit 3 Naples, FL | 2.0 | 2.0 | 1025 | $1,745 | $1.70 | 13d | 1 | 0.11mi |
| 1186 Cherrystone Ct Naples, FL | 2.0 | 2.0 | 1163 | $1,995 | $1.72 | 23d | 1 | 0.12mi |
| 1625 Chesapeake Ave #203 Naples, FL | 2.0 | 2.0 | 1200 | $4,500 | $3.75 | 23d | 1 | 0.13mi |
| 1686 Blue Point Ave Unit B1 Naples, FL | 2.0 | 2.0 | 1198 | $6,500 | $5.43 | 23d | 1 | 0.14mi |
| 1686 Blue Point Ave Naples, FL | 2.0 | 2.0 | 1057 | $5,500 | $5.20 | 13d | 2 | 0.15mi |
| 1165 Clam Ct #7 Naples, FL | 2.0 | 2.5 | 1449 | $2,900 | $2.00 | 23d | 1 | 0.16mi |
| 1437 Sandpiper St Naples, FL | 3.0 | 2.0 | 1200 | $16,000 | $13.33 | 23d | 1 | 0.16mi |
| 1200 Cherrystone Ct Unit A203 Naples, FL | 2.0 | 2.0 | 1276 | $4,950 | $3.88 | 23d | 1 | 0.17mi |
| 1751 Smugglers Cv Unit 2 1 Naples, FL | 2.0 | 1.0 | 800 | $1,995 | $2.49 | 13d | 1 | 0.20mi |
| 1549 Sandpiper St #36 Naples, FL | 2.0 | 2.0 | 1073 | $2,195 | $2.05 | 23d | 1 | 0.20mi |
| 1120 Little Neck Ct Unit E40 Naples, FL | 3.0 | 2.0 | 1400 | $2,999 | $2.14 | 23d | 1 | 0.22mi |
| 1155 Sandpiper St Naples, FL | 2.0 | 2.0 | 1062 | $4,050 | $3.81 | 23d | 2 | 0.24mi |
| 1155 Sandpiper St Naples, FL | 2.0 | 2.0 | 1062 | $3,950 | $3.72 | 21d | 3 | 0.24mi |
| 1353 Pelican Ave Naples, FL | 2.0 | 2.0 | 1203 | $8,500 | $7.07 | 23d | 1 | 0.27mi |
| 1666 Osprey Ave #203 Naples, FL | 2.0 | 2.0 | 1200 | $7,000 | $5.83 | 23d | 1 | 0.30mi |
| 24 Rivard Rd Naples, FL | 3.0 | 2.0 | 1314 | $6,500 | $4.95 | 23d | 1 | 0.30mi |
| 105 Georgetown Blvd #105 Naples, FL | 2.0 | 2.0 | 1450 | $6,500 | $4.48 | 23d | 1 | 0.30mi |
| 12 Knights Bridge Rd Unit A32 Naples, FL | 2.0 | 2.0 | 1095 | $3,200 | $2.92 | 21d | 1 | 0.31mi |
| 9 Knights Bridge Rd #30 Naples, FL | 2.0 | 2.0 | 1296 | $3,000 | $2.31 | 13d | 1 | 0.33mi |
| 91 Georgetown Blvd #91 Naples, FL | 2.0 | 2.0 | 1450 | $7,000 | $4.83 | 23d | 1 | 0.34mi |
| 69 Georgetown Blvd #69 Naples, FL | 2.0 | 2.0 | 1450 | $5,500 | $3.79 | 23d | 1 | 0.34mi |
| 84 Georgetown Blvd #84 Naples, FL | 2.0 | 2.0 | 1450 | $5,500 | $3.79 | 23d | 1 | 0.36mi |
| 1501 Curlew Ave Naples, FL | 2.0 | 1.0 | 1180 | $2,000 | $1.69 | 23d | 1 | 0.40mi |
| 1435 Curlew Ave #1 Naples, FL | 2.0 | 2.0 | 975 | $2,850 | $2.92 | 21d | 1 | 0.41mi |
| 1435 Curlew Ave #1 Naples, FL | 2.0 | 2.0 | 975 | $2,850 | $2.92 | 23d | 1 | 0.41mi |
| 3001 Sandpiper Bay Cir Unit B106 Naples, FL | 2.0 | 2.0 | 1100 | $1,950 | $1.77 | 13d | 1 | 0.42mi |
| 1395 Curlew Ave Unit 4-3 Naples, FL | 2.0 | 2.0 | 975 | $7,000 | $7.18 | 23d | 1 | 0.42mi |
| 235 Lanchester Ct #42 Naples, FL | 2.0 | 2.0 | 1200 | $2,350 | $1.96 | 23d | 1 | 0.44mi |
| 3002 Sandpiper Bay Cir Unit A203 Naples, FL | 2.0 | 2.0 | 1200 | $2,200 | $1.83 | 23d | 1 | 0.45mi |
| 1950 Mayfair ST Unit 1021 Naples, FL | 1.0 | 1.0 | 710 | $3,520 | $4.96 | 13d | 1 | 0.45mi |
| 1950 Mayfair ST Unit 921 Naples, FL | 1.0 | 1.0 | 710 | $3,420 | $4.82 | 13d | 1 | 0.45mi |
| 1950 Mayfair ST Unit 901 Naples, FL | 2.0 | 2.0 | 1025 | $4,560 | $4.45 | 13d | 1 | 0.45mi |
| 1950 Mayfair ST Unit 716 Naples, FL | 1.0 | 1.0 | 710 | $3,330 | $4.69 | 13d | 1 | 0.45mi |
| 1950 Mayfair ST Unit 802 Naples, FL | 1.0 | 1.0 | 710 | $3,355 | $4.73 | 13d | 1 | 0.45mi |
| 1950 Mayfair ST Unit 1027 Naples, FL | 1.0 | 1.0 | 888 | $3,525 | $3.97 | 13d | 1 | 0.45mi |
| 1950 Mayfair ST Unit 817 Naples, FL | 1.0 | 1.0 | 710 | $3,295 | $4.64 | 13d | 1 | 0.45mi |
HOA detail condo
- Monthly dues
- $948 · $11,376/yr
- Likely covers
- water
- Assessments
- None detected in remarks — confirm with the listing agent.
Listing history 10 events
-
2026-06-18days on market $415,000 Active 14 DOM
-
2026-06-17days on market $415,000 Active 13 DOM
-
2026-06-16days on market $415,000 Active 12 DOM
-
2026-06-15days on market $415,000 Active 11 DOM
-
2026-06-14days on market $415,000 Active 9 DOM
-
2026-06-10days on market $415,000 Active 6 DOM
-
2026-06-09days on market $415,000 Active 5 DOM
-
2026-06-08days on market $415,000 Active 4 DOM
-
2026-06-07remarks 693-char remark
-
2026-06-07$415,000 Active 3 DOM
ⓘ Source: listings_history table (triggers on properties + properties_extension) + one-shot
backfill from property_details.listing_events for pre-trigger history.
Tax reassessment forecast FL · Resets to sale price
- Current annual tax
- $3,716 · $310/mo
- Projected year-2 tax
- $3,716 · $310/mo
- Expected delta
- $0/yr ($0/mo · 0.0%)
ⓘ Screening estimate from a state-policy table — verify with the county assessor before closing.
Climate risk First Street
- Flood 9/10 Extreme FEMA zone AE · 99% chance over 30 yrs
- Wildfire 1/10 Low
- Heat 10/10 Extreme 7 d/yr ≥107°F today · 26 d/yr by 30 yrs out
- Wind 10/10 Extreme 99% chance of damaging wind over 30 yrs
- Air quality 3/10 Moderate 3 unhealthy d/yr today · 3 by 30 yrs out
Nearby sold comps map
Loading sold comps map…
Walkable amenities ~0.75 mi
Loading nearby amenities…
Taxation est. · year 1
- Rental income
- $65,874
- − Mortgage interest
- −$23,246
- − Property taxes
- −$3,716
- − Insurance
- −$7,194
- − Repairs & maintenance
- −$5,270
- − Management
- −$5,270
- − HOA
- −$11,376
- − Depreciation
- −$12,073
- Taxable loss
- −$2,270
- Est. tax savings @ 24.0%
- +$545
- After-tax cash flow
- $4,185/yr
For passive investors: Depreciation is non-cash, so a rental often shows a tax loss while cash-flowing — sheltering income. Rental losses are passive: they offset passive income freely, and up to $25,000/yr can offset ordinary (W-2) income if you actively participate and your MAGI is under $100k (phasing out to $0 by $150k); unused losses carry forward. On sale, claimed depreciation is recaptured at up to 25%, and gains may owe capital-gains tax (a 1031 exchange can defer both). Figures are a year-1 estimate at your 24.0% rate — not tax advice; consult a CPA.
Schools (NCES district)
- District
- Collier
- NCES district ID
- 1200330
- Math proficiency
- 60% ▼ -4.00%
- Reading proficiency
- 56% ▼ -2.00%
- Median HH income
- $58,275
- Composite
- 50.23/100
- National rank
- #1892
- State rank
- #16 of 73 in FL
Livability — Naples
- Score
- 80/100
- State rank
- #126
- US rank
- #1903
Category grades
Schools grade is shown separately in the Schools card above.
Census & demographics
- Census place
- Naples, FL
- County
- Collier County · 396,295 people
- City population
- 344,941
- Metro
- Naples-Marco Island, FL
- Population (ZIP)
- 11,179
- Household income
- $130,929
- Rent vs Own
- Severe rent burden
- 333.0
Population outlook (Collier County) Hauer SSP2
- Today (2025)
- 420,858 people
- By 2030
- 450,054 · +6.9%
- By 2040
- 502,232 · +19.3%
- By 2050
- 544,932 · +29.5%
- By 2075
- 627,203 · +49.0%
- By 2100
- 659,015 · +56.6%
Race, ethnicity, and origin ACS 2023
- Neighborhood character
- Predominantly White (79%)
- Race & ethnicity
- White 79% Hispanic / Latino 9% Two or more races 8% Black 8% Asian 1%
- Hispanic origin (detail)
- Cuban 6%
- Common ancestry
- Hispanic 4% Lithuanian 4% Romanian 4%
- Foreign-born
- 17% · Canada, China
- Languages at home
- 87% English-only · Spanish 7% French/Haitian/Cajun 4% German/W. Germanic 1%
Political lean MEDSL · Collier
- 2024 margin
- Solid R (+33.1) · D 33.1% · R 66.2%
- 2008→2024 swing
- -10.6pp toward R · 2008: -22.5pp · 2024: -33.1pp
- All cycles
- 2024: R+33.1 2020: R+24.7 2016: R+26.0 2012: R+30.1 2008: R+22.5
Not yet ingested
- Civics
- —
Market trends
- HPI YoY
- ▲ 4.08%
- Current HPI
- 328.2755
- Rent YoY
- ▲ 8.75%
- Metro
- Naples-Marco Island, FL
- State GDP YoY
- ▲ 3.28%
- F500 in state
- 36
Industry mix (Fortune 500 HQ in FL)
| Industry | F500 HQs | Revenue |
|---|---|---|
| Industrial Technology | 2 | $29B |
|
||
| Insurance | 2 | $17B |
|
||
| Retail | 1 | $60B |
|
||
| Technology Distribution | 1 | $58B |
|
||
| Homebuilding | 1 | $35B |
|
||
| Technology Manufacturing | 1 | $35B |
|
||
Price history
+519.4% since first listed18 events — show timeline
- 2026-06-04 Listed $415,000 NAPLESMLS
- 2025-06-04 Listing Removed — NAPLESMLS
- 2025-04-02 Price Changed $425,000 NAPLESMLS
- 2025-02-10 Price Changed $448,500 NAPLESMLS
- 2025-01-03 Price Changed $475,000 NAPLESMLS
- 2024-12-10 Listed $499,900 NAPLESMLS
- 2018-02-25 Listing Removed — NAPLESMLS
- 2017-12-01 Listing Removed — NAPLESMLS
- 2017-12-01 Listed $310,000 NAPLESMLS
- 2017-10-06 Listed $310,000 NAPLESMLS
- 2017-02-20 Sold (Public Records) $265,000 Public Records
- 2017-02-17 Price Changed $265,000 NAPLESMLS
- 2017-02-16 Sold (MLS) $265,000 NAPLESMLS
- 2017-02-14 Price Changed $274,900 NAPLESMLS
- 2017-01-19 Pending — NAPLESMLS
- 2017-01-16 Listed $274,900 NAPLESMLS
- 1994-04-13 Sold (Public Records) $76,000 Public Records
- 1988-03-01 Sold (Public Records) $67,000 Public Records
Property tax history
+6.2%/yrLatest (2025): $3,716 · +4.1% YoY. Source: county tax records.
Cash-flow waterfall
monthlySold comps — $/sqft
last 12 mo · ≤1 miLoading sold comps…