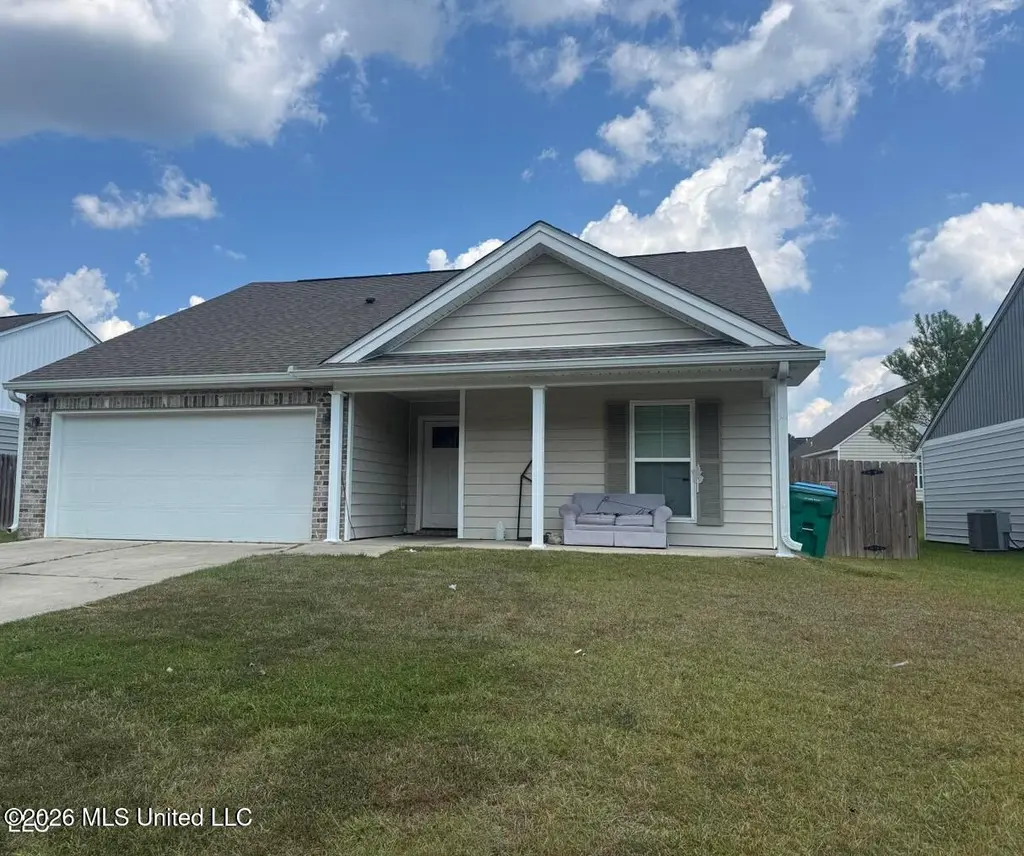
13254 Willow Oak Cir · Gulfport, MS
Flood risk 1/10 · Minimal
- FEMA flood zone
- X (unshaded)
- Chance of flooding over 30 yrs
- 0.0%
- Est. flood insurance / yr
- $507 – $1,088
Fire risk 4/10 · Minor
- Est. fire insurance / yr
- $1,241 – $2,305
Heat risk 10/10 · Severe
- Hot days now (above 107°F)
- 7 days/yr
- Hot days in 30 yrs
- 21 days/yr
Wind risk 9/10 · Severe
- Chance of severe wind over 30 yrs
- 99.0%
Air-quality risk 1/10 · Minimal
- Unhealthy air days now
- 0 days/yr
- Unhealthy air days in 30 yrs
- 0 days/yr
Risk factors via First Street. Map © Google.
Why this score? — see what drove the C- grade
The composite is a weighted blend of 9 inputs, each scored 0–100. Each bar is that input's sub-score; the figure is the points it added to the 100-point composite (weight × sub-score).
- Cash flow +16.8/30.0
- ARV discount +12.4/15.0
- DSCR +5.2/10.0
- Rent growth +4.2/5.0
- Schools +4.2/10.0
- 1% rule +3.8/10.0
- Livability +3.7/5.0
- Condition / age +2.5/5.0
- Appreciation +0.0/10.0
$199,999
🖨 Deal sheet 📄 Offer letter ✓ Due diligence
Listing remarks MLS
PRICED TO SELL! Make this home your own with a little paint and TLC. This home is in the popular Turtle Creek community, but only minutes from restaurants, shopping and entertainment. Originally built as an Elliot Homes model, this is a HANDY MAN SPECIAL or INVESTOR SPECIAL. This home is VACANT so Schedule your showing today!
Key facts
- 6,969 sq ft lot
- 2 garage spots
- Built 2019
Neighborhood map
What this means for you Summary
Snapshot
- This is a 3-bed/1.0-bath single-family listed at $200k.
Deal economics
- At list price, monthly cash flow is $127 ($2k/yr) — positive.
- The deal already cash-flows at list — no discount required.
- To meet the 1% rule (rent ≥ 1% of price), the offer needs to be $177k (11.6% below list).
- Recommended offer: $177k (11.6% below list) — sets the bar for 1% rule.
- Cap rate 7.1% vs local median 4.9% in Gulfport — top-decile yield for the area; either an underpriced asset or a hidden risk that comps aren't pricing in. Stress-test before assuming the spread holds.
Location & tenants
- Location reads 73/100 on livability (#15 in MS) — a middle-class / working-renter tenant base. Strengths: cost of living A+, housing A+, health & safety A+; Watch: schools D, amenities F, commute F.
- Harrison County School District (rural): math 52% / reading 46% proficiency, ranked #14 of 130 in MS (top 11%) — families likely to look elsewhere, expect single-tenant / working-renter base with shorter leases; 62% free/reduced lunch — lower-income household profile, screen leases tightly.
- Market conditions: Rents rising fast (+7.0%/yr); 763 active listings in the ZIP; 11 comparable units currently listed for rent nearby; rentals lingering (median 44d on market — plan ~5-8 weeks vacancy on turnover, expect pricing pressure); 82% of comp listings sitting > 30 days — soft ceiling on asking rent; 2,194 units permitted in Harrison County in 2024 (0 in 5+ unit buildings).
- This rent runs 34% of the median local income ($63k/yr) — at the standard rent-burdened threshold; future hikes will face affordability resistance.
Forward outlook
- Local home prices are declining (-3.0%/yr); year-one equity from $1k of loan paydown is wiped out by about $6k of value loss. Plan a longer hold.
- Harrison County population projected at +27% by 2050 — long-run rental-demand tailwind backs the buy-and-hold thesis.
Negotiation context
- It's been on market 90 days — a 6% lower offer ($188k) is reasonable based on typical stale-listing flexibility.
- 4 sale attempts since 7y ago with the ask held roughly flat each time — persistent listings suggest the price (not the market) is what's stuck; bring a comps-based counter.
- Current owner paid $158k; 27% above their basis — modest negotiation headroom, anchor on the comps not their cost.
Risks & watch-outs
- Climate carrying-cost: severe wind risk, 99% chance of damaging wind over 30y; extreme-heat days projected 7→21/yr by 2055 (HVAC capex compounding) — expect insurance premiums to compound above CPI over the hold.
Questions for the listing agent
- It's been on market 90 days. Have you received any prior offers? Is the seller open to a 12% concession, seller financing, or rate buy-down credit?
- What does the HOA fee cover, when was the last increase, and are there any pending special assessments or reserve-fund shortfalls?
- Why hasn't it sold? Are there any deal-killer items the seller is aware of (foundation, flood, title, zoning, code violations)?
- Is there a deadline driving the sale (1031 exchange, divorce, estate, relocation)? That informs how much negotiation room exists.
- Schools are D-rated, which usually means shorter tenancies and higher turnover. Who's the typical renter profile here, and what's been the actual vacancy rate?
- What's the average days-on-market for RENTAL listings here right now (not sales)? A rising rental-DOM trend means longer vacancies and softer asking-rent achievability than the comps imply.
- What's the recent tenant-quality profile in this submarket — average credit score on applications, eviction rate, late-payment / NSF rate, and stable-employment percentage? A property-management company in the area should have these aggregated.
- How much new for-sale + rental construction is in the pipeline within 1–3 miles? Heavy new supply typically softens prices + rents 12–24 months out; constrained supply supports both.
Investment metrics
- 1% rule
- 0.88% ✗
- Cap rate
- 7.05%
- Cash-on-cash
- 2.72%
- DSCR
- 1.12
- GRM
- 9.4
CMA / ARV
- ARV (median comp)
- $224,413
- List price
- $199,999
- Delta
- -10.88%
- Verdict
- UNDERPRICED
- Comps
- 20 within 1.0 mi
Show comp detail 12 sales within ~0.75 mi
| Address | Dist | Beds/Ba | Sqft | Sold | Price | $/sf | Match |
|---|---|---|---|---|---|---|---|
| 13276 Tortoise Trl | 0.08mi | 3/2.0 | 1,312 (-4%) | 1mo | $222,000 | $169 | 84 |
| 13292 Turtle Creek Pkwy | 0.22mi | 3/2.0 | 1,312 (-4%) | 4mo | $223,000 | $170 | 75 |
| 13395 Libby Ln | 0.23mi | 3/2.0 | 1,268 (-8%) | 4mo | $198,000 | $156 | 70 |
| 13102 Turtle Creek Pkwy | 0.35mi | 4/2.0 (+1) | 1,318 (-4%) | 2mo | $209,000 | $159 | 67 |
| 13136 Tracewood Dr | 0.52mi | 3/2.0 | 1,425 (+4%) | 1mo | $196,000 | $138 | 64 |
| 13148 Tracewood Dr | 0.50mi | 3/2.0 | 1,420 (+4%) | 4mo | $207,000 | $146 | 64 |
| 13691 Lawton Ln | 0.33mi | 3/2.0 | 1,220 (-11%) | 1mo | $205,000 | $168 | 62 |
| 14111 Sanctuary Trails Dr | 0.70mi | 3/2.0 | 1,388 (+1%) | 0mo | $248,900 | $179 | 61 |
| 14037 Sanctuary Trails Dr | 0.63mi | 3/2.0 | 1,348 (-2%) | 3mo | $249,900 | $185 | 61 |
| 13727 Churchwood Dr | 0.32mi | 3/2.0 | 1,237 (-10%) | 4mo | $219,900 | $178 | 61 |
| 14116 Sanctuary Trails Dr | 0.72mi | 3/2.0 | 1,398 (+2%) | 4mo | $227,900 | $163 | 56 |
| 13637 Lawton Ln | 0.40mi | 3/2.0 | 1,176 (-14%) | 2mo | $199,000 | $169 | 52 |
Match score weights: distance 35% · size 25% · config 20% · recency 20%. Top-matched comps best support the ARV.
Projected returns pro-forma
-3.0% appreciation · 6.99% rent growth · sell at horizon
- IRR
- -8.0%
- Equity multiple
- 0.70×
- Total profit
- $-16,999
- Equity at exit
- $29,821
- IRR
- 5.8%
- Equity multiple
- 1.51×
- Total profit
- $28,301
- Equity at exit
- $17,292
Cash invested: $56,000 (down + closing). Projections, not guarantees.
Landlord ↔ Tenant lean methodology
- Overall (STATE)
- 90 Strongly Landlord-Friendly
- State Mississippi
- 90 Strongly Landlord-Friendly · R+11
- County
- — inherits STATE
- City
- — inherits STATE
ZIP-level market 39503
- Home prices YoY
- -21.5%
- Rents YoY
- 7.0%
- Active inventory
- 763
- Price-to-rent
- 9.4×
Monthly cashflow live
- Estimated rent
- $1,767 high interval (Pro) →
- Mortgage (P&I)
- −$1,049
- Tax from tax record
- −$119 /mo · $1,432/yr
- Insurance
- −$83
- HOA
- −$18
- Vacancy / Maint / Mgmt
- −$371
- Net cashflow
- $127
Break-even live
UW: 25.0% down · 7.5% · 30yr · 1.5% tax · 5.0% vac · 8.0% maint · 8.0% mgmt
Financing live
Cash to close
- Down payment
- $50,000
- Closing costs
- $6,000
- Reserves months
- —
- Total cash needed
- —
Loan-product check · same deal, 3 products live
Conventional
25% down · 7.5% · 30yr
- Down + closing
- —
- Monthly P&I
- —
- Monthly cashflow
- —
- DSCR
- —
- Eligible?
- —
Personal DTI + credit; lowest rate.
DSCR
20% down · 8.5% · 30yr
- Down + closing
- —
- Monthly P&I
- —
- Monthly cashflow
- —
- DSCR
- —
- Eligible?
- —
No personal income docs; deal must DSCR.
Hard money
10% down · 12.0% · 12mo
- Down + closing
- —
- Monthly P&I
- —
- Monthly cashflow
- —
- DSCR
- —
- Eligible?
- —
Short-term bridge; refi at stabilization.
Rent comps 11 comps
| Address | Beds | Baths | Sqft | Rent | $/sqft | DOM | Units | Dist |
|---|---|---|---|---|---|---|---|---|
| 13444 Willow Oak Cir Gulfport, MS | 3.0 | 2.5 | 1679 | $1,750 | $1.04 | 43d | 1 | 0.15mi |
| 13145 Turtle Creek Pkwy Gulfport, MS | 3.0 | 2.5 | 1679 | $1,795 | $1.07 | 43d | 1 | 0.27mi |
| 13070 Tracewood Dr Gulfport, MS | 3.0 | 2.0 | 1190 | $1,400 | $1.18 | 21d | 1 | 0.55mi |
| 13463 Mary Ave Gulfport, MS | 3.0 | 2.0 | 1565 | $1,775 | $1.13 | 43d | 1 | 0.80mi |
| 13469 Mary Ave Gulfport, MS | 3.0 | 2.0 | 1565 | $1,800 | $1.15 | 43d | 1 | 0.80mi |
| 14179 Debra Barbee Ct Gulfport, MS | 3.0 | 2.0 | 1379 | $1,849 | $1.34 | 21d | 1 | 0.83mi |
| 12450 Three Rivers Rd Gulfport, MS | 3.0 | 2.0 | 1098 | $1,295 | $1.18 | 43d | 1 | 1.00mi |
| 13498 Dee Ave Gulfport, MS | 3.0 | 2.0 | 1410 | $1,750 | $1.24 | 43d | 1 | 1.04mi |
| 13727 Fox Hill Dr Gulfport, MS | 3.0 | 2.0 | 1388 | $1,800 | $1.30 | 43d | 1 | 1.04mi |
| 13459 Gorman St Gulfport, MS | 2.0 | 1.5 | 1000 | $1,649 | $1.65 | 43d | 1 | 1.06mi |
| 14180 Oneal Rd Gulfport, MS | 2.0 | 1.0 | 1000 | $1,100 | $1.10 | 43d | 2 | 1.23mi |
HOA detail
- Monthly dues
- $18 · $216/yr
Listing history 24 events
-
2026-06-18days on market $199,999 Active 90 DOM
-
2026-06-17days on market $199,999 Active 89 DOM
-
2026-06-16days on market $199,999 Active 88 DOM
-
2026-06-15days on market $199,999 Active 87 DOM
-
2026-06-14days on market $199,999 Active 85 DOM
-
2026-06-13days on market $199,999 Active 84 DOM
-
2026-06-10days on market $199,999 Active 82 DOM
-
2026-06-09days on market $199,999 Active 81 DOM
-
2026-06-08days on market $199,999 Active 80 DOM
-
2026-06-07days on market $199,999 Active 79 DOM
-
2026-06-02days on market $199,999 Active 74 DOM
-
2026-06-01days on market $199,999 Active 73 DOM
-
2026-05-31days on market $199,999 Active 72 DOM
-
2026-05-30days on market $199,999 Active 71 DOM
-
2026-03-20$199,999 Active 330-char remark
Show marketing remark (330 chars)
PRICED TO SELL! Make this home your own with a little paint and TLC. This home is in the popular Turtle Creek community, but only minutes from restaurants, shopping and entertainment. Originally built as an Elliot Homes model, this is a HANDY MAN SPECIAL or INVESTOR SPECIAL. This home is VACANT so Schedule your showing today!
-
2026-01-12historical
-
2025-09-19$205,000 Active
-
2022-03-08soldstatus
-
2022-03-04soldstatus Closed
-
2022-02-08status Pending
-
2022-01-30$195,000 Active
-
2019-11-05soldstatus $157,900
-
2019-10-31soldstatus
-
2019-05-20$157,900
ⓘ Source: listings_history table (triggers on properties + properties_extension) + one-shot
backfill from property_details.listing_events for pre-trigger history.
Tax reassessment forecast MS · Resets to sale price
- Current annual tax
- $1,432 · $119/mo
- Projected year-2 tax
- $1,580 · $132/mo
- Expected delta
- +$148/yr (+$12/mo · 10.3%)
ⓘ Screening estimate from a state-policy table — verify with the county assessor before closing.
Climate risk First Street
- Flood 1/10 Low FEMA zone X (unshaded) · 0% chance over 30 yrs
- Wildfire 4/10 Moderate
- Heat 10/10 Extreme 7 d/yr ≥107°F today · 21 d/yr by 30 yrs out
- Wind 9/10 Extreme 99% chance of damaging wind over 30 yrs
- Air quality 1/10 Low 0 unhealthy d/yr today · 0 by 30 yrs out
Nearby sold comps map
Loading sold comps map…
Walkable amenities ~0.75 mi
Loading nearby amenities…
Taxation est. · year 1
- Rental income
- $21,209
- − Mortgage interest
- −$11,203
- − Property taxes
- −$1,432
- − Insurance
- −$1,000
- − Repairs & maintenance
- −$1,697
- − Management
- −$1,697
- − HOA
- −$216
- − Depreciation
- −$5,818
- Taxable loss
- −$1,854
- Est. tax savings @ 24.0%
- +$445
- After-tax cash flow
- $1,966/yr
For passive investors: Depreciation is non-cash, so a rental often shows a tax loss while cash-flowing — sheltering income. Rental losses are passive: they offset passive income freely, and up to $25,000/yr can offset ordinary (W-2) income if you actively participate and your MAGI is under $100k (phasing out to $0 by $150k); unused losses carry forward. On sale, claimed depreciation is recaptured at up to 25%, and gains may owe capital-gains tax (a 1031 exchange can defer both). Figures are a year-1 estimate at your 24.0% rate — not tax advice; consult a CPA.
Schools (NCES district)
- District
- Harrison County School District
- NCES district ID
- 2801770
- Math proficiency
- 52% ▼ -4.00%
- Reading proficiency
- 46% ▼ -4.00%
- Median HH income
- $46,504
- Composite
- 41.66/100
- National rank
- #3419
- State rank
- #14 of 130 in MS
Livability — Gulfport
- Score
- 73/100
- State rank
- #15
- US rank
- #5010
Category grades
Schools grade is shown separately in the Schools card above.
Census & demographics
- Census place
- Gulfport, MS
- County
- Harrison County · 178,171 people
- City population
- 96,188
- Metro
- Gulfport-Biloxi, MS
- Population (ZIP)
- 55,059
- Household income
- $62,641
- Rent vs Own
- Severe rent burden
- 1686.0
Population outlook (Harrison County) Hauer SSP2
- Today (2025)
- 228,444 people
- By 2030
- 241,942 · +5.9%
- By 2040
- 267,531 · +17.1%
- By 2050
- 291,062 · +27.4%
- By 2075
- 346,711 · +51.8%
- By 2100
- 378,165 · +65.5%
Race, ethnicity, and origin ACS 2023
- Neighborhood character
- Diverse neighborhood (Simpson 0.58)
- Race & ethnicity
- White 58% Black 27% Two or more races 9% Hispanic / Latino 6% Asian 2%
- Hispanic origin (detail)
- Mexican 2% Puerto Rican 1%
- Common ancestry
- Lithuanian 5% Slovak 1% Portuguese 1%
- Foreign-born
- 3% · Canada
- Languages at home
- 95% English-only · Spanish 3%
Political lean MEDSL · Harrison
- 2024 margin
- Strong R (+28.9) · D 35.0% · R 63.9% · Other 1.1%
- 2008→2024 swing
- -2.9pp toward R · 2008: -26.0pp · 2024: -28.9pp
- All cycles
- 2024: R+28.9 2020: R+25.2 2016: R+30.7 2012: R+26.6 2008: R+26.0
Not yet ingested
- Civics
- —
Market trends
- HPI YoY
- ▼ -51.39%
- Current HPI
- 187.285
- Rent YoY
- ▲ 6.99%
- Metro
- Gulfport-Biloxi, MS
- State GDP YoY
- —
- F500 in state
- 0
Price history
+26.7% since first listed10 events — show timeline
- 2026-03-20 Listed $199,999 MLSU
- 2026-01-12 Listing Removed — MLSU
- 2025-09-19 Listed $205,000 MLSU
- 2022-03-08 Sold (Public Records) — Public Records
- 2022-03-04 Sold (MLS) — MLSU
- 2022-02-08 Pending — MLSU
- 2022-01-30 Listed $195,000 MLSU
- 2019-11-05 Sold (Public Records) $157,900 Public Records
- 2019-10-31 Sold (MLS) — MLSU
- 2019-05-20 Listed $157,900 MLSU
Property tax history
+22.8%/yrLatest (2025): $1,432 · +5.7% YoY. Source: county tax records.
Cash-flow waterfall
monthlySold comps — $/sqft
last 12 mo · ≤1 miLoading sold comps…