 Multi-family
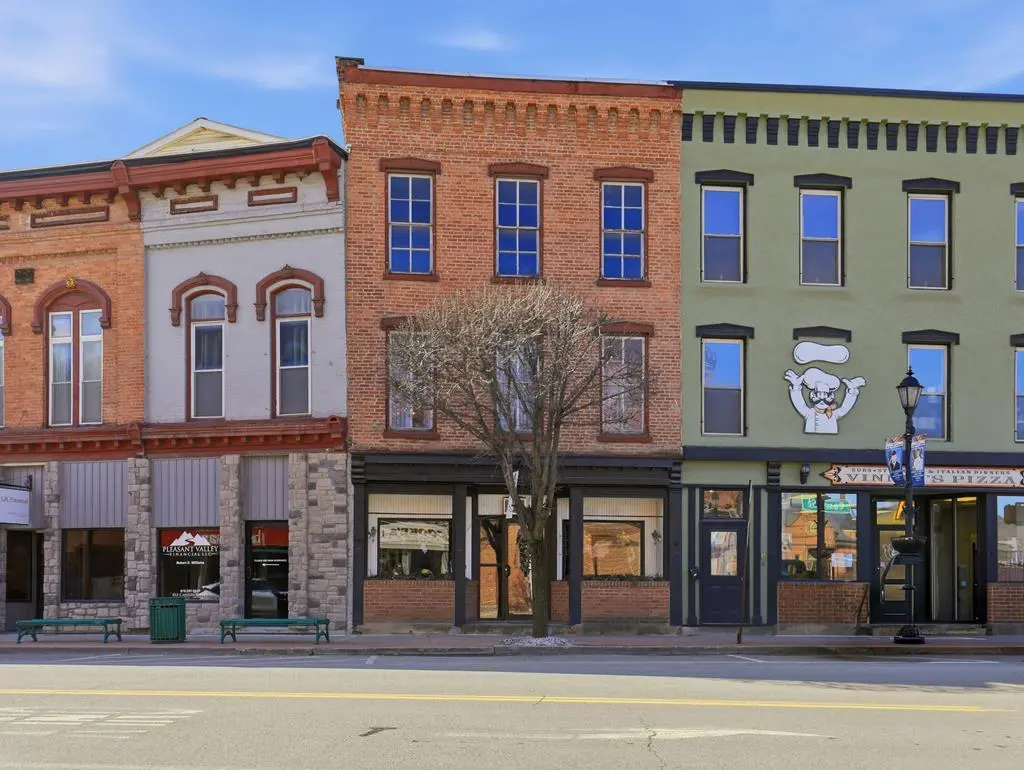
825 Canton St · Troy, PA
Flood risk No data
- FEMA flood zone
- —
- Chance of flooding over 30 yrs
- —
- Est. flood insurance / yr
- —
Fire risk No data
- Est. fire insurance / yr
- —
Heat risk No data
- Hot days now (above threshold)
- —
- Hot days in 30 yrs
- —
Wind risk No data
- Chance of severe wind over 30 yrs
- —
Air-quality risk No data
- Unhealthy air days now
- —
- Unhealthy air days in 30 yrs
- —
Risk factors via First Street. Map © Google.
Why this score? — see what drove the B grade
The composite is a weighted blend of 9 inputs, each scored 0–100. Each bar is that input's sub-score; the figure is the points it added to the 100-point composite (weight × sub-score).
- Cash flow +30.0/30.0
- 1% rule +10.0/10.0
- DSCR +10.0/10.0
- Appreciation +7.9/10.0
- Condition / age +3.8/5.0
- Livability +3.5/5.0
- Schools +2.9/10.0
- Rent growth +2.5/5.0
- ARV discount +0.0/15.0
$199,000
🖨 Deal sheet (PDF) 📄 Offer letter ✓ Due diligence
Multi-family units
County records classify this as Multi-Family (2-4 Unit). Listing-text estimate: 1 unit. estimate disagrees with records
Listing remarks MLS
Turnkey Investment Opportunity with Multiple Income Streams! This spacious 3-story brick building in the heart of downtown offers endless potential for investors. The first floor is currently occupied by the Owner's boutique and hair salon, but now you can put your own business front in center of downtown Troy. The second floor is leased by a photographer & could easily be converted into a stunning apartment or loft-style living space with oversized windows and incredible natural light. The third floor is a blank canvas, ready to become an amazing apartment, short-term rental, studio, or additional office space. With over 3,500 square feet, beautiful exposed brick, large windows with scenic downtown views, and a prime location close to shops, restaurants, and community events, this property is ideal for anyone looking to create a mixed-use or multifamily investment. Income potential, charm, and location all in one property!
Key facts
- Prime location
- Oversized windows
- 1,307 sq ft lot
Tags
Neighborhood map
What this means for you Summary
Snapshot
- This is a 2-bed/2.0-bath multifamily listed at $199k. Condition is rated good.
Deal economics
- At list price, monthly cash flow is $1k ($12k/yr) — positive.
- The deal already cash-flows at list — no discount required.
- Meets the 1% rule at list price ($3k rent vs $199k).
- Recommended offer: $187k (6.0% below list) — sets the bar for market timing.
Location & tenants
- Location reads 70/100 on livability (#749 in PA) — a middle-class / working-renter tenant base. Strengths: crime A+, cost of living A+, health & safety A; Watch: schools C-, employment D+, amenities F.
- Troy Area SD (rural): math 19% / reading 48% proficiency, ranked #427 of 539 in PA (top 79%) — families likely to look elsewhere, expect single-tenant / working-renter base with shorter leases.
- Market conditions: 8 active listings in the ZIP; 66 units permitted in Bradford County in 2024 (0 in 5+ unit buildings).
Forward outlook
- In year one you build about $13k of equity ($1k loan paydown + $11k appreciation (5.7% local appreciation)).
- Bradford County population projected at -23% by 2050 — secular population decline; favor cash flow + early exit over multi-decade hold.
- At projected returns (5.7% appreciation + 3.0% rent growth), your $56k cash investment doubles in ~3 years — after that, you're playing with house money.
- By year 3, paydown + projected appreciation supports a ~$31k cash-out refi (75% LTV) — recoverable capital for the next deal without selling this one.
Negotiation context
- It's been on market 74 days — a 6% lower offer ($187k) is reasonable based on typical stale-listing flexibility.
Risks & watch-outs
- Watch-outs: built in 1900 — expect roof / HVAC / electrical / plumbing capex.
Questions for the listing agent
- It's been on market 74 days. Have you received any prior offers? Is the seller open to a 6% concession, seller financing, or rate buy-down credit?
- Built in 1900 — when were the roof, HVAC, electrical panel, plumbing, and water heater last replaced?
- Why hasn't it sold? Are there any deal-killer items the seller is aware of (foundation, flood, title, zoning, code violations)?
- Is there a deadline driving the sale (1031 exchange, divorce, estate, relocation)? That informs how much negotiation room exists.
- What's the average days-on-market for RENTAL listings here right now (not sales)? A rising rental-DOM trend means longer vacancies and softer asking-rent achievability than the comps imply.
- What's the recent tenant-quality profile in this submarket — average credit score on applications, eviction rate, late-payment / NSF rate, and stable-employment percentage? A property-management company in the area should have these aggregated.
- How much new apartment / multifamily construction is in the pipeline within 1–3 miles? Heavy new supply (>2% of stock underway) typically softens rents 12–24 months out; light construction supports rent growth.
Investment metrics
- 1% rule
- 1.51% ✓
- Cap rate
- 12.35%
- Cash-on-cash
- 21.63%
- DSCR
- 1.96
- GRM
- 5.5
CMA / ARV
- ARV (median comp)
- $143,301
- List price
- $199,000
- Delta
- 38.87%
- Verdict
- OVERPRICED
- Comps
- 2 within 1.0 mi
Projected returns pro-forma
5.71% appreciation · 3.0% rent growth · sell at horizon
- IRR
- 33.0%
- Equity multiple
- 3.12×
- Total profit
- $117,997
- Equity at exit
- $121,414
- IRR
- 30.9%
- Equity multiple
- 6.35×
- Total profit
- $298,067
- Equity at exit
- $217,065
Cash invested: $55,720 (down + closing). Projections, not guarantees.
Landlord ↔ Tenant lean methodology
- Overall (STATE)
- 62 Landlord-Friendly
- State Pennsylvania
- 62 Landlord-Friendly · EVEN
- County
- — inherits STATE
- City
- — inherits STATE
ZIP-level market 16914
- Home prices YoY
- 3.0%
- Active inventory
- 8
- Price-to-rent
- 16.5×
Monthly cashflow live
- Estimated rent
- $3,012 medium interval (Pro) →
- Mortgage (P&I)
- −$1,044
- Tax est. 1.5%
- −$249 /mo · $2,985/yr
- Insurance
- −$83
- HOA
- −$0
- Vacancy / Maint / Mgmt
- −$633
- Net cashflow
- $1,004
Break-even live
Sensitivity live
| Price | -10% $1,142 | -5% $1,073 | +0% $1,004 | +5% $935 | +10% $867 |
|---|---|---|---|---|---|
| Rent | -10% $766 | -5% $885 | +0% $1,004 | +5% $1,123 | +10% $1,242 |
| Rate | -1.0pp $1,104 | -0.5pp $1,055 | base $1,004 | +0.5pp $953 | +1.0pp $900 |
3-unit breakdown (identical units grouped — click to expand)
| Units | Beds | Baths | Est. rent |
|---|---|---|---|
| 3× units | 1 | 1 | $3,012 |
| #1 | 1 | 1 | $1,004 |
| #2 | 1 | 1 | $1,004 |
| #3 | 1 | 1 | $1,004 |
| Total (3 units) | $3,012 | ||
UW: 25.0% down · 7.5% · 30yr · 1.5% tax · 5.0% vac · 8.0% maint · 8.0% mgmt
Financing live
Cash to close
- Down payment
- $49,750
- Closing costs
- $5,970
- Reserves months
- —
- Total cash needed
- —
Loan-product check · same deal, 3 products live
Conventional
25% down · 7.5% · 30yr
- Down + closing
- —
- Monthly P&I
- —
- Monthly cashflow
- —
- DSCR
- —
- Eligible?
- —
Personal DTI + credit; lowest rate.
DSCR
20% down · 8.5% · 30yr
- Down + closing
- —
- Monthly P&I
- —
- Monthly cashflow
- —
- DSCR
- —
- Eligible?
- —
No personal income docs; deal must DSCR.
Hard money
10% down · 12.0% · 12mo
- Down + closing
- —
- Monthly P&I
- —
- Monthly cashflow
- —
- DSCR
- —
- Eligible?
- —
Short-term bridge; refi at stabilization.
Listing history 16 events
-
2026-06-21days on market $199,000 Active 74 DOM
-
2026-06-18days on market $199,000 Active 72 DOM
-
2026-06-17days on market $199,000 Active 71 DOM
-
2026-06-16days on market $199,000 Active 70 DOM
-
2026-06-15days on market $199,000 Active 69 DOM
-
2026-06-13days on market $199,000 Active 67 DOM
-
2026-06-12days on market $199,000 Active 66 DOM
-
2026-06-09days on market $199,000 Active 63 DOM
-
2026-06-08days on market $199,000 Active 62 DOM
-
2026-06-08days on market $199,000 Active 61 DOM
-
2026-06-07days on market $199,000 Active 60 DOM
-
2026-06-04days on market $199,000 Active 57 DOM
-
2026-06-02days on market $199,000 Active 56 DOM
-
2026-06-01days on market $199,000 Active 55 DOM
-
2026-05-31days on market $199,000 Active 54 DOM
-
2026-04-07$199,000 Active 943-char remark
Show marketing remark (943 chars)
Turnkey Investment Opportunity with Multiple Income Streams! This spacious 3-story brick building in the heart of downtown offers endless potential for investors. The first floor is currently occupied by the Owner's boutique and hair salon, but now you can put your own business front in center of downtown Troy. The second floor is leased by a photographer & could easily be converted into a stunning apartment or loft-style living space with oversized windows and incredible natural light. The third floor is a blank canvas, ready to become an amazing apartment, short-term rental, studio, or additional office space. With over 3,500 square feet, beautiful exposed brick, large windows with scenic downtown views, and a prime location close to shops, restaurants, and community events, this property is ideal for anyone looking to create a mixed-use or multifamily investment. Income potential, charm, and location all in one property!
ⓘ Source: listings_history table (triggers on properties + properties_extension) + one-shot
backfill from property_details.listing_events for pre-trigger history.
Nearby sold comps map
Loading sold comps map…
Walkable amenities ~0.75 mi
Loading nearby amenities…
Taxation est. · year 1
- Rental income
- $36,144
- − Mortgage interest
- −$11,147
- − Property taxes
- −$2,985
- − Insurance
- −$995
- − Repairs & maintenance
- −$2,892
- − Management
- −$2,892
- − Depreciation
- −$5,789
- Taxable income
- $9,445
- Est. tax owed @ 24.0%
- −$2,267
- After-tax cash flow
- $9,784/yr
For passive investors: Depreciation is non-cash, so a rental often shows a tax loss while cash-flowing — sheltering income. Rental losses are passive: they offset passive income freely, and up to $25,000/yr can offset ordinary (W-2) income if you actively participate and your MAGI is under $100k (phasing out to $0 by $150k); unused losses carry forward. On sale, claimed depreciation is recaptured at up to 25%, and gains may owe capital-gains tax (a 1031 exchange can defer both). Figures are a year-1 estimate at your 24.0% rate — not tax advice; consult a CPA.
Condition & rehab AI · 13 photos
This 3-story brick building in downtown Troy is in good condition with cosmetic updates needed. It offers multiple income streams and is ready for a new business or residential use.
Value-add opportunities
- Both Exterior painting — Enhances curb appeal and resale value
- Both Interior painting — Fresh paint can improve the look and feel of the space
- Both Landscaping — A well-maintained yard can increase both resale and rental value
Renovation cost estimate screening
Value-add ROI direction
- Both Exterior painting — Enhances curb appeal and resale value ↑
- Both Interior painting — Fresh paint can improve the look and feel of the space ↑
- Both Landscaping — A well-maintained yard can increase both resale and rental value ↑
ⓘ Cost ranges are severity-bucket heuristics (US national rule-of-thumb). Get contractor quotes + a written scope before underwriting a rehab budget.
Schools (NCES district)
- District
- Troy Area SD
- NCES district ID
- 4223790
- Math proficiency
- 19% ▼ -21.00%
- Reading proficiency
- 48% ▼ -14.00%
- Median HH income
- $46,987
- Composite
- 28.7/100
- National rank
- #6690
- State rank
- #427 of 539 in PA
Livability — Troy
- Score
- 70/100
- State rank
- #749
- US rank
- #7478
Category grades
Schools grade is shown separately in the Schools card above.
Census & demographics
- Census place
- Troy, PA
- Population (ZIP)
- 2,415
Population outlook (Bradford County) Hauer SSP2
- Today (2025)
- 57,236 people
- By 2030
- 54,660 · -4.5%
- By 2040
- 49,502 · -13.5%
- By 2050
- 44,277 · -22.6%
- By 2075
- 33,420 · -41.6%
- By 2100
- 22,919 · -60.0%
Race, ethnicity, and origin ACS 2023
- Neighborhood character
- Predominantly White (95%)
- Race & ethnicity
- White 95% Two or more races 2%
- Common ancestry
- Romanian 3% Scottish 2% Scotch-Irish 2%
- Foreign-born
- 1% · Canada
- Languages at home
- 98% English-only · German/W. Germanic 1% Spanish 1%
Political lean MEDSL · Bradford
- 2024 margin
- Solid R (+47.9) · D 25.6% · R 73.5%
- 2008→2024 swing
- -29.5pp toward R · 2008: -18.4pp · 2024: -47.9pp
- All cycles
- 2024: R+47.9 2020: R+44.9 2016: R+46.0 2012: R+24.6 2008: R+18.4
Not yet ingested
- Civics
- —
Market trends
- HPI YoY
- ▲ 5.71%
- Current HPI
- 195.9402
- Rent YoY
- —
- Metro
- —
- State GDP YoY
- ▲ 1.68%
- F500 in state
- 34
Industry mix (Fortune 500 HQ in PA)
| Industry | F500 HQs | Revenue |
|---|---|---|
| Healthcare | 2 | $309B |
|
||
| Insurance | 2 | $27B |
|
||
| Telecommunications / Media | 1 | $124B |
|
||
| Industrial Distribution | 1 | $22B |
|
||
| Financial Services | 1 | $20B |
|
||
| Chemicals / Materials | 1 | $18B |
|
||
Price history
1 event — show timeline
- 2026-04-07 Listed $199,000 NMPA
Cash-flow waterfall
monthlySold comps — $/sqft
last 12 mo · ≤1 miLoading sold comps…