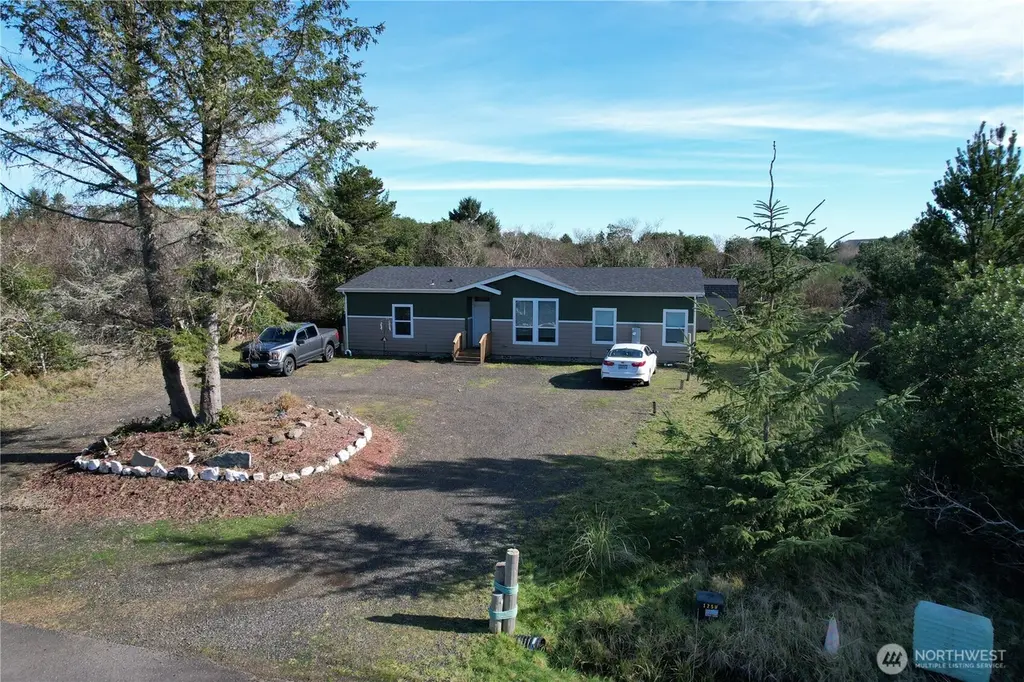
331 Palmer St SW · Ocean Shores, WA
Flood risk 1/10 · Minimal
- FEMA flood zone
- X (unshaded)
- Chance of flooding over 30 yrs
- 0.0%
- Est. flood insurance / yr
- $507 – $1,088
Fire risk 1/10 · Minimal
- Est. fire insurance / yr
- $604 – $1,122
Heat risk 1/10 · Minimal
- Hot days now (above 72°F)
- 7 days/yr
- Hot days in 30 yrs
- 17 days/yr
Wind risk 1/10 · Minimal
- Chance of severe wind over 30 yrs
- —
Air-quality risk 5/10 · Moderate
- Unhealthy air days now
- 6 days/yr
- Unhealthy air days in 30 yrs
- 6 days/yr
Risk factors via First Street. Map © Google.
Why this score? — see what drove the F grade
The composite is a weighted blend of 9 inputs, each scored 0–100. Each bar is that input's sub-score; the figure is the points it added to the 100-point composite (weight × sub-score).
- Cash flow +7.8/30.0
- ARV discount +7.5/15.0
- Schools +3.4/10.0
- Livability +3.1/5.0
- Rent growth +2.5/5.0
- Condition / age +2.5/5.0
- DSCR +1.9/10.0
- 1% rule +1.4/10.0
- Appreciation +0.0/10.0
$327,900
🖨 Deal sheet (PDF) 📄 Offer letter ✓ Due diligence
Listing remarks
What a treasure, located on a secluded street close to the beach and waterways! This spacious home is perfect if you're looking for privacy. Located on a quiet street close to beaches & recreation. The great room is ideal for entertaining and separates the primary en-suite from the guest/ bedrooms for privacy. The kitchen is a chef's delight with plenty of counter workspace lots of cabinets and a large pantry. All bedrooms have walk-in closets! The back yard has room for a garden or play area/ and would be a great place for pets, and a very large storage shed for yard tools & toys! Theres a circular driveway and easy-care landscaping. Assumable Mtg @ 3.25 % / with satisfactory
Key facts
- Back yard
- Secluded street
- Walk-in closets
Tags
Neighborhood map
What this means for you Summary
Snapshot
- This is a 3-bed/2.0-bath single-family listed at $328k.
Deal economics
- At list price, monthly cash flow is $-360 ($-4k/yr) — negative.
- To cash-flow at today's rent, offer at most $264k (19.4% below list).
- To meet the 1% rule (rent ≥ 1% of price), the offer needs to be $210k (35.8% below list).
- Recommended offer: $210k (35.8% below list) — sets the bar for 1% rule.
- Cap rate 5.0% vs local median 3.1% in Ocean Shores — top-decile yield for the area; either an underpriced asset or a hidden risk that comps aren't pricing in. Stress-test before assuming the spread holds.
Location & tenants
- Location reads 62/100 on livability (#424 in WA) — a middle-class / working-renter tenant base. Strengths: housing A; Watch: schools C-, crime C-, health & safety C-.
- North Beach School District (rural): math 32% / reading 44% proficiency, ranked #236 of 291 in WA (top 81%) — families likely to look elsewhere, expect single-tenant / working-renter base with shorter leases; 63% free/reduced lunch — lower-income household profile, screen leases tightly.
- Market conditions: 653 active listings in the ZIP; 1 comparable units currently listed for rent nearby; 297 units permitted in Grays Harbor County in 2024 (17 in 5+ unit buildings).
- This rent runs 43% of the median local income ($58k/yr) — at the standard rent-burdened threshold; future hikes will face affordability resistance.
Forward outlook
- Local home prices are declining (-3.0%/yr); year-one equity from $2k of loan paydown is wiped out by about $10k of value loss. Plan a longer hold.
- Grays Harbor County population projected at -24% by 2050 — secular population decline; favor cash flow + early exit over multi-decade hold.
Negotiation context
- It's been on market 97 days — a 9% lower offer ($298k) is reasonable based on typical stale-listing flexibility.
- 2 sale attempts since 6y ago with the ask held roughly flat each time — persistent listings suggest the price (not the market) is what's stuck; bring a comps-based counter.
- Current owner paid $40k; list at $328k implies a 720% gain — meaningful room to come down on a strong offer.
Questions for the listing agent
- What do current leases actually rent for vs. the listed asking? Can we see a recent rent roll and the last 12 months of T-12 income?
- It's been on market 97 days. Have you received any prior offers? Is the seller open to a 36% concession, seller financing, or rate buy-down credit?
- Why hasn't it sold? Are there any deal-killer items the seller is aware of (foundation, flood, title, zoning, code violations)?
- Is there a deadline driving the sale (1031 exchange, divorce, estate, relocation)? That informs how much negotiation room exists.
- The area grade is low — what's the realistic commute time and amenity access for the typical tenant pool here? Any planned neighborhood developments (good or bad) we should know about?
- What's the average days-on-market for RENTAL listings here right now (not sales)? A rising rental-DOM trend means longer vacancies and softer asking-rent achievability than the comps imply.
- What's the recent tenant-quality profile in this submarket — average credit score on applications, eviction rate, late-payment / NSF rate, and stable-employment percentage? A property-management company in the area should have these aggregated.
- How much new for-sale + rental construction is in the pipeline within 1–3 miles? Heavy new supply typically softens prices + rents 12–24 months out; constrained supply supports both.
Investment metrics
- 1% rule
- 0.64% ✗
- Cap rate
- 4.98%
- Cash-on-cash
- -4.70%
- DSCR
- 0.79
- GRM
- 13.0
CMA / ARV
- ARV (median comp)
- $661,532
- List price
- $327,900
- Delta
- -50.43%
- Verdict
- UNDERPRICED
- Comps
- 20 within 1.0 mi
Show comp detail 12 sales within ~0.75 mi
| Address | Dist | Beds/Ba | Sqft | Sold | Price | $/sf | Match |
|---|---|---|---|---|---|---|---|
| 449 Laurel Ct SW | 0.22mi | 3/2.5 | 1,719 (+2%) | 7mo | $815,202 | $474 | 78 |
| 1003 Greenview Ave | 0.46mi | 3/2.0 | 1,716 (+2%) | 1mo | $390,000 | $227 | 74 |
| 998 Cascade Ave SW | 0.10mi | 3/2.5 | 1,475 (-12%) | 7mo | $465,000 | $315 | 67 |
| 969 Cascade Ave SW | 0.15mi | 3/2.0 | 1,478 (-12%) | 8mo | $439,900 | $298 | 66 |
| 441 Laurel Ct SW | 0.21mi | 3/2.5 | 1,453 (-14%) | 7mo | $775,581 | $534 | 60 |
| 1071 Ocean Shores Blvd SW | 0.73mi | 3/2.0 | 1,580 (-6%) | 2mo | $420,000 | $266 | 55 |
| 184 S Razor Clam Dr SW | 0.57mi | 3/2.0 | 1,552 (-8%) | 8mo | $475,000 | $306 | 54 |
| 634 Island Cir SE | 0.72mi | 3/2.0 | 1,495 (-11%) | 0mo | $410,000 | $274 | 48 |
| 907 Tall Ships Ct SW | 0.58mi | 2/2.0 (-1) | 1,428 (-15%) | 1mo | $439,000 | $307 | 42 |
| 646 Island Cir SE | 0.70mi | 2/3.0 (-1) | 1,514 (-10%) | 0mo | $589,000 | $389 | 42 |
| 1080 Greenview Ct SW | 0.71mi | 3/2.0 | 1,456 (-13%) | 4mo | $299,900 | $206 | 41 |
| 311 Otsego St SW | 0.62mi | 2/2.0 (-1) | 1,464 (-13%) | 5mo | $410,000 | $280 | 40 |
Match score weights: distance 35% · size 25% · config 20% · recency 20%. Top-matched comps best support the ARV.
Projected returns pro-forma
-3.0% appreciation · 3.0% rent growth · sell at horizon
- IRR
- -24.3%
- Equity multiple
- 0.17×
- Total profit
- $-76,156
- Equity at exit
- $48,891
- IRR
- -19.9%
- Equity multiple
- -0.05×
- Total profit
- $-96,288
- Equity at exit
- $28,351
Cash invested: $91,812 (down + closing). Projections, not guarantees.
Landlord ↔ Tenant lean methodology
- Overall (STATE)
- 28 Tenant-Leaning
- State Washington
- 28 Tenant-Leaning · D+8
- County
- — inherits STATE
- City
- — inherits STATE
ZIP-level market 98569
- Home prices YoY
- -3.4%
- Active inventory
- 653
- Price-to-rent
- 13.0×
Monthly cashflow live
- Estimated rent
- $2,104 medium interval (Pro) →
- Mortgage (P&I)
- −$1,720
- Tax from tax record
- −$166 /mo · $1,990/yr
- Insurance
- −$137
- HOA
- −$0
- Vacancy / Maint / Mgmt
- −$442
- Net cashflow
- $-360
Break-even live
Sensitivity live
| Price | -10% $-174 | -5% $-267 | +0% $-360 | +5% $-452 | +10% $-545 |
|---|---|---|---|---|---|
| Rent | -10% $-526 | -5% $-443 | +0% $-360 | +5% $-276 | +10% $-193 |
| Rate | -1.0pp $-194 | -0.5pp $-276 | base $-360 | +0.5pp $-445 | +1.0pp $-531 |
UW: 25.0% down · 7.5% · 30yr · 1.5% tax · 5.0% vac · 8.0% maint · 8.0% mgmt
Financing live
Cash to close
- Down payment
- $81,975
- Closing costs
- $9,837
- Reserves months
- —
- Total cash needed
- —
Loan-product check · same deal, 3 products live
Conventional
25% down · 7.5% · 30yr
- Down + closing
- —
- Monthly P&I
- —
- Monthly cashflow
- —
- DSCR
- —
- Eligible?
- —
Personal DTI + credit; lowest rate.
DSCR
20% down · 8.5% · 30yr
- Down + closing
- —
- Monthly P&I
- —
- Monthly cashflow
- —
- DSCR
- —
- Eligible?
- —
No personal income docs; deal must DSCR.
Hard money
10% down · 12.0% · 12mo
- Down + closing
- —
- Monthly P&I
- —
- Monthly cashflow
- —
- DSCR
- —
- Eligible?
- —
Short-term bridge; refi at stabilization.
Rent comps 1 comps
| Address | Beds | Baths | Sqft | Rent | $/sqft | DOM | Units | Dist |
|---|---|---|---|---|---|---|---|---|
| 677 Lake Island Ave SE Ocean Shores, WA | 3.0 | 2.0 | 1352 | $2,600 | $1.92 | 44d | 1 | 1.25mi |
Listing history 7 events
-
2026-02-12price $327,900
-
2026-02-12$325,000 Active
-
2021-04-16soldstatus $40,000 Sold
-
2020-11-05status Pending
-
2020-10-30$40,000 Active
-
2004-09-30soldstatus $13,500
-
1997-01-28soldstatus $9,000
ⓘ Source: listings_history table (triggers on properties + properties_extension) + one-shot
backfill from property_details.listing_events for pre-trigger history.
Tax reassessment forecast WA · Resets to sale price
- Current annual tax
- $1,990 · $166/mo
- Projected year-2 tax
- $3,213 · $268/mo
- Expected delta
- +$1,223/yr (+$102/mo · 61.4%)
ⓘ Screening estimate from a state-policy table — verify with the county assessor before closing.
Climate risk First Street
- Flood 1/10 Low FEMA zone X (unshaded) · 0% chance over 30 yrs
- Wildfire 1/10 Low
- Heat 1/10 Low 7 d/yr ≥72°F today · 17 d/yr by 30 yrs out
- Wind 1/10 Low
- Air quality 5/10 Major 6 unhealthy d/yr today · 6 by 30 yrs out
Nearby sold comps map
Loading sold comps map…
Walkable amenities ~0.75 mi
Loading nearby amenities…
Taxation est. · year 1
- Rental income
- $25,252
- − Mortgage interest
- −$18,367
- − Property taxes
- −$1,990
- − Insurance
- −$1,640
- − Repairs & maintenance
- −$2,020
- − Management
- −$2,020
- − Depreciation
- −$9,539
- Taxable loss
- −$10,325
- Est. tax savings @ 24.0%
- +$2,478
- After-tax cash flow
- $-1,837/yr
For passive investors: Depreciation is non-cash, so a rental often shows a tax loss while cash-flowing — sheltering income. Rental losses are passive: they offset passive income freely, and up to $25,000/yr can offset ordinary (W-2) income if you actively participate and your MAGI is under $100k (phasing out to $0 by $150k); unused losses carry forward. On sale, claimed depreciation is recaptured at up to 25%, and gains may owe capital-gains tax (a 1031 exchange can defer both). Figures are a year-1 estimate at your 24.0% rate — not tax advice; consult a CPA.
Schools (NCES district)
- District
- North Beach School District
- NCES district ID
- 5305700
- Math proficiency
- 32% ▼ -4.00%
- Reading proficiency
- 44% ▬ 0.00%
- Median HH income
- $40,966
- Composite
- 34.46/100
- National rank
- #10153
- State rank
- #236 of 291 in WA
Livability — Ocean Shores
- Score
- 62/100
- State rank
- #424
- US rank
- #16852
Category grades
Schools grade is shown separately in the Schools card above.
Census & demographics
- Census place
- Ocean Shores, WA
- County
- Grays Harbor County · 44,693 people
- City population
- 7,187
- Metro
- Aberdeen, WA
- Population (ZIP)
- 7,489
- Household income
- $58,378
- Rent vs Own
- Severe rent burden
- 172.0
Population outlook (Grays Harbor County) Hauer SSP2
- Today (2025)
- 66,443 people
- By 2030
- 63,255 · -4.8%
- By 2040
- 56,466 · -15.0%
- By 2050
- 50,516 · -24.0%
- By 2075
- 39,296 · -40.9%
- By 2100
- 31,142 · -53.1%
Race, ethnicity, and origin ACS 2023
- Neighborhood character
- Predominantly White (86%)
- Race & ethnicity
- White 86% Two or more races 5% Hispanic / Latino 4% Asian 3% Native American 3%
- Common ancestry
- Portuguese 8% Iranian 5% Lithuanian 4%
- Foreign-born
- 5% · Canada
- Languages at home
- 92% English-only · Spanish 3% Tagalog/Filipino 2% German/W. Germanic 2%
Political lean MEDSL · Grays Harbor
- 2024 margin
- Lean R (+6.0) · D 45.6% · R 51.6% · Other 2.8%
- 2008→2024 swing
- -20.6pp toward R · 2008: 14.6pp · 2024: -6.0pp
- All cycles
- 2024: R+6.0 2020: R+6.6 2016: R+7.1 2012: D+14.0 2008: D+14.6
Not yet ingested
- Civics
- —
Market trends
- HPI YoY
- ▼ -13.33%
- Current HPI
- 380.05
- Rent YoY
- —
- Metro
- Aberdeen, WA
- State GDP YoY
- ▲ 4.65%
- F500 in state
- 22
Industry mix (Fortune 500 HQ in WA)
| Industry | F500 HQs | Revenue |
|---|---|---|
| Retail | 2 | $269B |
|
||
| Technology / Retail | 1 | $638B |
|
||
| Technology | 1 | $245B |
|
||
| Telecommunications | 1 | $38B |
|
||
| Food / Beverage | 1 | $36B |
|
||
| Automotive / Trucks | 1 | $34B |
|
||
Price history
+3543.3% since first listed7 events — show timeline
- 2026-02-12 Price Changed $327,900 NWMLS as Distributed by MLS Grid
- 2026-02-12 Listed $325,000 NWMLS as Distributed by MLS Grid
- 2021-04-16 Sold (MLS) $40,000 NWMLS as Distributed by MLS Grid
- 2020-11-05 Pending — NWMLS as Distributed by MLS Grid
- 2020-10-30 Listed $40,000 NWMLS as Distributed by MLS Grid
- 2004-09-30 Sold (Public Records) $13,500 Public Records
- 1997-01-28 Sold (Public Records) $9,000 Public Records
Property tax history
+39.4%/yrLatest (2026): $1,990 · -0.6% YoY. Source: county tax records.
Cash-flow waterfall
monthlySold comps — $/sqft
last 12 mo · ≤1 miLoading sold comps…