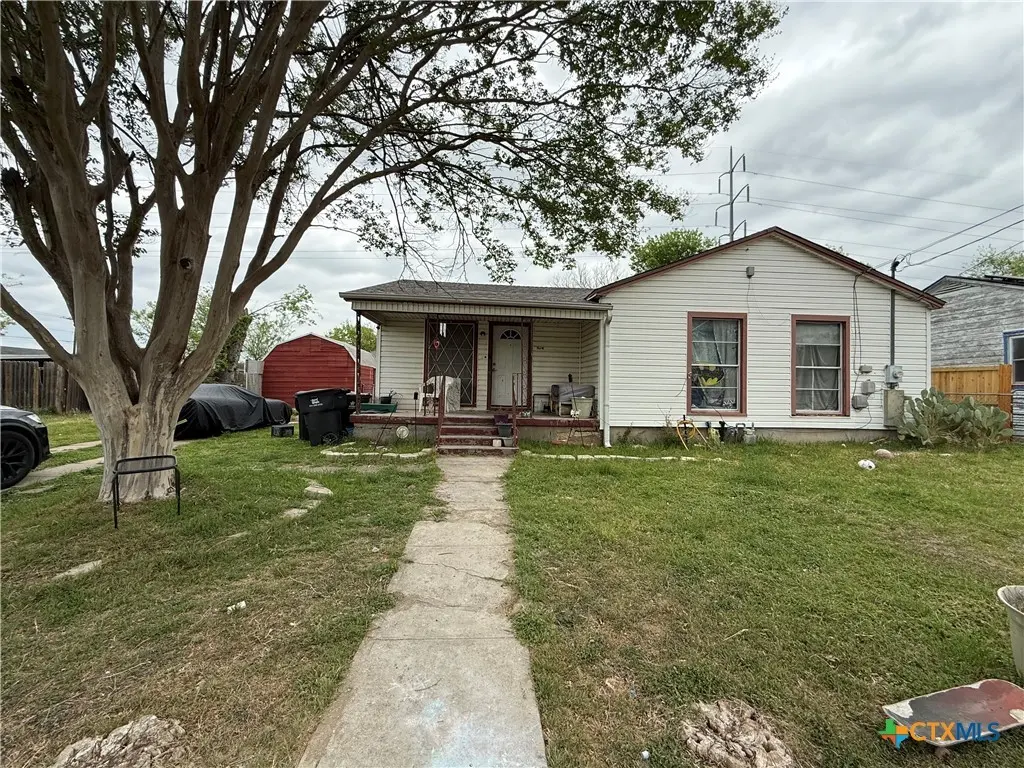
1614 E Barton Ave · Temple, TX
Flood risk 1/10 · Minimal
- FEMA flood zone
- X (unshaded)
- Chance of flooding over 30 yrs
- 0.0%
- Est. flood insurance / yr
- $507 – $1,088
Fire risk 4/10 · Minor
- Est. fire insurance / yr
- $1,222 – $2,270
Heat risk 7/10 · Major
- Hot days now (above 108°F)
- 7 days/yr
- Hot days in 30 yrs
- 24 days/yr
Wind risk 8/10 · Major
- Chance of severe wind over 30 yrs
- 80.0%
Air-quality risk 1/10 · Minimal
- Unhealthy air days now
- 0 days/yr
- Unhealthy air days in 30 yrs
- 0 days/yr
Risk factors via First Street. Map © Google.
Why this score? — see what drove the B- grade
The composite is a weighted blend of 9 inputs, each scored 0–100. Each bar is that input's sub-score; the figure is the points it added to the 100-point composite (weight × sub-score).
- Cash flow +30.0/30.0
- 1% rule +10.0/10.0
- DSCR +10.0/10.0
- ARV discount +7.5/15.0
- Livability +3.8/5.0
- Rent growth +3.4/5.0
- Schools +2.7/10.0
- Condition / age +2.5/5.0
- Appreciation +0.0/10.0
$74,999
🖨 Deal sheet (PDF) 📄 Offer letter ✓ Due diligence
Listing remarks MLS
INVESTOR SPECIAL!! Looking for an investment property or an opportunity to fix up a home and have instant equity, this is a rare opportunity for an “AS-IS” home. Picture 2 and 3 are AI generated photos of what could be. Overall, the home is in good condition. The previous owner has done some of the more costly improvements including the roof and HVAC. The siding needs to be replaced on the left side of the home. The comparables in the area appear to be around 135K to 145K if the home was updated and cleaned up similar to picture 3. Occupant requires 24 hour notice.
Key facts
- Roof
- Hvac
- Investment property
Tags
Neighborhood map
What this means for you Summary
Snapshot
- This is a 3-bed/1.0-bath single-family listed at $75k.
Deal economics
- At list price, monthly cash flow is $469 ($6k/yr) — positive.
- The deal already cash-flows at list — no discount required.
- Meets the 1% rule at list price ($1k rent vs $75k).
- Recommended offer: $70k (6.0% below list) — sets the bar for market timing.
- Cap rate 13.8% vs local median 3.6% in Temple — top-decile yield for the area; either an underpriced asset or a hidden risk that comps aren't pricing in. Stress-test before assuming the spread holds.
Location & tenants
- Location reads 75/100 on livability (#122 in TX, #3,814 nationally) — a middle-class / working-renter tenant base. Strengths: cost of living A+, housing A+, health & safety A+; Watch: schools C-, commute C-, crime D+.
- Temple ISD (urban): math 32% / reading 31% proficiency, ranked #590 of 826 in TX (top 71%) — families likely to look elsewhere, expect single-tenant / working-renter base with shorter leases; 66% free/reduced lunch — lower-income household profile, screen leases tightly.
- Market conditions: Rents rising (+3.4%/yr); 337 active listings in the ZIP; 40 comparable units currently listed for rent nearby; rentals at typical pace (median 16d on market — plan ~3-4 weeks tenant-placement turnaround); 3,222 units permitted in Bell County in 2024 (246 in 5+ unit buildings).
Forward outlook
- Local home prices are declining (-3.0%/yr); year-one equity from $518 of loan paydown is wiped out by about $2k of value loss. Plan a longer hold.
- Bell County population projected at +21% by 2050 — long-run rental-demand tailwind backs the buy-and-hold thesis.
- At projected returns (-3.0% appreciation + 3.4% rent growth), your $21k cash investment doubles in ~5 years — after that, you're playing with house money.
Negotiation context
- It's been on market 74 days — a 6% lower offer ($70k) is reasonable based on typical stale-listing flexibility.
- 4 sale attempts since 19y ago; this cycle's ask has dropped $10k (12%) from the opening price — seller is motivated, your offer sets the floor, not the list.
- Current owner paid $36k; list at $75k implies a 108% gain — meaningful room to come down on a strong offer.
Risks & watch-outs
- Watch-outs: property tax is 3.4% of price; built in 1940 — expect roof / HVAC / electrical / plumbing capex.
- Climate carrying-cost: severe wind risk, 80% chance of damaging wind over 30y; extreme-heat days projected 7→24/yr by 2055 (HVAC capex compounding) — expect insurance premiums to compound above CPI over the hold.
Questions for the listing agent
- It's been on market 74 days. Have you received any prior offers? Is the seller open to a 6% concession, seller financing, or rate buy-down credit?
- Built in 1940 — when were the roof, HVAC, electrical panel, plumbing, and water heater last replaced?
- Property tax is high relative to price — has the assessment been appealed recently, and will the sale trigger a re-assessment?
- Why hasn't it sold? Are there any deal-killer items the seller is aware of (foundation, flood, title, zoning, code violations)?
- Is there a deadline driving the sale (1031 exchange, divorce, estate, relocation)? That informs how much negotiation room exists.
- Crime grade is D in this area — have there been break-ins, vandalism, or insurance claims at this property in the last 3 years? What carrier currently insures it and at what premium?
- What's the average days-on-market for RENTAL listings here right now (not sales)? A rising rental-DOM trend means longer vacancies and softer asking-rent achievability than the comps imply.
- What's the recent tenant-quality profile in this submarket — average credit score on applications, eviction rate, late-payment / NSF rate, and stable-employment percentage? A property-management company in the area should have these aggregated.
- How much new for-sale + rental construction is in the pipeline within 1–3 miles? Heavy new supply typically softens prices + rents 12–24 months out; constrained supply supports both.
Investment metrics
- 1% rule
- 1.87% ✓
- Cap rate
- 13.80%
- Cash-on-cash
- 26.80%
- DSCR
- 2.19
- GRM
- 4.5
CMA / ARV
- ARV (median comp)
- $173,806
- List price
- $74,999
- Delta
- -56.85%
- Verdict
- UNDERPRICED
- Comps
- 20 within 1.0 mi
Show comp detail 3 sales within ~0.75 mi
| Address | Dist | Beds/Ba | Sqft | Sold | Price | $/sf | Match |
|---|---|---|---|---|---|---|---|
| 306 Fowler Dr | 0.09mi | 3/2.0 | 1,166 (+10%) | 3mo | $178,000 | $153 | 73 |
| 713 S 30th St | 0.75mi | 3/2.0 | 1,084 (+2%) | 1mo | $186,000 | $172 | 57 |
| 815 E Elm Ave | 0.41mi | 2/2.0 (-1) | 963 (-10%) | 4mo | $70,000 | $73 | 52 |
Match score weights: distance 35% · size 25% · config 20% · recency 20%. Top-matched comps best support the ARV.
Projected returns pro-forma
-3.0% appreciation · 3.44% rent growth · sell at horizon
- IRR
- 21.3%
- Equity multiple
- 1.88×
- Total profit
- $18,433
- Equity at exit
- $11,183
- IRR
- 29.8%
- Equity multiple
- 3.74×
- Total profit
- $57,482
- Equity at exit
- $6,485
Cash invested: $21,000 (down + closing). Projections, not guarantees.
Landlord ↔ Tenant lean methodology
- Overall (STATE)
- 87 Strongly Landlord-Friendly
- State Texas
- 87 Strongly Landlord-Friendly · R+5
- County
- — inherits STATE
- City
- — inherits STATE
ZIP-level market 76501
- Rents YoY
- 3.4%
- Active inventory
- 337
- Price-to-rent
- 4.5×
Monthly cashflow live
- Estimated rent
- $1,403 high interval (Pro) →
- Mortgage (P&I)
- −$393
- Tax from tax record
- −$215 /mo · $2,579/yr
- Insurance
- −$31
- HOA
- −$0
- Vacancy / Maint / Mgmt
- −$295
- Net cashflow
- $469
Break-even live
Sensitivity live
| Price | -10% $511 | -5% $490 | +0% $469 | +5% $448 | +10% $426 |
|---|---|---|---|---|---|
| Rent | -10% $358 | -5% $414 | +0% $469 | +5% $524 | +10% $580 |
| Rate | -1.0pp $507 | -0.5pp $488 | base $469 | +0.5pp $450 | +1.0pp $430 |
UW: 25.0% down · 7.5% · 30yr · 1.5% tax · 5.0% vac · 8.0% maint · 8.0% mgmt
Financing live
Cash to close
- Down payment
- $18,750
- Closing costs
- $2,250
- Reserves months
- —
- Total cash needed
- —
Loan-product check · same deal, 3 products live
Conventional
25% down · 7.5% · 30yr
- Down + closing
- —
- Monthly P&I
- —
- Monthly cashflow
- —
- DSCR
- —
- Eligible?
- —
Personal DTI + credit; lowest rate.
DSCR
20% down · 8.5% · 30yr
- Down + closing
- —
- Monthly P&I
- —
- Monthly cashflow
- —
- DSCR
- —
- Eligible?
- —
No personal income docs; deal must DSCR.
Hard money
10% down · 12.0% · 12mo
- Down + closing
- —
- Monthly P&I
- —
- Monthly cashflow
- —
- DSCR
- —
- Eligible?
- —
Short-term bridge; refi at stabilization.
Rent comps 40 comps
| Address | Beds | Baths | Sqft | Rent | $/sqft | DOM | Units | Dist |
|---|---|---|---|---|---|---|---|---|
| 104 S 22nd St Unit B Temple, TX | 3.0 | 2.5 | 1300 | $1,435 | $1.10 | 45d | 1 | 0.38mi |
| 715 N 20th St Apt 7 Temple, TX | 2.0 | 1.0 | 750 | $750 | $1.00 | 45d | 1 | 0.44mi |
| 209 S 18th St Unit A Temple, TX | 3.0 | 2.0 | 1250 | $1,550 | $1.24 | 25d | 1 | 0.51mi |
| 209 S 18th St Temple, TX | 3.0 | 2.5 | 1250 | $1,400 | $1.12 | 45d | 1 | 0.51mi |
| 209 S 18th St Unit A Temple, TX | 3.0 | 2.0 | 1250 | $1,550 | $1.24 | 15d | 1 | 0.51mi |
| 110 Dolphin Dr Unit A Temple, TX | 3.0 | 2.0 | 1378 | $1,350 | $0.98 | 15d | 1 | 0.54mi |
| 103 Dolphin Dr Unit B Temple, TX | 3.0 | 2.0 | 1373 | $1,550 | $1.13 | 45d | 1 | 0.56mi |
| 2310 Ocean Ave Unit A Temple, TX | 3.0 | 2.0 | 1300 | $1,425 | $1.10 | 45d | 1 | 0.57mi |
| 117 Dolphin Dr Unit 117 A Dolphin Temple, TX | 3.0 | 2.0 | 1379 | $1,350 | $0.98 | 15d | 1 | 0.58mi |
| 121 Dolphin Dr Unit 121 A Dolphin Temple, TX | 3.0 | 2.0 | 1379 | $1,350 | $0.98 | 15d | 1 | 0.59mi |
| 2322 Ocean Ave Temple, TX | 3.0 | 2.0 | 1300 | $1,495 | $1.15 | 15d | 1 | 0.60mi |
| 2321 Ocean Ave Unit B Temple, TX | 3.0 | 2.0 | 1310 | $1,400 | $1.07 | 15d | 1 | 0.61mi |
| 2321 Ocean Ave Unit B Temple, TX | 3.0 | 2.0 | 1310 | $1,400 | $1.07 | 45d | 1 | 0.61mi |
| 701 East Avenue A Unit A Temple, TX | 3.0 | 2.0 | 1090 | $1,349 | $1.24 | 15d | 1 | 0.63mi |
| 218 Dolphin Dr Unit 218 A Dolphin Temple, TX | 3.0 | 2.0 | 1379 | $1,350 | $0.98 | 15d | 1 | 0.63mi |
| 222 Dolphin Dr Unit 222 A Dolphin Temple, TX | 3.0 | 3.0 | 1455 | $1,450 | $1.00 | 15d | 1 | 0.64mi |
| 602 S 26th St Temple, TX | 3.0 | 1.0 | 768 | $1,200 | $1.56 | 25d | 1 | 0.65mi |
| 226 Dolphin Dr Unit 226 A Dolphin Temple, TX | 3.0 | 3.0 | 1455 | $1,450 | $1.00 | 15d | 1 | 0.66mi |
| 101 Riptide Rd Temple, TX | 3.0 | 2.0 | 1310 | $1,495 | $1.14 | 23d | 1 | 0.67mi |
| 234 Dolphin Dr Unit 234 A Dolphin Temple, TX | 3.0 | 2.0 | 1379 | $1,350 | $0.98 | 15d | 1 | 0.68mi |
| 613 S 24th St Temple, TX | 3.0 | 2.0 | 1028 | $1,290 | $1.25 | 25d | 1 | 0.69mi |
| 612 S 26th St Temple, TX | 3.0 | 2.0 | 1237 | $1,195 | $0.97 | 45d | 1 | 0.70mi |
| 306 Dolphin Dr Unit 306 A Dolphin Temple, TX | 3.0 | 2.0 | 1379 | $1,350 | $0.98 | 15d | 1 | 0.71mi |
| 501 Henderson St Temple, TX | 4.0 | 2.0 | 1223 | $1,050 | $0.86 | 15d | 1 | 0.71mi |
| 215 Riptide Rd Unit A Temple, TX | 3.0 | 2.0 | 1345 | $1,400 | $1.04 | 45d | 1 | 0.71mi |
| 503 Henderson St Temple, TX | 3.0 | 2.0 | 1090 | $1,015 | $0.93 | 15d | 1 | 0.71mi |
| 307 Riptide Rd Temple, TX | 3.0 | 2.0 | 1400 | $1,500 | $1.07 | 15d | 1 | 0.73mi |
| 15 S 10th St Temple, TX | 3.0 | 1.0 | 916 | $950 | $1.04 | 45d | 1 | 0.74mi |
| 505 S 16th St Temple, TX | 3.0 | 2.0 | 1090 | $1,070 | $0.98 | 15d | 1 | 0.74mi |
| 518 S Knob St Unit B Temple, TX | 3.0 | 2.0 | 1090 | $1,015 | $0.93 | 15d | 1 | 0.75mi |
| 509 S 16th St Temple, TX | 3.0 | 2.0 | 1090 | $1,065 | $0.98 | 15d | 1 | 0.75mi |
| 1906 East Avenue G Unit G Temple, TX | 4.0 | 2.0 | 1347 | $1,600 | $1.19 | 25d | 1 | 0.76mi |
| 708 S 28th St Unit 28th St unit 708 A Temple, TX | 3.0 | 2.5 | 1355 | $1,435 | $1.06 | 45d | 1 | 0.77mi |
| 619 N 8th St Unit a Temple, TX | 3.0 | 2.0 | 872 | $999 | $1.15 | 15d | 1 | 0.78mi |
| 101 S 50th St Unit 1324867P Temple, TX | 3.0 | 2.0 | 1194 | $4,293 | $3.60 | 23d | 1 | 0.80mi |
| 805 S 24th St Temple, TX | 3.0 | 2.0 | 1233 | $1,245 | $1.01 | 45d | 1 | 0.84mi |
| 708 Henderson St Temple, TX | 3.0 | 2.0 | 1090 | $1,025 | $0.94 | 15d | 1 | 0.84mi |
| 703 S 16th St Temple, TX | 3.0 | 2.0 | 1090 | $1,035 | $0.95 | 15d | 1 | 0.85mi |
| 820 S 24th St Unit B Temple, TX | 3.0 | 2.5 | 1300 | $1,435 | $1.10 | 15d | 1 | 0.89mi |
| 1303 N 10th St Temple, TX | 3.0 | 1.5 | 1119 | $1,200 | $1.07 | 45d | 1 | 0.96mi |
Listing history 26 events
-
2026-06-22days on market $74,999 Active 74 DOM
-
2026-06-18days on market $74,999 Active 71 DOM
-
2026-06-17days on market $74,999 Active 70 DOM
-
2026-06-16days on market $74,999 Active 69 DOM
-
2026-06-15days on market $74,999 Active 68 DOM
-
2026-06-14days on market $74,999 Active 66 DOM
-
2026-06-10days on market $74,999 Active 63 DOM
-
2026-06-09days on market $74,999 Active 62 DOM
-
2026-06-08days on market $74,999 Active 61 DOM
-
2026-06-07days on market $74,999 Active 60 DOM
-
2026-06-03days on market $74,999 Active 56 DOM
-
2026-06-02days on market $74,999 Active 55 DOM
-
2026-06-01days on market $74,999 Active 54 DOM
-
2026-05-31days on market $74,999 Active 53 DOM
-
2026-05-30days on market $74,999 Active 52 DOM
-
2026-05-10price $74,999 583-char remark
Show marketing remark (583 chars)
INVESTOR SPECIAL!! Looking for an investment property or an opportunity to fix up a home and have instant equity, this is a rare opportunity for an “AS-IS” home. Picture 2 and 3 are AI generated photos of what could be. Overall, the home is in good condition. The previous owner has done some of the more costly improvements including the roof and HVAC. The siding needs to be replaced on the left side of the home. The comparables in the area appear to be around 135K to 145K if the home was updated and cleaned up similar to picture 3. Occupant requires 24 hour notice.
-
2026-05-01price $79,000 583-char remark
Show marketing remark (583 chars)
INVESTOR SPECIAL!! Looking for an investment property or an opportunity to fix up a home and have instant equity, this is a rare opportunity for an “AS-IS” home. Picture 2 and 3 are AI generated photos of what could be. Overall, the home is in good condition. The previous owner has done some of the more costly improvements including the roof and HVAC. The siding needs to be replaced on the left side of the home. The comparables in the area appear to be around 135K to 145K if the home was updated and cleaned up similar to picture 3. Occupant requires 24 hour notice.
-
2026-04-08$85,000 Active 583-char remark
Show marketing remark (583 chars)
INVESTOR SPECIAL!! Looking for an investment property or an opportunity to fix up a home and have instant equity, this is a rare opportunity for an “AS-IS” home. Picture 2 and 3 are AI generated photos of what could be. Overall, the home is in good condition. The previous owner has done some of the more costly improvements including the roof and HVAC. The siding needs to be replaced on the left side of the home. The comparables in the area appear to be around 135K to 145K if the home was updated and cleaned up similar to picture 3. Occupant requires 24 hour notice.
-
2011-05-02soldstatus
-
2009-11-06soldstatus $36,000 173-char remark
Show marketing remark (173 chars)
LARGE BACKYARD WITH TREES. HARDWOOD FLOORS. AVAC AND WATER HEATER IN ATTIC. RECENTLY LEVELED, CARPET INSTALLED. WASHER, DRYER AND WATER HEATER IN LARGE STORAGE SHED ON SLAB.
-
2009-10-15$39,900 173-char remark
Show marketing remark (173 chars)
LARGE BACKYARD WITH TREES. HARDWOOD FLOORS. AVAC AND WATER HEATER IN ATTIC. RECENTLY LEVELED, CARPET INSTALLED. WASHER, DRYER AND WATER HEATER IN LARGE STORAGE SHED ON SLAB.
-
2008-07-08historical
-
2008-01-08$49,900
-
2007-09-22historical
-
2007-08-08$61,900
-
2002-09-13soldstatus
ⓘ Source: listings_history table (triggers on properties + properties_extension) + one-shot
backfill from property_details.listing_events for pre-trigger history.
Tax reassessment forecast TX · Resets to sale price
- Current annual tax
- $2,579 · $215/mo
- Projected year-2 tax
- $2,579 · $215/mo
- Expected delta
- $0/yr ($0/mo · 0.0%)
ⓘ Screening estimate from a state-policy table — verify with the county assessor before closing.
Climate risk First Street
- Flood 1/10 Low FEMA zone X (unshaded) · 0% chance over 30 yrs
- Wildfire 4/10 Moderate
- Heat 7/10 Severe 7 d/yr ≥108°F today · 24 d/yr by 30 yrs out
- Wind 8/10 Severe 80% chance of damaging wind over 30 yrs
- Air quality 1/10 Low 0 unhealthy d/yr today · 0 by 30 yrs out
Nearby sold comps map
Loading sold comps map…
Walkable amenities ~0.75 mi
Loading nearby amenities…
Taxation est. · year 1
- Rental income
- $16,836
- − Mortgage interest
- −$4,201
- − Property taxes
- −$2,579
- − Insurance
- −$375
- − Repairs & maintenance
- −$1,347
- − Management
- −$1,347
- − Depreciation
- −$2,182
- Taxable income
- $4,806
- Est. tax owed @ 24.0%
- −$1,153
- After-tax cash flow
- $4,474/yr
For passive investors: Depreciation is non-cash, so a rental often shows a tax loss while cash-flowing — sheltering income. Rental losses are passive: they offset passive income freely, and up to $25,000/yr can offset ordinary (W-2) income if you actively participate and your MAGI is under $100k (phasing out to $0 by $150k); unused losses carry forward. On sale, claimed depreciation is recaptured at up to 25%, and gains may owe capital-gains tax (a 1031 exchange can defer both). Figures are a year-1 estimate at your 24.0% rate — not tax advice; consult a CPA.
Schools (NCES district)
- District
- Temple ISD
- NCES district ID
- 4842330
- Math proficiency
- 32% ▼ -8.00%
- Reading proficiency
- 31% ▼ -4.00%
- Median HH income
- $43,120
- Composite
- 26.8/100
- National rank
- #7123
- State rank
- #590 of 826 in TX
Livability — Temple
- Score
- 75/100
- State rank
- #122
- US rank
- #3814
Category grades
Schools grade is shown separately in the Schools card above.
Census & demographics
- Census place
- Temple, TX
- County
- Bell County · 345,090 people
- City population
- 96,587
- Metro
- Killeen-Temple, TX
- Population (ZIP)
- 17,752
- Household income
- $62,532
- Rent vs Own
- Severe rent burden
- 466.0
Population outlook (Bell County) Hauer SSP2
- Today (2025)
- 371,114 people
- By 2030
- 389,104 · +4.8%
- By 2040
- 420,592 · +13.3%
- By 2050
- 447,779 · +20.7%
- By 2075
- 499,130 · +34.5%
- By 2100
- 505,680 · +36.3%
Race, ethnicity, and origin ACS 2023
- Neighborhood character
- Diverse neighborhood (Simpson 0.67)
- Race & ethnicity
- White 42% Hispanic / Latino 36% Two or more races 18% Black 17% Native American 2%
- Hispanic origin (detail)
- Mexican 31% Puerto Rican 2%
- Common ancestry
- Romanian 3% Italian 2% Slovak 1%
- Foreign-born
- 6% · Canada
- Languages at home
- 79% English-only · Spanish 20%
Political lean MEDSL · Bell
- 2024 margin
- R (+16.2) · D 41.3% · R 57.6% · Other 1.1%
- 2008→2024 swing
- -6.5pp toward R · 2008: -9.8pp · 2024: -16.2pp
- All cycles
- 2024: R+16.2 2020: R+8.5 2016: R+15.1 2012: R+16.4 2008: R+9.8
Not yet ingested
- Civics
- —
Market trends
- HPI YoY
- ▼ -113.09%
- Current HPI
- 177.0555
- Rent YoY
- ▲ 3.44%
- Metro
- Killeen-Temple, TX
- State GDP YoY
- ▲ 3.95%
- F500 in state
- 110
Industry mix (Fortune 500 HQ in TX)
| Industry | F500 HQs | Revenue |
|---|---|---|
| Energy | 16 | $1,198B |
|
||
| Technology | 5 | $198B |
|
||
| Engineering / Construction | 4 | $72B |
|
||
| Energy Services | 3 | $60B |
|
||
| Utilities | 3 | $41B |
|
||
| Healthcare | 2 | $330B |
|
||
Price history
+21.2% since first listed11 events — show timeline
- 2026-05-10 Price Changed $74,999 CTXMLS
- 2026-05-01 Price Changed $79,000 CTXMLS
- 2026-04-08 Listed $85,000 CTXMLS
- 2011-05-02 Sold (Public Records) — Public Records
- 2009-11-06 Sold (MLS) $36,000 CTXMLS
- 2009-10-15 Listed $39,900 CTXMLS
- 2008-07-08 Listing Removed — CTXMLS
- 2008-01-08 Listed $49,900 CTXMLS
- 2007-09-22 Listing Removed — CTXMLS
- 2007-08-08 Listed $61,900 CTXMLS
- 2002-09-13 Sold (Public Records) — Public Records
Property tax history
+5.1%/yrLatest (2025): $2,579 · +16.0% YoY. Source: county tax records.
Cash-flow waterfall
monthlySold comps — $/sqft
last 12 mo · ≤1 miLoading sold comps…