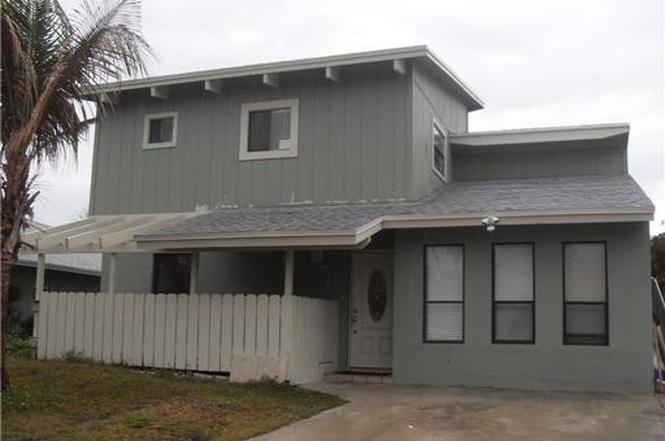
2388 Zeder Ave · Delray Beach, FL
Flood risk 1/10 · Minimal
- FEMA flood zone
- X (unshaded)
- Chance of flooding over 30 yrs
- 0.0%
- Est. flood insurance / yr
- $507 – $1,088
Fire risk 1/10 · Minimal
- Est. fire insurance / yr
- $947 – $1,759
Heat risk 9/10 · Severe
- Hot days now (above 106°F)
- 7 days/yr
- Hot days in 30 yrs
- 26 days/yr
Wind risk 10/10 · Severe
- Chance of severe wind over 30 yrs
- 99.0%
Air-quality risk 3/10 · Minor
- Unhealthy air days now
- 2 days/yr
- Unhealthy air days in 30 yrs
- 3 days/yr
Risk factors via First Street. Map © Google.
Why this score? — see what drove the D grade
The composite is a weighted blend of 9 inputs, each scored 0–100. Each bar is that input's sub-score; the figure is the points it added to the 100-point composite (weight × sub-score).
- Cash flow +13.0/30.0
- ARV discount +7.5/15.0
- Schools +4.3/10.0
- DSCR +3.9/10.0
- Livability +3.9/5.0
- Rent growth +2.9/5.0
- 1% rule +2.5/10.0
- Condition / age +2.5/5.0
- Appreciation +0.0/10.0
$720,000
🖨 Deal sheet 📄 Offer letter ✓ Due diligence
Listing remarks
RECENTLY APPRAISED OVER ASKING PRICE. NEW ROOF 2026 IMPACT GLASS WINDOWS. Welcome to 2388 Zeder Avenue, a fully remodeled contemporary home in the heart of Delray Beach. This bright and airy residence features an open kitchen ideal for entertaining and soaring volume ceilings that create a spacious feel. The layout offers excellent separation with guest bedrooms downstairs and a private primary suite upstairs. A versatile bonus area provides space for an office, storage, or lounge. Enjoy peace of mind with a new roof and full hurricane impact windows and doors. The private fenced backyard features outdoor lighting and plenty of room to relax or entertain. Located in a non-HOA neighborhood j
Key facts
- Impact glass windows
- Versatile bonus area
- New roof
Tags
Property features AI
Exterior
- Parking: Driveway; 2 parking spaces
- Utilities: Public water; Public sewer; Electricity connected; Water available; Sewer available
- Home design: Single family residence; 2 stories; Resale; North-facing
- Construction: Frame construction; Shingle roof
- Exterior features: Open patio; Patio; Deck; Not waterfront
Interior
- Kitchen: Disposal; Dishwasher; Refrigerator
- Bedrooms: 2 main-level bedrooms
- Flooring: Ceramic tile; Wood
- Bathrooms: 2 full bathrooms; 1 main-level bathroom
- Heating & cooling: Central heating (electric); Central air conditioning (electric); Ceiling fan(s)
- Interior features: High ceilings; Walk-in closet(s)
- Laundry & utility: Unfurnished
Neighborhood map
What this means for you Summary
Snapshot
- This is a 3-bed/2.0-bath single-family listed at $720k.
Deal economics
- At list price, monthly cash flow is $-34 ($-410/yr) — negative.
- To cash-flow at today's rent, offer at most $714k (0.8% below list).
- To meet the 1% rule (rent ≥ 1% of price), the offer needs to be $544k (24.5% below list).
- Recommended offer: $544k (24.5% below list) — sets the bar for 1% rule.
- Cap rate 6.2% vs local median 4.3% in Delray Beach — top-decile yield for the area; either an underpriced asset or a hidden risk that comps aren't pricing in. Stress-test before assuming the spread holds.
Location & tenants
- Location reads 77/100 on livability (#202 in FL, #3,160 nationally) — a middle-class / working-renter tenant base. Strengths: housing A+, health & safety A+, commute A-; Watch: cost of living C-, crime D-, amenities F.
- Palm Beach (suburban): math 46% / reading 53% proficiency, ranked #34 of 73 in FL (top 47%) — families likely to look elsewhere, expect single-tenant / working-renter base with shorter leases.
- Zoned schools: Pine Grove Elementary School (math 42% / reading 47%, grade F, #1,288 of 2,144 statewide, top 62%, 354 students, 79% FRL); Atlantic High School (math 28% / reading 52%, grade F, #296 of 667 statewide, top 45%, 1,889 students, 59% FRL) — zoned schools average 69% FRL vs 52% district-wide (17 pts higher); higher-poverty schools than district average — tighter screening recommended.
- Market conditions: Rents rising (+1.6%/yr); 233 active listings in the ZIP; 40 comparable units currently listed for rent nearby; rentals at typical pace (median 25d on market — plan ~3-4 weeks tenant-placement turnaround); 3,974 units permitted in Palm Beach County in 2024 (1,012 in 5+ unit buildings).
- At $5,436/mo this rent would consume 89% of the median local household income ($73k/yr) (locally 1211% of renters already pay >50% of income on rent) — very limited rent-growth headroom before tenants either downsize or default.
Forward outlook
- Local home prices are declining (-3.0%/yr); year-one equity from $5k of loan paydown is wiped out by about $22k of value loss. Plan a longer hold.
- Palm Beach County population projected at +30% by 2050 — long-run rental-demand tailwind backs the buy-and-hold thesis.
Negotiation context
- It's been on market 106 days — a 9% lower offer ($655k) is reasonable based on typical stale-listing flexibility.
- 2 sale attempts since 15y ago; this cycle's ask has dropped $75k (9%) from the opening price — seller is motivated, your offer sets the floor, not the list.
- Current owner paid $117k; list at $720k implies a 515% gain — meaningful room to come down on a strong offer.
Risks & watch-outs
- Climate carrying-cost: severe wind risk, 99% chance of damaging wind over 30y; extreme-heat days projected 7→26/yr by 2055 (HVAC capex compounding) — expect insurance premiums to compound above CPI over the hold.
Questions for the listing agent
- What do current leases actually rent for vs. the listed asking? Can we see a recent rent roll and the last 12 months of T-12 income?
- It's been on market 106 days. Have you received any prior offers? Is the seller open to a 25% concession, seller financing, or rate buy-down credit?
- Why hasn't it sold? Are there any deal-killer items the seller is aware of (foundation, flood, title, zoning, code violations)?
- Is there a deadline driving the sale (1031 exchange, divorce, estate, relocation)? That informs how much negotiation room exists.
- Schools are B-rated — typically a magnet for longer-tenancy family renters. What's the average tenant stay here, and is there a school-zone premium baked into asking?
- Crime grade is D in this area — have there been break-ins, vandalism, or insurance claims at this property in the last 3 years? What carrier currently insures it and at what premium?
- The area grade is low — what's the realistic commute time and amenity access for the typical tenant pool here? Any planned neighborhood developments (good or bad) we should know about?
- What's the average days-on-market for RENTAL listings here right now (not sales)? A rising rental-DOM trend means longer vacancies and softer asking-rent achievability than the comps imply.
- What's the recent tenant-quality profile in this submarket — average credit score on applications, eviction rate, late-payment / NSF rate, and stable-employment percentage? A property-management company in the area should have these aggregated.
- How much new for-sale + rental construction is in the pipeline within 1–3 miles? Heavy new supply typically softens prices + rents 12–24 months out; constrained supply supports both.
Investment metrics
- 1% rule
- 0.75% ✗
- Cap rate
- 6.24%
- Cash-on-cash
- -0.20%
- DSCR
- 0.99
- GRM
- 11.0
CMA / ARV
No comps found within radius.
Projected returns pro-forma
-3.0% appreciation · 1.63% rent growth · sell at horizon
- IRR
- -18.0%
- Equity multiple
- 0.37×
- Total profit
- $-126,557
- Equity at exit
- $107,354
- IRR
- -12.9%
- Equity multiple
- 0.29×
- Total profit
- $-143,801
- Equity at exit
- $62,252
Cash invested: $201,600 (down + closing). Projections, not guarantees.
Landlord ↔ Tenant lean methodology
- Overall (STATE)
- 87 Strongly Landlord-Friendly
- State Florida
- 87 Strongly Landlord-Friendly · R+3
- County
- — inherits STATE
- City
- — inherits STATE
ZIP-level market 33444
- Rents YoY
- 1.6%
- Active inventory
- 233
- Price-to-rent
- 11.0×
Monthly cashflow live
- Estimated rent
- $5,436 high interval (Pro) →
- Mortgage (P&I)
- −$3,776
- Tax from tax record
- −$253 /mo · $3,033/yr
- Insurance
- −$300
- HOA
- −$0
- Vacancy / Maint / Mgmt
- −$1,142
- Net cashflow
- $-34
Break-even live
UW: 25.0% down · 7.5% · 30yr · 1.5% tax · 5.0% vac · 8.0% maint · 8.0% mgmt
Financing live
Cash to close
- Down payment
- $180,000
- Closing costs
- $21,600
- Reserves months
- —
- Total cash needed
- —
Loan-product check · same deal, 3 products live
Conventional
25% down · 7.5% · 30yr
- Down + closing
- —
- Monthly P&I
- —
- Monthly cashflow
- —
- DSCR
- —
- Eligible?
- —
Personal DTI + credit; lowest rate.
DSCR
20% down · 8.5% · 30yr
- Down + closing
- —
- Monthly P&I
- —
- Monthly cashflow
- —
- DSCR
- —
- Eligible?
- —
No personal income docs; deal must DSCR.
Hard money
10% down · 12.0% · 12mo
- Down + closing
- —
- Monthly P&I
- —
- Monthly cashflow
- —
- DSCR
- —
- Eligible?
- —
Short-term bridge; refi at stabilization.
Rent comps 40 comps
| Address | Beds | Baths | Sqft | Rent | $/sqft | DOM | Units | Dist |
|---|---|---|---|---|---|---|---|---|
| 522 Lucky Ln Delray Beach, FL | 4.0 | 2.5 | 2034 | $7,500 | $3.69 | 24d | 1 | 0.15mi |
| 2541 Southridge Rd Delray Beach, FL | 3.0 | 3.0 | 1630 | $6,900 | $4.23 | 24d | 1 | 0.18mi |
| 722 SW 9th St Delray Beach, FL | 4.0 | 2.0 | 1446 | $2,999 | $2.07 | 24d | 1 | 0.45mi |
| 724 SW 9th St Delray Beach, FL | 4.0 | 2.0 | 1519 | $4,500 | $2.96 | 24d | 1 | 0.45mi |
| 1015 Ventnor Ave Unit 3E Delray Beach, FL | 3.0 | 2.5 | 1674 | $3,000 | $1.79 | 24d | 1 | 0.47mi |
| 450 Egret Cir Delray Beach, FL | 2.0–3.0 | 2.0–2.5 | 1369 | $5,000 | $3.65 | 17d | 3 | 0.55mi |
| 450 Egret Cir Delray Beach, FL | 2.0–3.0 | 2.0–2.5 | 1369 | $5,000 | $3.65 | 15d | 5 | 0.55mi |
| 2018 Alta Meadows Ln #405 Delray Beach, FL | 3.0 | 2.0 | 1512 | $3,300 | $2.18 | 24d | 1 | 0.61mi |
| 1920 Spanish Trl Delray Beach, FL | 3.0 | 2.5 | 1600 | $7,600 | $4.75 | 24d | 1 | 0.62mi |
| 118 SW 7th St Delray Beach, FL | 4.0 | 2.0 | 1620 | $4,000 | $2.47 | 3d | 1 | 0.67mi |
| 2016 Alta Meadows Ln #703 Delray Beach, FL | 2.0 | 2.0 | 1500 | $3,400 | $2.27 | 24d | 1 | 0.69mi |
| 2211 Florida Blvd Unit A Delray Beach, FL | 4.0 | 3.0 | 1922 | $7,000 | $3.64 | 3d | 1 | 0.70mi |
| 213 SE 9th St Delray Beach, FL | 2.0 | 1.0 | 1400 | $2,200 | $1.57 | 22d | 1 | 0.71mi |
| 802 Mallard Dr Delray Beach, FL | 2.0 | 2.0 | 1480 | $8,500 | $5.74 | 24d | 1 | 0.75mi |
| 2300 Florida Blvd Unit D Delray Beach, FL | 3.0 | 2.5 | 1592 | $4,200 | $2.64 | 24d | 1 | 0.77mi |
| 1035 SE 6th Ave #406 Delray Beach, FL | 3.0 | 2.5 | 2928 | $15,000 | $5.12 | 8d | 1 | 0.81mi |
| 2312 Spanish Trl Delray Beach, FL | 3.0 | 2.0 | 2080 | $5,000 | $2.40 | 17d | 1 | 0.83mi |
| 634 SE 3rd Ave Delray Beach, FL | 3.0 | 3.5 | 2161 | $11,000 | $5.09 | 24d | 1 | 0.84mi |
| 631 Linnet Cir Delray Beach, FL | 3.0 | 2.0 | 1534 | $4,700 | $3.06 | 24d | 1 | 0.85mi |
| 937 Banyan Dr Delray Beach, FL | 3.0 | 2.0 | 1791 | $9,700 | $5.42 | 24d | 1 | 0.87mi |
| 640 Jaeger Dr Delray Beach, FL | 3.0 | 2.0 | 1624 | $3,300 | $2.03 | 12d | 1 | 0.88mi |
| 640 Jaeger Dr Delray Beach, FL | 3.0 | 2.0 | 1624 | $3,300 | $2.03 | 24d | 1 | 0.88mi |
| 671 Lindell Blvd Delray Beach, FL | 3.0 | 2.0 | 1824 | $5,500 | $3.02 | 3d | 1 | 0.92mi |
| 2635 Frederick Blvd Delray Beach, FL | 2.0–3.0 | 2.5 | 1530 | $4,150 | $2.71 | 24d | 1 | 0.93mi |
| 541 Ibis Dr Delray Beach, FL | 3.0 | 2.5 | 1550 | $8,800 | $5.68 | 4d | 1 | 0.97mi |
| 661 Eagle Cir Delray Beach, FL | 4.0 | 2.0 | 2039 | $5,800 | $2.84 | 12d | 1 | 1.00mi |
| 1033 Brooks Ln Delray Beach, FL | 3.0 | 3.0 | 2608 | $18,000 | $6.90 | 24d | 1 | 1.02mi |
| 1315 Gallinule Dr Delray Beach, FL | 3.0 | 2.0 | 1404 | $4,700 | $3.35 | 24d | 1 | 1.03mi |
| 1050 Brooks Ln Delray Beach, FL | 4.0 | 3.5 | 2624 | $28,900 | $11.01 | 24d | 1 | 1.03mi |
| 1523 Gallinule Dr Delray Beach, FL | 3.0 | 2.0 | 1500 | $4,400 | $2.93 | 19d | 1 | 1.07mi |
| 505 Heron Dr Unit 505 Delray Beach, FL | 3.0 | 2.0 | 1435 | $4,000 | $2.79 | 24d | 1 | 1.07mi |
| 506 Heron Dr Delray Beach, FL | 4.0 | 3.0 | 2396 | $5,500 | $2.30 | 24d | 1 | 1.11mi |
| 220 S Swinton Ave Delray Beach, FL | 4.0 | 4.0 | 2954 | $30,000 | $10.16 | 24d | 1 | 1.11mi |
| 311 SE 3rd Ave Delray Beach, FL | 4.0 | 2.0 | 1607 | $8,000 | $4.98 | 12d | 1 | 1.11mi |
| 226 N Latitude Cir #205 Delray Beach, FL | 3.0 | 2.0 | 1496 | $3,150 | $2.11 | 10d | 1 | 1.12mi |
| 226 N Latitude Cir Delray Beach, FL | 1.0–3.0 | 1.5–2.0 | 1240 | $3,150 | $2.54 | 14d | 2 | 1.12mi |
| 2904 Spanish Trl Delray Beach, FL | 3.0 | 2.0 | 1500 | $5,600 | $3.73 | 24d | 1 | 1.12mi |
| 3120 E Latitude Cir Delray Beach, FL | 3.0 | 2.0–3.0 | 1550 | $4,350 | $2.81 | 22d | 2 | 1.13mi |
| 3120 E Latitude Cir #307 Delray Beach, FL | 3.0 | 3.0 | 1617 | $5,200 | $3.22 | 15d | 1 | 1.13mi |
| 2940 Florida Blvd Unit 2940 Delray Beach, FL | 3.0 | 2.5 | 1958 | $4,000 | $2.04 | 24d | 1 | 1.13mi |
Listing history 22 events
-
2026-06-18days on market $720,000 Active 106 DOM
-
2026-06-17days on market $720,000 Active 105 DOM
-
2026-06-16days on market $720,000 Active 104 DOM
-
2026-06-15days on market $720,000 Active 103 DOM
-
2026-06-13days on market $720,000 Active 101 DOM
-
2026-06-09days on market $720,000 Active 97 DOM
-
2026-06-08days on market $720,000 Active 96 DOM
-
2026-06-07days on market $720,000 Active 95 DOM
-
2026-06-04pricedays on market $720,000 Active 92 DOM
-
2026-06-03days on market $740,000 Active 91 DOM
-
2026-06-02days on market $740,000 Active 90 DOM
-
2026-06-01days on market $740,000 Active 89 DOM
-
2026-05-31days on market $740,000 Active 88 DOM
-
2026-05-05price $740,000
-
2026-04-22price $750,000
-
2026-03-31price $765,000
-
2026-03-04$795,000 Active
-
2011-06-23soldstatus $117,000
-
2011-05-15historical
-
2011-05-13$109,900
-
2005-09-07soldstatus $238,000
-
1998-05-20soldstatus $90,000
ⓘ Source: listings_history table (triggers on properties + properties_extension) + one-shot
backfill from property_details.listing_events for pre-trigger history.
Tax reassessment forecast FL · Resets to sale price
- Current annual tax
- $3,033 · $253/mo
- Projected year-2 tax
- $5,976 · $498/mo
- Expected delta
- +$2,943/yr (+$245/mo · 97.0%)
ⓘ Screening estimate from a state-policy table — verify with the county assessor before closing.
Climate risk First Street
- Flood 1/10 Low FEMA zone X (unshaded) · 0% chance over 30 yrs
- Wildfire 1/10 Low
- Heat 9/10 Extreme 7 d/yr ≥106°F today · 26 d/yr by 30 yrs out
- Wind 10/10 Extreme 99% chance of damaging wind over 30 yrs
- Air quality 3/10 Moderate 2 unhealthy d/yr today · 3 by 30 yrs out
Nearby sold comps map
Loading sold comps map…
Walkable amenities ~0.75 mi
Loading nearby amenities…
Taxation est. · year 1
- Rental income
- $65,230
- − Mortgage interest
- −$40,331
- − Property taxes
- −$3,033
- − Insurance
- −$3,600
- − Repairs & maintenance
- −$5,218
- − Management
- −$5,218
- − Depreciation
- −$20,945
- Taxable loss
- −$13,116
- Est. tax savings @ 24.0%
- +$3,148
- After-tax cash flow
- $2,738/yr
For passive investors: Depreciation is non-cash, so a rental often shows a tax loss while cash-flowing — sheltering income. Rental losses are passive: they offset passive income freely, and up to $25,000/yr can offset ordinary (W-2) income if you actively participate and your MAGI is under $100k (phasing out to $0 by $150k); unused losses carry forward. On sale, claimed depreciation is recaptured at up to 25%, and gains may owe capital-gains tax (a 1031 exchange can defer both). Figures are a year-1 estimate at your 24.0% rate — not tax advice; consult a CPA.
Schools (NCES district)
- District
- Palm Beach
- NCES district ID
- 1201500
- Math proficiency
- 46% ▼ -16.00%
- Reading proficiency
- 53% ▼ -4.00%
- Median HH income
- $53,943
- Composite
- 42.72/100
- National rank
- #3160
- State rank
- #34 of 73 in FL
Livability — Delray Beach
- Score
- 77/100
- State rank
- #202
- US rank
- #3160
Category grades
Schools grade is shown separately in the Schools card above.
Census & demographics
- Census place
- Delray Beach, FL
- County
- Palm Beach County · 1,438,312 people
- City population
- 123,167
- Metro
- Miami-Fort Lauderdale-Pompano Beach, FL
- Population (ZIP)
- 22,737
- Household income
- $72,925
- Rent vs Own
- Severe rent burden
- 1211.0
Population outlook (Palm Beach County) Hauer SSP2
- Today (2025)
- 1,637,487 people
- By 2030
- 1,743,255 · +6.5%
- By 2040
- 1,948,712 · +19.0%
- By 2050
- 2,132,979 · +30.3%
- By 2075
- 2,530,027 · +54.5%
- By 2100
- 2,706,979 · +65.3%
Race, ethnicity, and origin ACS 2023
- Neighborhood character
- Diverse neighborhood (Simpson 0.64)
- Race & ethnicity
- Black 48% White 35% Hispanic / Latino 13% Two or more races 10% Asian 1%
- Hispanic origin (detail)
- Mexican 3% Puerto Rican 1% Cuban 1%
- Common ancestry
- Hispanic 17% Romanian 2% Italian 2%
- Foreign-born
- 24% · Canada, Jamaica
- Languages at home
- 70% English-only · French/Haitian/Cajun 18% Spanish 11% Other Indo-European 1%
Political lean MEDSL · Palm Beach
- 2024 margin
- Toss-up / Even · D 50.0% · R 49.2%
- 2008→2024 swing
- -22.1pp toward R · 2008: 22.9pp · 2024: 0.8pp
- All cycles
- 2024: D+0.8 2020: D+12.8 2016: D+15.3 2012: D+17.0 2008: D+22.9
Not yet ingested
- Civics
- —
Market trends
- HPI YoY
- ▼ -743.16%
- Current HPI
- 415.3247
- Rent YoY
- ▲ 1.63%
- Metro
- Miami-Fort Lauderdale-Pompano Beach, FL
- State GDP YoY
- ▲ 3.28%
- F500 in state
- 36
Industry mix (Fortune 500 HQ in FL)
| Industry | F500 HQs | Revenue |
|---|---|---|
| Industrial Technology | 2 | $29B |
|
||
| Insurance | 2 | $17B |
|
||
| Retail | 1 | $60B |
|
||
| Technology Distribution | 1 | $58B |
|
||
| Homebuilding | 1 | $35B |
|
||
| Technology Manufacturing | 1 | $35B |
|
||
Price history
+722.2% since first listed9 events — show timeline
- 2026-05-05 Price Changed $740,000 Beaches MLS
- 2026-04-22 Price Changed $750,000 Beaches MLS
- 2026-03-31 Price Changed $765,000 Beaches MLS
- 2026-03-04 Listed $795,000 Beaches MLS
- 2011-06-23 Sold (MLS) $117,000 Beaches MLS
- 2011-05-15 Listing Removed — Beaches MLS
- 2011-05-13 Listed $109,900 Beaches MLS
- 2005-09-07 Sold (Public Records) $238,000 Public Records
- 1998-05-20 Sold (Public Records) $90,000 Public Records
Property tax history
+0.2%/yrLatest (2025): $3,033 · +26.0% YoY. Source: county tax records.
Cash-flow waterfall
monthlySold comps — $/sqft
last 12 mo · ≤1 miLoading sold comps…