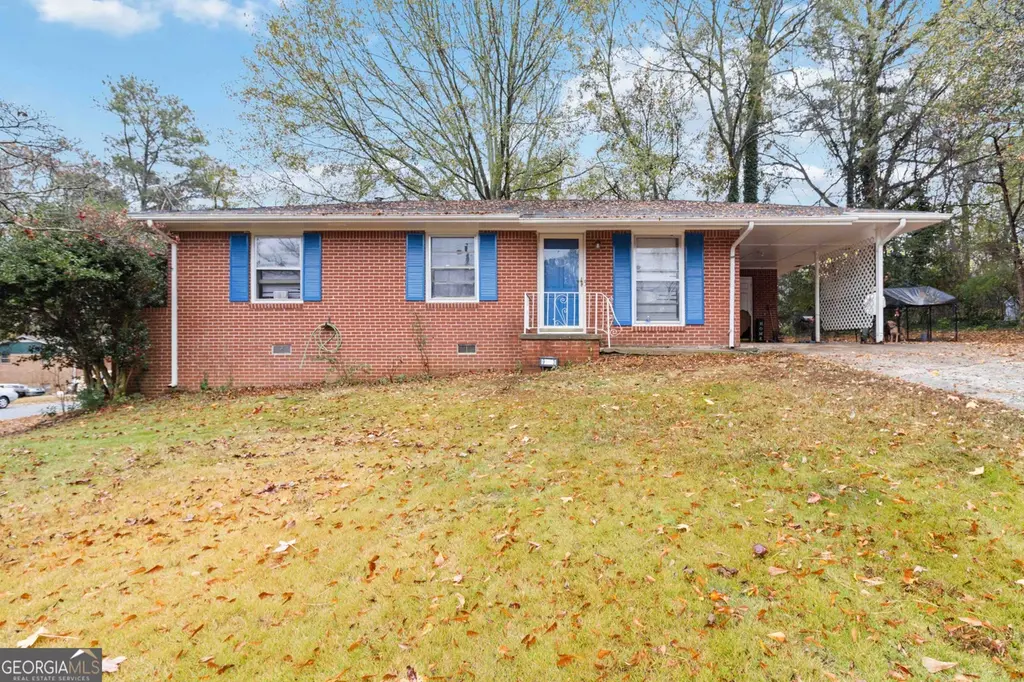
913 Longleaf Dr · Forest Park, GA
Flood risk 1/10 · Minimal
- FEMA flood zone
- X (unshaded)
- Chance of flooding over 30 yrs
- 0.0%
- Est. flood insurance / yr
- $507 – $1,088
Fire risk 2/10 · Minimal
- Est. fire insurance / yr
- $963 – $1,789
Heat risk 5/10 · Moderate
- Hot days now (above 105°F)
- 7 days/yr
- Hot days in 30 yrs
- 18 days/yr
Wind risk 5/10 · Moderate
- Chance of severe wind over 30 yrs
- 26.0%
Air-quality risk 4/10 · Minor
- Unhealthy air days now
- 4 days/yr
- Unhealthy air days in 30 yrs
- 7 days/yr
Risk factors via First Street. Map © Google.
Why this score? — see what drove the C grade
The composite is a weighted blend of 9 inputs, each scored 0–100. Each bar is that input's sub-score; the figure is the points it added to the 100-point composite (weight × sub-score).
- Cash flow +21.9/30.0
- ARV discount +15.0/15.0
- DSCR +7.0/10.0
- 1% rule +5.3/10.0
- Livability +3.2/5.0
- Condition / age +2.5/5.0
- Rent growth +2.3/5.0
- Schools +1.3/10.0
- Appreciation +0.0/10.0
$140,000
🖨 Deal sheet 📄 Offer letter ✓ Due diligence
Listing remarks MLS
Excellent investor-friendly opportunity in a quiet, well-kept neighborhood! This 3-bed, 1-bath ranch-style home is conveniently located near the airport, major interstates, and grocery stores, offering strong rental potential and consistent demand. The property has solid bones and plenty of room for improvement-perfect for a fix-and-flip or buy-and-hold strategy. A great addition to any investor's portfolio!
Key facts
- Solid bones
- Quiet neighborhood
- 0.24 acre lot
Tags
Neighborhood map
What this means for you Summary
Snapshot
- This is a 3-bed/1.0-bath single-family listed at $140k.
Deal economics
- At list price, monthly cash flow is $220 ($3k/yr) — positive.
- The deal already cash-flows at list — no discount required.
- Meets the 1% rule at list price ($1k rent vs $140k).
- Recommended offer: $138k (1.5% below list) — sets the bar for market timing.
- Cap rate 8.2% vs local median 5.2% in Forest Park — top-decile yield for the area; either an underpriced asset or a hidden risk that comps aren't pricing in. Stress-test before assuming the spread holds.
Location & tenants
- Location reads 65/100 on livability (#209 in GA) — a middle-class / working-renter tenant base. Strengths: cost of living A+, housing A+, health & safety A-; Watch: schools F, crime F, commute F.
- Clayton County (suburban): math 11% / reading 20% proficiency, ranked #155 of 174 in GA (top 89%) — low school quality limits family demand, transient renter base, plan for 1-2y turnover; 78% free/reduced lunch — lower-income household profile, screen leases tightly.
- Market conditions: Rents soft (-1.0%/yr); 128 active listings in the ZIP; 40 comparable units currently listed for rent nearby; rentals at typical pace (median 25d on market — plan ~3-4 weeks tenant-placement turnaround); 865 units permitted in Clayton County in 2024 (448 in 5+ unit buildings).
- This rent runs 38% of the median local income ($45k/yr) — at the standard rent-burdened threshold; future hikes will face affordability resistance.
Forward outlook
- Local home prices are declining (-3.0%/yr); year-one equity from $968 of loan paydown is wiped out by about $4k of value loss. Plan a longer hold.
- Clayton County population projected at +29% by 2050 — long-run rental-demand tailwind backs the buy-and-hold thesis.
Negotiation context
- It's been on market 28 days — a 2% lower offer ($138k) is reasonable based on typical stale-listing flexibility.
- 7 sale attempts since 4y ago; this cycle's ask has dropped $20k (12%) from the opening price — seller is motivated, your offer sets the floor, not the list.
Risks & watch-outs
- Climate carrying-cost: moderate wind risk, 26% chance of damaging wind over 30y; extreme-heat days projected 7→18/yr by 2055 (HVAC capex compounding) — expect insurance premiums to compound above CPI over the hold.
Questions for the listing agent
- Built in 1960 — when were the roof, HVAC, electrical panel, plumbing, and water heater last replaced?
- Is there a deadline driving the sale (1031 exchange, divorce, estate, relocation)? That informs how much negotiation room exists.
- Schools are F-rated, which usually means shorter tenancies and higher turnover. Who's the typical renter profile here, and what's been the actual vacancy rate?
- Crime grade is F in this area — have there been break-ins, vandalism, or insurance claims at this property in the last 3 years? What carrier currently insures it and at what premium?
- What's the average days-on-market for RENTAL listings here right now (not sales)? A rising rental-DOM trend means longer vacancies and softer asking-rent achievability than the comps imply.
- What's the recent tenant-quality profile in this submarket — average credit score on applications, eviction rate, late-payment / NSF rate, and stable-employment percentage? A property-management company in the area should have these aggregated.
- How much new for-sale + rental construction is in the pipeline within 1–3 miles? Heavy new supply typically softens prices + rents 12–24 months out; constrained supply supports both.
Investment metrics
- 1% rule
- 1.03% ✓
- Cap rate
- 8.18%
- Cash-on-cash
- 6.74%
- DSCR
- 1.30
- GRM
- 8.1
CMA / ARV
- ARV (median comp)
- $206,447
- List price
- $140,000
- Delta
- -22.50%
- Verdict
- UNDERPRICED
- Comps
- 20 within 1.0 mi
Show comp detail 12 sales within ~0.75 mi
| Address | Dist | Beds/Ba | Sqft | Sold | Price | $/sf | Match |
|---|---|---|---|---|---|---|---|
| 816 Needle Dr | 0.23mi | 3/1.0 | 1,046 (+3%) | 10mo | $138,000 | $132 | 76 |
| 5868 Ash St | 0.31mi | 3/1.5 | 1,066 (+5%) | 12mo | $130,000 | $122 | 65 |
| 5652 Ash St | 0.60mi | 3/1.0 | 951 (-6%) | 1mo | $129,000 | $136 | 61 |
| 1159 Tamarack Trl | 0.53mi | 3/1.5 | 1,053 (+4%) | 10mo | $108,000 | $103 | 59 |
| 5707 Jefferson Ave | 0.57mi | 3/1.5 | 1,075 (+6%) | 8mo | $148,000 | $138 | 55 |
| 765 Shellnut Dr | 0.68mi | 3/2.0 | 995 (-2%) | 9mo | $194,000 | $195 | 54 |
| 552 Shellnut Dr | 0.69mi | 3/1.5 | 1,075 (+6%) | 6mo | $110,000 | $102 | 50 |
| 5679 Kite Dr | 0.61mi | 3/1.0 | 1,074 (+6%) | 14mo | $175,000 | $163 | 50 |
| 1038 Martha Dr | 0.51mi | 4/1.0 (+1) | 1,079 (+6%) | 14mo | $105,000 | $97 | 49 |
| 6192 Holiday Blvd | 0.50mi | 4/2.0 (+1) | 1,109 (+9%) | 9mo | $210,000 | $189 | 45 |
| 649 Brookwood Dr | 0.58mi | 3/1.5 | 1,156 (+14%) | 5mo | $215,000 | $186 | 44 |
| 5677 Dorsey Dr | 0.70mi | 4/2.0 (+1) | 1,002 (-1%) | 15mo | $150,000 | $150 | 44 |
Match score weights: distance 35% · size 25% · config 20% · recency 20%. Top-matched comps best support the ARV.
Projected returns pro-forma
-3.0% appreciation · 0.0% rent growth · sell at horizon
- IRR
- -9.3%
- Equity multiple
- 0.67×
- Total profit
- $-12,894
- Equity at exit
- $20,874
- IRR
- -4.2%
- Equity multiple
- 0.76×
- Total profit
- $-9,533
- Equity at exit
- $12,105
Cash invested: $39,200 (down + closing). Projections, not guarantees.
Landlord ↔ Tenant lean methodology
- Overall (STATE)
- 90 Strongly Landlord-Friendly
- State Georgia
- 90 Strongly Landlord-Friendly · R+3
- County
- — inherits STATE
- City
- — inherits STATE
ZIP-level market 30297
- Home prices YoY
- -29.5%
- Rents YoY
- -1.0%
- Active inventory
- 128
- Price-to-rent
- 8.1×
Monthly cashflow live
- Estimated rent
- $1,442 high interval (Pro) →
- Mortgage (P&I)
- −$734
- Tax from tax record
- −$127 /mo · $1,520/yr
- Insurance
- −$58
- HOA
- −$0
- Vacancy / Maint / Mgmt
- −$303
- Net cashflow
- $220
Break-even live
UW: 25.0% down · 7.5% · 30yr · 1.5% tax · 5.0% vac · 8.0% maint · 8.0% mgmt
Financing live
Cash to close
- Down payment
- $35,000
- Closing costs
- $4,200
- Reserves months
- —
- Total cash needed
- —
Loan-product check · same deal, 3 products live
Conventional
25% down · 7.5% · 30yr
- Down + closing
- —
- Monthly P&I
- —
- Monthly cashflow
- —
- DSCR
- —
- Eligible?
- —
Personal DTI + credit; lowest rate.
DSCR
20% down · 8.5% · 30yr
- Down + closing
- —
- Monthly P&I
- —
- Monthly cashflow
- —
- DSCR
- —
- Eligible?
- —
No personal income docs; deal must DSCR.
Hard money
10% down · 12.0% · 12mo
- Down + closing
- —
- Monthly P&I
- —
- Monthly cashflow
- —
- DSCR
- —
- Eligible?
- —
Short-term bridge; refi at stabilization.
Rent comps 40 comps
| Address | Beds | Baths | Sqft | Rent | $/sqft | DOM | Units | Dist |
|---|---|---|---|---|---|---|---|---|
| 956 Slash Pine Rd Unit 2 Forest Park, GA | 2.0 | 1.0 | 1134 | $1,150 | $1.01 | 12d | 1 | 0.11mi |
| 686 Morrow Rd Forest Park, GA | 3.0 | 2.0 | 1320 | $1,950 | $1.48 | 17d | 1 | 0.38mi |
| 686 Morrow Rd Forest Park, GA | 3.0 | 2.0 | 1400 | $1,950 | $1.39 | 24d | 1 | 0.38mi |
| 645 Melrose Dr Forest Park, GA | 3.0 | 1.0 | 1123 | $1,575 | $1.40 | 43d | 1 | 0.48mi |
| 640 Oakdale Dr Forest Park, GA | 3.0 | 1.0 | 1033 | $1,450 | $1.40 | 4d | 1 | 0.55mi |
| 5632 Cypress Dr Forest Park, GA | 3.0 | 1.0 | 1040 | $1,451 | $1.40 | 12d | 1 | 0.59mi |
| 5598 Ash St Forest Park, GA | 3.0 | 1.0 | 976 | $1,500 | $1.54 | 24d | 1 | 0.69mi |
| 506 Shady Ln Forest Park, GA | 3.0 | 1.5 | 990 | $1,445 | $1.46 | 24d | 1 | 0.73mi |
| 461 Old Dixie Way Forest Park, GA | 1.0–3.0 | 1.0–2.0 | 1131 | $1,400 | $1.24 | 22d | 1 | 0.83mi |
| 415 Sylvia Dr Forest Park, GA | 1.0–3.0 | 1.0–2.0 | 897 | $1,458 | $1.62 | 2d | 13 | 0.84mi |
| 6290 Flamingo Way Morrow, GA | 3.0 | 1.5 | 1152 | $1,495 | $1.30 | 43d | 1 | 0.86mi |
| 5738 Old Dixie Hwy Forest Park, GA | 1.0–2.0 | 1.0–1.5 | 996 | $1,150 | $1.15 | 43d | 24 | 0.87mi |
| 1270 Morrow Rd Morrow, GA | 3.0 | 2.0 | 1161 | $1,800 | $1.55 | 43d | 1 | 0.90mi |
| 5504 Moriah Ln Forest Park, GA | 3.0 | 2.0 | 1320 | $1,699 | $1.29 | 22d | 1 | 1.02mi |
| 6548 King George Way Morrow, GA | 2.0 | 2.0 | 1100 | $1,295 | $1.18 | 43d | 1 | 1.13mi |
| 5543 Pineridge Ct Forest Park, GA | 3.0 | 2.5 | 1408 | $1,595 | $1.13 | 24d | 1 | 1.17mi |
| 228 Morrow Rd Forest Park, GA | 1.0–3.0 | 1.0–2.5 | 1125 | $1,579 | $1.40 | 2d | 34 | 1.17mi |
| 1327 Woodstone Ter Morrow, GA | 2.0 | 2.0 | 1344 | $1,600 | $1.19 | 24d | 1 | 1.18mi |
| 1327 Woodstone Ter Unit 1327 Morrow, GA | 2.0 | 2.0 | 1344 | $1,500 | $1.12 | 24d | 1 | 1.18mi |
| 6577 Ardmoor Dr Jonesboro, GA | 3.0 | 2.0 | 1286 | $1,700 | $1.32 | 43d | 1 | 1.26mi |
| 6347 Tara Blvd Unit 88 Jonesboro, GA | 2.0 | 1.0 | 832 | $1,120 | $1.35 | 43d | 1 | 1.27mi |
| 6347 Tara Blvd Unit 97 Jonesboro, GA | 2.0 | 1.0 | 832 | $1,120 | $1.35 | 24d | 1 | 1.27mi |
| 1216 Sanders Way Morrow, GA | 3.0 | 1.5 | 1110 | $1,550 | $1.40 | 24d | 1 | 1.28mi |
| 6616 King George Way Morrow, GA | 3.0 | 2.0 | 1200 | $1,600 | $1.33 | 43d | 1 | 1.28mi |
| 850 Mount Zion Rd Jonesboro, GA | 2.0–3.0 | 1.0–1.5 | 1040 | $1,350 | $1.30 | 1d | 7 | 1.29mi |
| 855 Mount Zion Rd Apt C1 Jonesboro, GA | 3.0 | 1.5 | 1280 | $1,199 | $0.94 | 5d | 1 | 1.37mi |
| 855 Mount Zion Rd Apt E2 Jonesboro, GA | 2.0 | 1.5 | 1159 | $999 | $0.86 | 5d | 1 | 1.37mi |
| 855 Mount Zion Rd Jonesboro, GA | 2.0 | 1.5 | 1159 | $1,249 | $1.08 | 43d | 1 | 1.39mi |
| 855 Mount Zion Rd Jonesboro, GA | 2.0–3.0 | 1.5 | 1219 | $1,249 | $1.02 | 15d | 5 | 1.39mi |
| 330 Arrowhead Blvd Jonesboro, GA | 1.0–3.0 | 1.0–2.5 | 1180 | $1,199 | $1.02 | 43d | 1 | 1.40mi |
| 701 Mt Zion Rd Jonesboro, GA | 2.0–3.0 | 1.5–2.0 | 1136 | $1,500 | $1.32 | 3d | 8 | 1.40mi |
| 855 Mount Zion Rd Apt G6 Jonesboro, GA | 2.0 | 1.5 | 1159 | $1,249 | $1.08 | 5d | 1 | 1.41mi |
| 276 Upper Riverdale Rd Jonesboro, GA | 1.0–2.0 | 1.0–1.5 | 984 | $1,280 | $1.30 | 2d | 8 | 1.42mi |
| 275 Upper Riverdale Rd Unit A76 Jonesboro, GA | 2.0 | 2.0 | 832 | $1,200 | $1.44 | 43d | 1 | 1.43mi |
| 6252 N Lee St Unit 42 Morrow, GA | 2.0 | 1.0 | 900 | $1,249 | $1.39 | 3d | 1 | 1.44mi |
| 6252 N Lee St Unit 56 Morrow, GA | 2.0 | 1.0 | 900 | $1,279 | $1.42 | 3d | 1 | 1.44mi |
| 6252 N Lee St Apt 54 Morrow, GA | 2.0 | 1.0 | 900 | $1,249 | $1.39 | 24d | 1 | 1.44mi |
| 6252 N Lee St Morrow, GA | 1.0–2.0 | 1.0 | 850 | $1,279 | $1.50 | 5d | 3 | 1.45mi |
| 6252 N Lee St Unit 30 Morrow, GA | 2.0 | 1.0 | 900 | $1,279 | $1.42 | 24d | 1 | 1.46mi |
| 275 Upper Riverdale Rd Unit A50 Jonesboro, GA | 2.0 | 1.0 | 768 | $1,205 | $1.57 | 5d | 1 | 1.48mi |
Listing history 33 events
-
2026-06-18days on market $140,000 Active 28 DOM
-
2026-06-17days on market $140,000 Active 27 DOM
-
2026-06-16days on market $140,000 Active 26 DOM
-
2026-06-15days on market $140,000 Active 25 DOM
-
2026-06-13days on market $140,000 Active 23 DOM
-
2026-06-09days on market $140,000 Active 19 DOM
-
2026-06-08days on market $140,000 Active 18 DOM
-
2026-06-07days on market $140,000 Active 17 DOM
-
2026-06-04days on market $140,000 Active 14 DOM
-
2026-06-03days on market $140,000 Active 13 DOM
-
2026-06-02days on market $140,000 Active 12 DOM
-
2026-06-01days on market $140,000 Active 11 DOM
-
2026-05-31days on market $140,000 Active 10 DOM
-
2026-02-10$160,000 Price Change 411-char remark
Show marketing remark (411 chars)
Excellent investor-friendly opportunity in a quiet, well-kept neighborhood! This 3-bed, 1-bath ranch-style home is conveniently located near the airport, major interstates, and grocery stores, offering strong rental potential and consistent demand. The property has solid bones and plenty of room for improvement-perfect for a fix-and-flip or buy-and-hold strategy. A great addition to any investor's portfolio!
-
2026-02-08historical
-
2026-01-24price $169,900
-
2025-12-13price $173,900
-
2025-11-26price $178,900
-
2025-11-08$185,000 New
-
2025-02-25historical
-
2025-02-25historical
-
2025-01-06$175,000 New
-
2025-01-06$175,000 Active
-
2023-01-18soldstatus $155,000 Sold
-
2023-01-18soldstatus $155,000
-
2022-12-16status Under Contract
-
2022-12-08price $159,000
-
2022-12-03status Back On Market
-
2022-11-04historical On Hold
-
2022-10-31status Back On Market
-
2022-10-28historical On Hold
-
2022-07-27$186,000 New
-
2006-05-11soldstatus $68,500
ⓘ Source: listings_history table (triggers on properties + properties_extension) + one-shot
backfill from property_details.listing_events for pre-trigger history.
Tax reassessment forecast GA · Resets to sale price
- Current annual tax
- $1,520 · $127/mo
- Projected year-2 tax
- $1,520 · $127/mo
- Expected delta
- $0/yr ($0/mo · 0.0%)
ⓘ Screening estimate from a state-policy table — verify with the county assessor before closing.
Climate risk First Street
- Flood 1/10 Low FEMA zone X (unshaded) · 0% chance over 30 yrs
- Wildfire 2/10 Low
- Heat 5/10 Major 7 d/yr ≥105°F today · 18 d/yr by 30 yrs out
- Wind 5/10 Major 26% chance of damaging wind over 30 yrs
- Air quality 4/10 Moderate 4 unhealthy d/yr today · 7 by 30 yrs out
Nearby sold comps map
Loading sold comps map…
Walkable amenities ~0.75 mi
Loading nearby amenities…
Taxation est. · year 1
- Rental income
- $17,308
- − Mortgage interest
- −$7,842
- − Property taxes
- −$1,520
- − Insurance
- −$700
- − Repairs & maintenance
- −$1,385
- − Management
- −$1,385
- − Depreciation
- −$4,073
- Taxable income
- $403
- Est. tax owed @ 24.0%
- −$97
- After-tax cash flow
- $2,546/yr
For passive investors: Depreciation is non-cash, so a rental often shows a tax loss while cash-flowing — sheltering income. Rental losses are passive: they offset passive income freely, and up to $25,000/yr can offset ordinary (W-2) income if you actively participate and your MAGI is under $100k (phasing out to $0 by $150k); unused losses carry forward. On sale, claimed depreciation is recaptured at up to 25%, and gains may owe capital-gains tax (a 1031 exchange can defer both). Figures are a year-1 estimate at your 24.0% rate — not tax advice; consult a CPA.
Schools (NCES district)
- District
- Clayton County
- NCES district ID
- 1301230
- Math proficiency
- 11% ▼ -13.00%
- Reading proficiency
- 20% ▼ -9.00%
- Median HH income
- $42,266
- Composite
- 13.41/100
- National rank
- #9527
- State rank
- #155 of 174 in GA
Livability — Forest Park
- Score
- 65/100
- State rank
- #209
- US rank
- #12698
Category grades
Schools grade is shown separately in the Schools card above.
Census & demographics
- Census place
- Forest Park, GA
- County
- Clayton County · 230,153 people
- City population
- 29,210
- Metro
- Atlanta-Sandy Springs-Alpharetta, GA
- Population (ZIP)
- 29,210
- Household income
- $45,124
- Rent vs Own
- Severe rent burden
- 1359.0
Population outlook (Clayton County) Hauer SSP2
- Today (2025)
- 310,777 people
- By 2030
- 329,762 · +6.1%
- By 2040
- 368,052 · +18.4%
- By 2050
- 401,196 · +29.1%
- By 2075
- 472,488 · +52.0%
- By 2100
- 500,446 · +61.0%
Race, ethnicity, and origin ACS 2023
- Neighborhood character
- Diverse neighborhood (Simpson 0.64)
- Race & ethnicity
- Black 52% Hispanic / Latino 27% White 10% Two or more races 10% Asian 6%
- Hispanic origin (detail)
- Mexican 19%
- Foreign-born
- 18% · Canada, Vietnam, Jamaica
- Languages at home
- 67% English-only · Spanish 26% Vietnamese 5% Other Asian/Pacific 1%
Political lean MEDSL · Clayton
- 2024 margin
- Solid D (+69.2) · D 84.3% · R 15.1%
- 2008→2024 swing
- +2.8pp toward D · 2008: 66.4pp · 2024: 69.2pp
- All cycles
- 2024: D+69.2 2020: D+70.9 2016: D+71.9 2012: D+70.1 2008: D+66.4
Not yet ingested
- Civics
- —
Market trends
- HPI YoY
- ▼ -96.04%
- Current HPI
- 229.5016
- Rent YoY
- ▼ -0.96%
- Metro
- Atlanta-Sandy Springs-Alpharetta, GA
- State GDP YoY
- ▲ 2.66%
- F500 in state
- 28
Industry mix (Fortune 500 HQ in GA)
| Industry | F500 HQs | Revenue |
|---|---|---|
| Paper / Packaging | 2 | $29B |
|
||
| Retail | 1 | $160B |
|
||
| Transportation / Logistics | 1 | $91B |
|
||
| Airlines | 1 | $62B |
|
||
| Consumer Goods | 1 | $47B |
|
||
| Utilities | 1 | $25B |
|
||
Price history
+133.6% since first listed20 events — show timeline
- 2026-02-10 Listed $160,000 GAMLS
- 2026-02-08 Listing Removed — GAMLS
- 2026-01-24 Price Changed $169,900 GAMLS
- 2025-12-13 Price Changed $173,900 GAMLS
- 2025-11-26 Price Changed $178,900 GAMLS
- 2025-11-08 Listed $185,000 GAMLS
- 2025-02-25 Listing Removed — FMLS
- 2025-02-25 Listing Removed — GAMLS
- 2025-01-06 Listed $175,000 FMLS
- 2025-01-06 Listed $175,000 GAMLS
- 2023-01-18 Sold (Public Records) $155,000 Public Records
- 2023-01-18 Sold (MLS) $155,000 GAMLS
- 2022-12-16 Pending — GAMLS
- 2022-12-08 Price Changed $159,000 GAMLS
- 2022-12-03 Relisted — GAMLS
- 2022-11-04 Delisted — GAMLS
- 2022-10-31 Relisted — GAMLS
- 2022-10-28 Delisted — GAMLS
- 2022-07-27 Listed $186,000 GAMLS
- 2006-05-11 Sold (Public Records) $68,500 Public Records
Property tax history
+2.9%/yrLatest (2025): $1,520 · +2.8% YoY. Source: county tax records.
Cash-flow waterfall
monthlySold comps — $/sqft
last 12 mo · ≤1 miLoading sold comps…