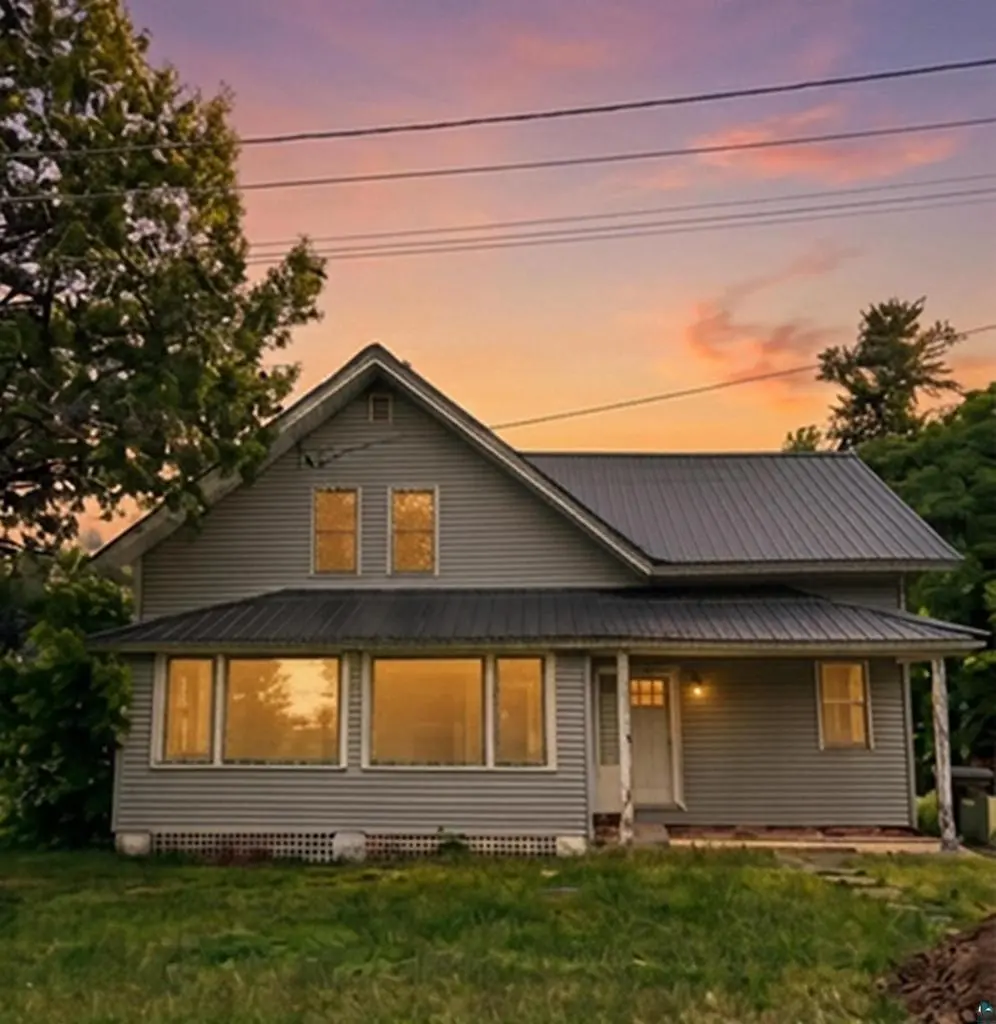
140 Wisconsin Ave · Montreal, WI
Flood risk 1/10 · Minimal
- FEMA flood zone
- X (unshaded)
- Chance of flooding over 30 yrs
- 0.0%
- Est. flood insurance / yr
- $473 – $860
Fire risk 1/10 · Minimal
- Est. fire insurance / yr
- $636 – $1,182
Heat risk 1/10 · Minimal
- Hot days now (above 90°F)
- 7 days/yr
- Hot days in 30 yrs
- 13 days/yr
Wind risk 1/10 · Minimal
- Chance of severe wind over 30 yrs
- —
Air-quality risk 1/10 · Minimal
- Unhealthy air days now
- 0 days/yr
- Unhealthy air days in 30 yrs
- 0 days/yr
Risk factors via First Street. Map © Google.
Why this score? — see what drove the B grade
The composite is a weighted blend of 9 inputs, each scored 0–100. Each bar is that input's sub-score; the figure is the points it added to the 100-point composite (weight × sub-score).
- Cash flow +30.0/30.0
- DSCR +10.0/10.0
- 1% rule +8.2/10.0
- ARV discount +7.5/15.0
- Appreciation +6.6/10.0
- Schools +3.6/10.0
- Livability +3.2/5.0
- Rent growth +2.5/5.0
- Condition / age +2.5/5.0
$110,000
🖨 Deal sheet 📄 Offer letter ✓ Due diligence
Listing remarks MLS
* * Excellent investment opportunity in Montreal, WI! * * This spacious duplex features a durable metal roof, low-maintenance exterior, boiler is only 2 years old and plenty of potential for both investors and owner-occupants. While some cosmetic updates could further enhance the property, it is move-in ready and positioned to generate rental income immediately. The duplex layout offers flexibility for rental income, multi-generational living, or owner occupancy. With strong rental demand in the area, this property presents an excellent opportunity to build equity while producing cash flow. Conveniently located near local amenities, outdoor recreation, and year-round Northwoods attractions, this property is ideal for investors seeking an affordable income-producing property with upside potential. * * Move-in ready, income-producing, and full of opportunity—don't miss your chance to own this versatile duplex in the heart of Montreal! * *
Key facts
- Large windows
- Covered front porch
- Metal roof
Tags
Property features AI
Exterior
- Home design: 1.5-story single-family home
- Exterior features: 0.43-acre lot
Interior
- Kitchen: Kitchen on Upper (15 x 9)
- Bedrooms: Bedroom 2 on Main (10 x 11); Bedroom 3 on Main (9 x 13); Bedroom 4 on Upper (14 x 6); Bedroom 5 on Upper (15 x 11)
- Bathrooms: One full bathroom; One 3/4 bathroom
- Interior features: Living room (23 x 14); Pantry (3 x 4)
Neighborhood map
What this means for you Summary
Snapshot
- This is a 5-bed/2.0-bath other listed at $110k.
Deal economics
- At list price, monthly cash flow is $428 ($5k/yr) — positive.
- The deal already cash-flows at list — no discount required.
- Meets the 1% rule at list price ($1k rent vs $110k).
Location & tenants
- Location reads 64/100 on livability (#532 in WI) — a middle-class / working-renter tenant base. Strengths: cost of living A+, housing A+; Watch: health & safety C-, schools D+, amenities F.
- Hurley School District (rural): math 41% / reading 46% proficiency, ranked #134 of 342 in WI (top 39%) — families likely to look elsewhere, expect single-tenant / working-renter base with shorter leases.
- Market conditions: 8 active listings in the ZIP; 62 units permitted in Iron County in 2024 (0 in 5+ unit buildings).
Forward outlook
- In year one you build about $4k of equity ($761 loan paydown + $4k appreciation (3.2% local appreciation)).
- Iron County population projected at -23% by 2050 — secular population decline; favor cash flow + early exit over multi-decade hold.
- At projected returns (3.2% appreciation + 3.0% rent growth), your $31k cash investment doubles in ~4 years — after that, you're playing with house money.
- By year 8, paydown + projected appreciation supports a ~$32k cash-out refi (75% LTV) — recoverable capital for the next deal without selling this one.
Negotiation context
- Only 9 days on market — expect competitive offers; lowballing is unlikely to land.
- 4 sale attempts with the ask held roughly flat each time — persistent listings suggest the price (not the market) is what's stuck; bring a comps-based counter.
Risks & watch-outs
- Watch-outs: built in 1930 — expect roof / HVAC / electrical / plumbing capex.
Questions for the listing agent
- Built in 1930 — when were the roof, HVAC, electrical panel, plumbing, and water heater last replaced?
- Is there a deadline driving the sale (1031 exchange, divorce, estate, relocation)? That informs how much negotiation room exists.
- Schools are D-rated, which usually means shorter tenancies and higher turnover. Who's the typical renter profile here, and what's been the actual vacancy rate?
- What's the average days-on-market for RENTAL listings here right now (not sales)? A rising rental-DOM trend means longer vacancies and softer asking-rent achievability than the comps imply.
- What's the recent tenant-quality profile in this submarket — average credit score on applications, eviction rate, late-payment / NSF rate, and stable-employment percentage? A property-management company in the area should have these aggregated.
- How much new for-sale + rental construction is in the pipeline within 1–3 miles? Heavy new supply typically softens prices + rents 12–24 months out; constrained supply supports both.
Investment metrics
- 1% rule
- 1.32% ✓
- Cap rate
- 10.96%
- Cash-on-cash
- 16.69%
- DSCR
- 1.74
- GRM
- 6.3
CMA / ARV
No comps found within radius.
Projected returns pro-forma
3.25% appreciation · 3.0% rent growth · sell at horizon
- IRR
- 23.7%
- Equity multiple
- 2.36×
- Total profit
- $41,979
- Equity at exit
- $51,010
- IRR
- 24.3%
- Equity multiple
- 4.55×
- Total profit
- $109,437
- Equity at exit
- $79,838
Cash invested: $30,800 (down + closing). Projections, not guarantees.
Landlord ↔ Tenant lean methodology
- Overall (STATE)
- 73 Landlord-Friendly
- State Wisconsin
- 73 Landlord-Friendly · R+2
- County
- — inherits STATE
- City
- — inherits STATE
ZIP-level market 54550
- Home prices YoY
- 2.9%
- Active inventory
- 8
- Price-to-rent
- 6.3×
Monthly cashflow live
- Estimated rent
- $1,450 medium interval (Pro) →
- Mortgage (P&I)
- −$577
- Tax from tax record
- −$94 /mo · $1,131/yr
- Insurance
- −$46
- HOA
- −$0
- Vacancy / Maint / Mgmt
- −$304
- Net cashflow
- $428
Break-even live
UW: 25.0% down · 7.5% · 30yr · 1.5% tax · 5.0% vac · 8.0% maint · 8.0% mgmt
Financing live
Cash to close
- Down payment
- $27,500
- Closing costs
- $3,300
- Reserves months
- —
- Total cash needed
- —
Loan-product check · same deal, 3 products live
Conventional
25% down · 7.5% · 30yr
- Down + closing
- —
- Monthly P&I
- —
- Monthly cashflow
- —
- DSCR
- —
- Eligible?
- —
Personal DTI + credit; lowest rate.
DSCR
20% down · 8.5% · 30yr
- Down + closing
- —
- Monthly P&I
- —
- Monthly cashflow
- —
- DSCR
- —
- Eligible?
- —
No personal income docs; deal must DSCR.
Hard money
10% down · 12.0% · 12mo
- Down + closing
- —
- Monthly P&I
- —
- Monthly cashflow
- —
- DSCR
- —
- Eligible?
- —
Short-term bridge; refi at stabilization.
Listing history 8 events
-
2026-06-18days on market $110,000 Active 9 DOM
-
2026-06-17days on market $110,000 Active 8 DOM
-
2026-06-16days on market $110,000 Active 7 DOM
-
2026-06-15days on market $110,000 Active 6 DOM
-
2026-06-15days on market $110,000 Active 5 DOM
-
2026-06-13days on market $110,000 Active 4 DOM
-
2026-06-12remarks 699-char remark
-
2026-06-12$110,000 Active 3 DOM
ⓘ Source: listings_history table (triggers on properties + properties_extension) + one-shot
backfill from property_details.listing_events for pre-trigger history.
Tax reassessment forecast WI · Partial reset (capped growth)
- Current annual tax
- $1,131 · $94/mo
- Projected year-2 tax
- $1,583 · $132/mo
- Expected delta
- +$452/yr (+$38/mo · 40.0%)
ⓘ Screening estimate from a state-policy table — verify with the county assessor before closing.
Climate risk First Street
- Flood 1/10 Low FEMA zone X (unshaded) · 0% chance over 30 yrs
- Wildfire 1/10 Low
- Heat 1/10 Low 7 d/yr ≥90°F today · 13 d/yr by 30 yrs out
- Wind 1/10 Low
- Air quality 1/10 Low 0 unhealthy d/yr today · 0 by 30 yrs out
Nearby sold comps map
Loading sold comps map…
Walkable amenities ~0.75 mi
Loading nearby amenities…
Taxation est. · year 1
- Rental income
- $17,395
- − Mortgage interest
- −$6,162
- − Property taxes
- −$1,131
- − Insurance
- −$550
- − Repairs & maintenance
- −$1,392
- − Management
- −$1,392
- − Depreciation
- −$3,200
- Taxable income
- $3,569
- Est. tax owed @ 24.0%
- −$857
- After-tax cash flow
- $4,283/yr
For passive investors: Depreciation is non-cash, so a rental often shows a tax loss while cash-flowing — sheltering income. Rental losses are passive: they offset passive income freely, and up to $25,000/yr can offset ordinary (W-2) income if you actively participate and your MAGI is under $100k (phasing out to $0 by $150k); unused losses carry forward. On sale, claimed depreciation is recaptured at up to 25%, and gains may owe capital-gains tax (a 1031 exchange can defer both). Figures are a year-1 estimate at your 24.0% rate — not tax advice; consult a CPA.
Schools (NCES district)
- District
- Hurley School District
- NCES district ID
- 5506750
- Math proficiency
- 41% ▼ -10.00%
- Reading proficiency
- 46% ▲ 3.00%
- Median HH income
- $37,702
- Composite
- 36.21/100
- National rank
- #4729
- State rank
- #134 of 342 in WI
Livability — Montreal
- Score
- 64/100
- State rank
- #532
- US rank
- #13674
Category grades
Schools grade is shown separately in the Schools card above.
Census & demographics
- Census place
- Montreal, WI
- City population
- 311
- Population (ZIP)
- 655
Population outlook (Iron County) Hauer SSP2
- Today (2025)
- 5,630 people
- By 2030
- 5,446 · -3.3%
- By 2040
- 4,887 · -13.2%
- By 2050
- 4,345 · -22.8%
- By 2075
- 3,844 · -31.7%
- By 2100
- 3,561 · -36.7%
Race, ethnicity, and origin ACS 2023
- Neighborhood character
- Predominantly White (93%)
- Race & ethnicity
- White 93% Two or more races 7%
- Common ancestry
- Romanian 12% Portuguese 4% Lithuanian 2%
- Foreign-born
- 0%
Political lean MEDSL · Iron
- 2024 margin
- Strong R (+26.2) · D 36.5% · R 62.7%
- 2008→2024 swing
- -39.3pp toward R · 2008: 13.1pp · 2024: -26.2pp
- All cycles
- 2024: R+26.2 2020: R+22.6 2016: R+23.5 2012: R+0.1 2008: D+13.1
Not yet ingested
- Civics
- —
Market trends
- HPI YoY
- ▲ 3.25%
- Current HPI
- 113.6184
- Rent YoY
- —
- Metro
- —
- State GDP YoY
- ▲ 2.10%
- F500 in state
- 20
Industry mix (Fortune 500 HQ in WI)
| Industry | F500 HQs | Revenue |
|---|---|---|
| Industrial Machinery | 4 | $23B |
|
||
| Industrial Technology | 2 | $36B |
|
||
| Insurance | 1 | $36B |
|
||
| Professional Services | 1 | $19B |
|
||
| Utilities | 1 | $9B |
|
||
| Consumer Goods | 1 | $3B |
|
||
Price history
+0.0% since first listed4 events — show timeline
- 2026-06-08 Listed $110,000 LSAR
- 2026-06-08 Listed $110,000 SAAR
- 2026-06-08 Listed $110,000 LSAR
- 2026-06-08 Listed $110,000 SAAR
Property tax history
+2.9%/yrLatest (2025): $1,131 · +15.3% YoY. Source: county tax records.
Cash-flow waterfall
monthlySold comps — $/sqft
last 12 mo · ≤1 miLoading sold comps…