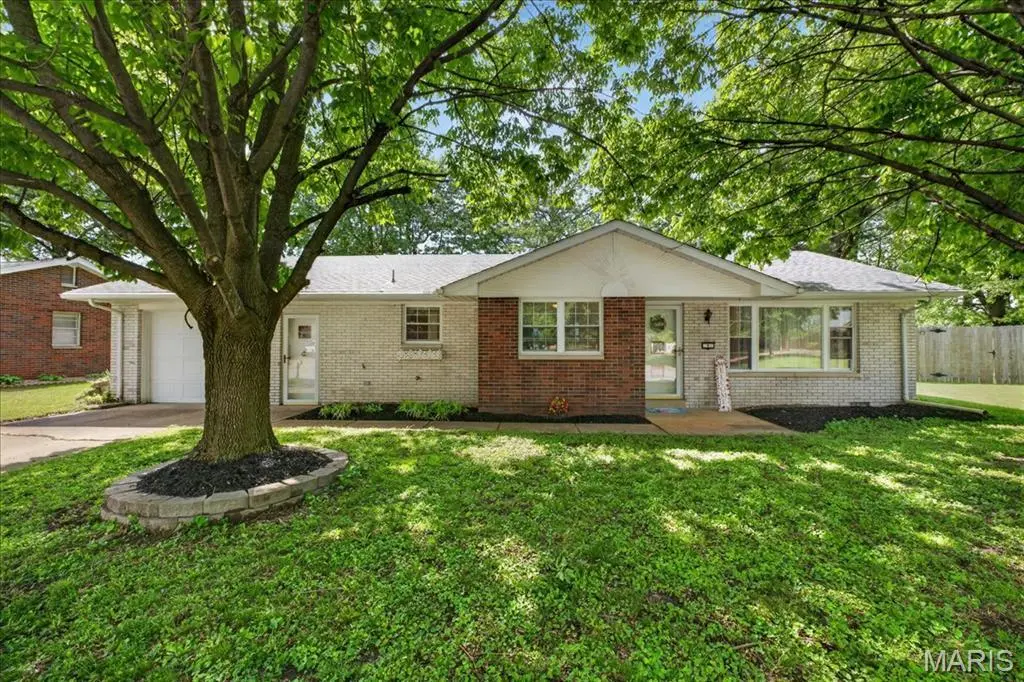
9 Debra Dr · Fairview Heights, IL
Flood risk 1/10 · Minimal
- FEMA flood zone
- X
- Chance of flooding over 30 yrs
- 0.0%
- Est. flood insurance / yr
- $507 – $1,088
Fire risk 1/10 · Minimal
- Est. fire insurance / yr
- $804 – $1,492
Heat risk 5/10 · Moderate
- Hot days now (above 108°F)
- 7 days/yr
- Hot days in 30 yrs
- 21 days/yr
Wind risk 2/10 · Minimal
- Chance of severe wind over 30 yrs
- 1.0%
Air-quality risk 3/10 · Minor
- Unhealthy air days now
- 2 days/yr
- Unhealthy air days in 30 yrs
- 4 days/yr
Risk factors via First Street. Map © Google.
Why this score? — see what drove the D- grade
The composite is a weighted blend of 9 inputs, each scored 0–100. Each bar is that input's sub-score; the figure is the points it added to the 100-point composite (weight × sub-score).
- Cash flow +14.7/30.0
- ARV discount +5.7/15.0
- DSCR +4.5/10.0
- 1% rule +3.8/10.0
- Livability +3.8/5.0
- Rent growth +2.5/5.0
- Condition / age +2.5/5.0
- Schools +2.2/10.0
- Appreciation +0.0/10.0
$169,900
🖨 Deal sheet 📄 Offer letter ✓ Due diligence
Listing remarks
Charming ranch-style home offering comfort, space, and convenience! Step inside to a spacious living room featuring newer carpeting that creates a warm and inviting atmosphere perfect for relaxing or entertaining. The large kitchen offers plenty of room for cooking and gathering, complete with an adjoining dining area ideal for everyday meals or hosting family and friends. This home blends comfort and character with newer carpeting in the living room and bedroom, along with some hardwood flooring that adds timeless appeal. An attached 1-car heated garage provides added convenience and storage and new garage door. Outside, enjoy a large backyard with endless possibilities for outdoor enterta
Key facts
- Hardwood flooring
- Bright kitchen
- Ample cabinetry
Tags
Property features AI
Finance
- Other:
- Financial info:
- HOA & community:
Exterior
- Parking: Attached garage with 1 garage space
- Security:
- Utilities: Public water; Public sewer; Electric service by Ameren; Cable available; Natural gas connected
- Home design: Single-family residence; One level
- Construction: Brick veneer exterior
- Exterior features: Back yard; Lot dimensions approximately 72 x 120 x 100 x 120
Interior
- Kitchen: Kitchen on the main level (approx. 11 x 10)
- Bedrooms: Two bedrooms on the main level (approx. 14 x 12 and 13 x 11)
- Flooring:
- Bathrooms: One full bathroom on the main level
- Heating & cooling: Forced air heating (natural gas); Central air conditioning
- Interior features: Crawl space basement
- Laundry & utility:
Neighborhood map
What this means for you Summary
Snapshot
- This is a 2-bed/2.0-bath single-family listed at $170k.
Deal economics
- At list price, monthly cash flow is $43 ($512/yr) — positive.
- The deal already cash-flows at list — no discount required.
- To meet the 1% rule (rent ≥ 1% of price), the offer needs to be $150k (12.0% below list).
- Recommended offer: $150k (12.0% below list) — sets the bar for 1% rule.
- Cap rate 6.6% vs local median 4.1% in Fairview Heights — top-decile yield for the area; either an underpriced asset or a hidden risk that comps aren't pricing in. Stress-test before assuming the spread holds.
Location & tenants
- Location reads 75/100 on livability (#225 in IL, #4,180 nationally) — a middle-class / working-renter tenant base. Strengths: commute A+, cost of living A+, housing A+; Watch: crime F, amenities F, health & safety F.
- Belleville Twp Hsd 201 (suburban): math 21% / reading 28% proficiency, ranked #308 of 620 in IL (top 50%) — low school quality limits family demand, transient renter base, plan for 1-2y turnover.
- Zoned schools: Belleville High School-East (math 23% / reading 30%, grade F, #241 of 693 statewide, top 35%, 2,568 students, 0% FRL).
- Market conditions: 81 active listings in the ZIP; 15 comparable units currently listed for rent nearby; rentals leasing fast (median 11d on market — plan ~1-2 weeks tenant-placement turnaround); solid renter incomes; 783 units permitted in St. Clair County in 2024 (378 in 5+ unit buildings).
Forward outlook
- Local home prices are declining (-3.0%/yr); year-one equity from $1k of loan paydown is wiped out by about $5k of value loss. Plan a longer hold.
- St. Clair County population projected at -23% by 2050 — secular population decline; favor cash flow + early exit over multi-decade hold.
Negotiation context
- It's been on market 44 days — a 3% lower offer ($165k) is reasonable based on typical stale-listing flexibility.
- Current owner paid $98k; list at $170k implies a 74% gain — meaningful room to come down on a strong offer.
Risks & watch-outs
- Climate carrying-cost: extreme-heat days projected 7→21/yr by 2055 (HVAC capex compounding) — expect insurance premiums to compound above CPI over the hold.
Questions for the listing agent
- It's been on market 44 days. Have you received any prior offers? Is the seller open to a 12% concession, seller financing, or rate buy-down credit?
- Built in 1962 — when were the roof, HVAC, electrical panel, plumbing, and water heater last replaced?
- Is there a deadline driving the sale (1031 exchange, divorce, estate, relocation)? That informs how much negotiation room exists.
- Schools are D-rated, which usually means shorter tenancies and higher turnover. Who's the typical renter profile here, and what's been the actual vacancy rate?
- Crime grade is F in this area — have there been break-ins, vandalism, or insurance claims at this property in the last 3 years? What carrier currently insures it and at what premium?
- The area grade is low — what's the realistic commute time and amenity access for the typical tenant pool here? Any planned neighborhood developments (good or bad) we should know about?
- What's the average days-on-market for RENTAL listings here right now (not sales)? A rising rental-DOM trend means longer vacancies and softer asking-rent achievability than the comps imply.
- What's the recent tenant-quality profile in this submarket — average credit score on applications, eviction rate, late-payment / NSF rate, and stable-employment percentage? A property-management company in the area should have these aggregated.
- How much new for-sale + rental construction is in the pipeline within 1–3 miles? Heavy new supply typically softens prices + rents 12–24 months out; constrained supply supports both.
Investment metrics
- 1% rule
- 0.88% ✗
- Cap rate
- 6.59%
- Cash-on-cash
- 1.08%
- DSCR
- 1.05
- GRM
- 9.5
CMA / ARV
- ARV (on-the-fly)
- $163,324
- Comps found
- 12
Show comp detail 12 sales within ~0.75 mi
| Address | Dist | Beds/Ba | Sqft | Sold | Price | $/sf | Match |
|---|---|---|---|---|---|---|---|
| 9 Hyde Park Rd | 0.23mi | 2/2.0 | 1,232 (+0%) | 3mo | $175,000 | $142 | 87 |
| 8 Hermitage Dr | 0.30mi | 3/1.0 (+1) | 1,200 (-2%) | 7mo | $149,900 | $125 | 68 |
| 28 Countryside Ln | 0.12mi | 3/1.5 (+1) | 1,131 (-8%) | 12mo | $150,000 | $133 | 65 |
| 14 Kadlec Dr | 0.65mi | 3/2.0 (+1) | 1,240 (+1%) | 1mo | $149,000 | $120 | 62 |
| 147 Frey Ln | 0.24mi | 3/1.5 (+1) | 1,322 (+8%) | 9mo | $155,000 | $117 | 62 |
| 6446 Old Collinsville Rd | 0.56mi | 2/2.0 | 1,275 (+4%) | 10mo | $170,000 | $133 | 60 |
| 504 Joseph Dr | 0.71mi | 2/1.5 | 1,296 (+6%) | 1mo | $149,900 | $116 | 55 |
| 6104 Old Collinsville Rd | 0.54mi | 3/1.5 (+1) | 1,325 (+8%) | 3mo | $159,900 | $121 | 52 |
| 119 Homestead | 0.61mi | 3/1.0 (+1) | 1,250 (+2%) | 11mo | $172,000 | $138 | 50 |
| 802 Coral Dr | 0.56mi | 3/2.0 (+1) | 1,120 (-9%) | 5mo | $175,000 | $156 | 50 |
| 405 Joseph Dr Unit G | 0.62mi | 3/1.5 (+1) | 1,320 (+8%) | 6mo | $164,500 | $125 | 47 |
| 312 Frey Ln | 0.38mi | 3/1.0 (+1) | 1,083 (-12%) | 9mo | $160,000 | $148 | 46 |
Match score weights: distance 35% · size 25% · config 20% · recency 20%. Top-matched comps best support the ARV.
Projected returns pro-forma
-3.0% appreciation · 3.0% rent growth · sell at horizon
- IRR
- -14.6%
- Equity multiple
- 0.48×
- Total profit
- $-24,812
- Equity at exit
- $25,333
- IRR
- -5.9%
- Equity multiple
- 0.62×
- Total profit
- $-18,103
- Equity at exit
- $14,690
Cash invested: $47,572 (down + closing). Projections, not guarantees.
Landlord ↔ Tenant lean methodology
- Overall (STATE)
- 43 Moderately Tenant-Leaning
- State Illinois
- 43 Moderately Tenant-Leaning · D+7
- County
- — inherits STATE
- City
- — inherits STATE
ZIP-level market 62208
- Home prices YoY
- -34.2%
- Active inventory
- 81
- Price-to-rent
- 9.5×
Monthly cashflow live
- Estimated rent
- $1,495 high interval (Pro) →
- Mortgage (P&I)
- −$891
- Tax from tax record
- −$177 /mo · $2,123/yr
- Insurance
- −$71
- HOA
- −$0
- Vacancy / Maint / Mgmt
- −$314
- Net cashflow
- $43
Break-even live
UW: 25.0% down · 7.5% · 30yr · 1.5% tax · 5.0% vac · 8.0% maint · 8.0% mgmt
Financing live
Cash to close
- Down payment
- $42,475
- Closing costs
- $5,097
- Reserves months
- —
- Total cash needed
- —
Loan-product check · same deal, 3 products live
Conventional
25% down · 7.5% · 30yr
- Down + closing
- —
- Monthly P&I
- —
- Monthly cashflow
- —
- DSCR
- —
- Eligible?
- —
Personal DTI + credit; lowest rate.
DSCR
20% down · 8.5% · 30yr
- Down + closing
- —
- Monthly P&I
- —
- Monthly cashflow
- —
- DSCR
- —
- Eligible?
- —
No personal income docs; deal must DSCR.
Hard money
10% down · 12.0% · 12mo
- Down + closing
- —
- Monthly P&I
- —
- Monthly cashflow
- —
- DSCR
- —
- Eligible?
- —
Short-term bridge; refi at stabilization.
Rent comps 15 comps
| Address | Beds | Baths | Sqft | Rent | $/sqft | DOM | Units | Dist |
|---|---|---|---|---|---|---|---|---|
| 106 Autumn Pine Dr Apt 3 Fairview Heights, IL | 2.0 | 1.0 | 1100 | $1,095 | $1.00 | 14d | 1 | 0.59mi |
| 21 Northbrook Cir Fairview Heights, IL | 1.0–2.0 | 1.0–2.0 | 892 | $1,680 | $1.88 | 1d | 6 | 0.86mi |
| 89 Peachtree Ln Fairview Heights, IL | 2.0 | 1.0 | 832 | $1,150 | $1.38 | 23d | 1 | 1.05mi |
| 97 Peachtree Ln Fairview Heights, IL | 2.0 | 1.0 | 832 | $1,150 | $1.38 | 23d | 1 | 1.05mi |
| 97 Peachtree Ln Fairview Heights, IL | 2.0 | 1.0 | 832 | $1,150 | $1.38 | 1d | 1 | 1.05mi |
| 120 Dean Ave O'Fallon, IL | 2.0 | 1.0 | 1056 | $1,195 | $1.13 | 1d | 1 | 1.13mi |
| 115 Longacre Dr Unit 1 Fairview Heights, IL | 2.0 | 1.5 | 1168 | $1,450 | $1.24 | 23d | 1 | 1.17mi |
| 6 Ram Ct Fairview Heights, IL | 2.0 | 1.5 | 1100 | $1,775 | $1.61 | 23d | 1 | 1.19mi |
| 13 Edding Ln Fairview Heights, IL | 3.0 | 1.5 | 1430 | $850 | $0.59 | 12d | 1 | 1.36mi |
| 1311 West Highway 50 O'Fallon, IL | 2.0 | 1.0 | 945 | $1,300 | $1.38 | 1d | 1 | 1.40mi |
| 100 Winchester Pl Fairview Heights, IL | 1.0–2.0 | 1.0–2.0 | 950 | $1,622 | $1.71 | 1d | 21 | 1.41mi |
| 863 Harbor Woods Dr Fairview Heights, IL | 3.0 | 2.5 | 998 | $2,550 | $2.56 | 1d | 1 | 1.42mi |
| 704 Harbor Woods Dr Unit C Fairview Heights, IL | 2.0 | 2.0 | 1010 | $1,950 | $1.93 | 10d | 1 | 1.42mi |
| 704 Harbor Woods Dr Fairview Heights, IL | 2.0 | 2.0 | 1006 | $1,950 | $1.94 | 1d | 1 | 1.43mi |
| 708 Harbor Woods Dr Apt C Fairview Heights, IL | 2.0 | 2.0 | 1010 | $1,950 | $1.93 | 14d | 1 | 1.44mi |
Listing history 16 events
-
2026-06-15statusdays on market $169,900 Pending 44 DOM
-
2026-06-13days on market $169,900 Active 43 DOM
-
2026-06-09days on market $169,900 Active 39 DOM
-
2026-06-08days on market $169,900 Active 38 DOM
-
2026-06-07days on market $169,900 Active 37 DOM
-
2026-06-03days on market $169,900 Active 33 DOM
-
2026-06-02days on market $169,900 Active 32 DOM
-
2026-06-01days on market $169,900 Active 31 DOM
-
2026-05-31days on market $169,900 Active 30 DOM
-
2026-05-01$175,000 Active
-
2008-04-29soldstatus $97,500
-
2005-08-04soldstatus $100,000
-
1996-07-09soldstatus $70,000
-
1996-07-09soldstatus $70,000
-
1994-05-31soldstatus $69,500
-
1994-05-31soldstatus $69,500
ⓘ Source: listings_history table (triggers on properties + properties_extension) + one-shot
backfill from property_details.listing_events for pre-trigger history.
Tax reassessment forecast IL · Partial reset (capped growth)
- Current annual tax
- $2,123 · $177/mo
- Projected year-2 tax
- $2,990 · $249/mo
- Expected delta
- +$867/yr (+$72/mo · 40.8%)
ⓘ Screening estimate from a state-policy table — verify with the county assessor before closing.
Climate risk First Street
- Flood 1/10 Low FEMA zone X · 0% chance over 30 yrs
- Wildfire 1/10 Low
- Heat 5/10 Major 7 d/yr ≥108°F today · 21 d/yr by 30 yrs out
- Wind 2/10 Low 100% chance of damaging wind over 30 yrs
- Air quality 3/10 Moderate 2 unhealthy d/yr today · 4 by 30 yrs out
Nearby sold comps map
Loading sold comps map…
Walkable amenities ~0.75 mi
Loading nearby amenities…
Taxation est. · year 1
- Rental income
- $17,945
- − Mortgage interest
- −$9,517
- − Property taxes
- −$2,123
- − Insurance
- −$850
- − Repairs & maintenance
- −$1,436
- − Management
- −$1,436
- − Depreciation
- −$4,943
- Taxable loss
- −$2,359
- Est. tax savings @ 24.0%
- +$566
- After-tax cash flow
- $1,078/yr
For passive investors: Depreciation is non-cash, so a rental often shows a tax loss while cash-flowing — sheltering income. Rental losses are passive: they offset passive income freely, and up to $25,000/yr can offset ordinary (W-2) income if you actively participate and your MAGI is under $100k (phasing out to $0 by $150k); unused losses carry forward. On sale, claimed depreciation is recaptured at up to 25%, and gains may owe capital-gains tax (a 1031 exchange can defer both). Figures are a year-1 estimate at your 24.0% rate — not tax advice; consult a CPA.
Schools (NCES district)
- District
- Belleville Twp Hsd 201
- NCES district ID
- 1705640
- Math proficiency
- 21% ▼ -8.00%
- Reading proficiency
- 28% ▼ -3.00%
- Median HH income
- $58,064
- Composite
- 22.39/100
- National rank
- #8115
- State rank
- #308 of 620 in IL
Livability — Fairview Heights
- Score
- 75/100
- State rank
- #225
- US rank
- #4180
Category grades
Schools grade is shown separately in the Schools card above.
Census & demographics
- Census place
- Fairview Heights, IL
- County
- Saint Clair County · 169,691 people
- City population
- 16,821
- Metro
- St. Louis, MO-IL
- Population (ZIP)
- 16,821
- Household income
- $80,205
- Rent vs Own
- Severe rent burden
- 555.0
Population outlook (St. Clair County) Hauer SSP2
- Today (2025)
- 250,366 people
- By 2030
- 240,511 · -3.9%
- By 2040
- 217,391 · -13.2%
- By 2050
- 192,699 · -23.0%
- By 2075
- 140,637 · -43.8%
- By 2100
- 100,499 · -59.9%
Race, ethnicity, and origin ACS 2023
- Neighborhood character
- Diverse neighborhood (Simpson 0.64)
- Race & ethnicity
- White 50% Black 33% Two or more races 11% Asian 3% Hispanic / Latino 3%
- Common ancestry
- Lithuanian 2% Romanian 2% Slovak 2%
- Foreign-born
- 4% · Canada, South Korea, Jamaica
- Languages at home
- 96% English-only · Spanish 2% Arabic 1%
Political lean MEDSL · St. Clair
- 2024 margin
- Lean D (+7.9) · D 53.0% · R 45.1% · Other 1.8%
- 2008→2024 swing
- -14.6pp toward R · 2008: 22.4pp · 2024: 7.9pp
- All cycles
- 2024: D+7.9 2020: D+8.7 2016: D+5.6 2012: D+14.5 2008: D+22.4
Not yet ingested
- Civics
- —
Market trends
- HPI YoY
- ▼ -71.14%
- Current HPI
- 136.8631
- Rent YoY
- —
- Metro
- St. Louis, MO-IL
- State GDP YoY
- ▲ 1.59%
- F500 in state
- 60
Industry mix (Fortune 500 HQ in IL)
| Industry | F500 HQs | Revenue |
|---|---|---|
| Insurance | 4 | $201B |
|
||
| Consumer Goods | 4 | $87B |
|
||
| Industrial Machinery | 3 | $64B |
|
||
| Healthcare | 2 | $55B |
|
||
| Retail / Pharmacy | 1 | $148B |
|
||
| Agriculture / Food | 1 | $86B |
|
||
Price history
+151.8% since first listed7 events — show timeline
- 2026-05-01 Listed $175,000 MARIS as Distributed by MLS Grid
- 2008-04-29 Sold (Public Records) $97,500 Public Records
- 2005-08-04 Sold (Public Records) $100,000 Public Records
- 1996-07-09 Sold (Public Records) $70,000 Public Records
- 1996-07-09 Sold (Public Records) $70,000 Public Records
- 1994-05-31 Sold (Public Records) $69,500 Public Records
- 1994-05-31 Sold (Public Records) $69,500 Public Records
Property tax history
+2.8%/yrLatest (2024): $2,123 · +10.5% YoY. Source: county tax records.
Cash-flow waterfall
monthlySold comps — $/sqft
last 12 mo · ≤1 miLoading sold comps…