 Multi-family
510 South Shore Dr · Port Isabel, TX
Flood risk 8/10 · Major
- FEMA flood zone
- AE
- Chance of flooding over 30 yrs
- 0.98%
- Est. flood insurance / yr
- $1,737 – $8,500
Fire risk 3/10 · Minor
- Est. fire insurance / yr
- $1,222 – $2,270
Heat risk 10/10 · Severe
- Hot days now (above 106°F)
- 7 days/yr
- Hot days in 30 yrs
- 26 days/yr
Wind risk 9/10 · Severe
- Chance of severe wind over 30 yrs
- 99.0%
Air-quality risk 2/10 · Minimal
- Unhealthy air days now
- 0 days/yr
- Unhealthy air days in 30 yrs
- 1 days/yr
Risk factors via First Street. Map © Google.
Why this score? — see what drove the B- grade
The composite is a weighted blend of 9 inputs, each scored 0–100. Each bar is that input's sub-score; the figure is the points it added to the 100-point composite (weight × sub-score).
- Cash flow +30.0/30.0
- 1% rule +10.0/10.0
- DSCR +10.0/10.0
- ARV discount +7.5/15.0
- Livability +3.8/5.0
- Rent growth +2.5/5.0
- Schools +1.9/10.0
- Condition / age +1.5/5.0
- Appreciation +0.0/10.0
$285,000
🖨 Deal sheet 📄 Offer letter ✓ Due diligence
Multi-family units
County records classify this as Multi-Family (2-4 Unit). Listing-text estimate: 1 unit. estimate disagrees with records
Listing remarks
Wood frame 2 story building on corner lot with 4 units consists of 2/1 in each unit. Great location with water views. Apartments require some updates. Tenants pay electricity and owner pays water. 4 electric meters and 1 water meter. Total monthly rent is $2,800.
Key facts
- Water views
- 1 water meter
- 4 electric meters
Tags
Property features AI
Exterior
- Utilities: Public water; Public sewer
- Home design: Multi-family residential (multiplex 2–10); 2 stories
- Construction: Block construction; Slab foundation
- Exterior features: Corner lot
Interior
- Heating & cooling: Has cooling (wall/window units)
- Interior features: Electric water heater; Wall/window air conditioning units
Neighborhood map
What this means for you Summary
Snapshot
- This is a multifamily listed at $285k. Condition is rated poor.
Deal economics
- At list price, monthly cash flow is $3k ($41k/yr) — positive.
- The deal already cash-flows at list — no discount required.
- Meets the 1% rule at list price ($7k rent vs $285k).
- Cap rate 22.5% vs local median 3.4% in Port Isabel — top-decile yield for the area; either an underpriced asset or a hidden risk that comps aren't pricing in. Stress-test before assuming the spread holds.
Location & tenants
- Location reads 75/100 on livability (#157 in TX, #4,282 nationally) — a middle-class / working-renter tenant base. Strengths: cost of living A+, housing A+, health & safety A+; Watch: employment D, crime F, commute F.
- Point Isabel ISD (town): math 14% / reading 31% proficiency, ranked #756 of 826 in TX (top 92%) — low school quality limits family demand, transient renter base, plan for 1-2y turnover.
- Zoned schools: Port Isabel J H (math 10% / reading 29%, grade F, #1,445 of 1,662 statewide, top 88%, 425 students, 84% FRL); Port Isabel H S (math 17% / reading 42%, grade F, #1,112 of 1,632 statewide, top 70%, 606 students, 82% FRL) — zoned schools average 83% FRL vs 35% district-wide (48 pts higher); higher-poverty schools than district average — tighter screening recommended.
- Market conditions: 254 active listings in the ZIP; 1 comparable units currently listed for rent nearby; 2,326 units permitted in Cameron County in 2024 (503 in 5+ unit buildings).
Forward outlook
- Local home prices are declining (-3.0%/yr); year-one equity from $2k of loan paydown is wiped out by about $9k of value loss. Plan a longer hold.
- Cameron County population projected at +3% by 2050 — modest demand growth; plan on rents tracking national, not racing it.
- At projected returns (-3.0% appreciation + 3.0% rent growth), your $80k cash investment doubles in ~3 years — after that, you're playing with house money.
Negotiation context
- Only 1 days on market — expect competitive offers; lowballing is unlikely to land.
Risks & watch-outs
- Watch-outs: flood insurance adds $427/mo.
- Climate carrying-cost: in FEMA flood zone AE (mandatory federal flood insurance); severe wind risk, 99% chance of damaging wind over 30y; extreme-heat days projected 7→26/yr by 2055 (HVAC capex compounding) — expect insurance premiums to compound above CPI over the hold.
Questions for the listing agent
- Have any recent inspections been done? Can we get a copy of the seller's disclosures and any deferred-maintenance estimates?
- What's the actual annual flood-insurance premium (NFIP or private), and is the property in a SFHA with mandatory coverage?
- Is there a deadline driving the sale (1031 exchange, divorce, estate, relocation)? That informs how much negotiation room exists.
- Schools are F-rated, which usually means shorter tenancies and higher turnover. Who's the typical renter profile here, and what's been the actual vacancy rate?
- Crime grade is F in this area — have there been break-ins, vandalism, or insurance claims at this property in the last 3 years? What carrier currently insures it and at what premium?
- What's the average days-on-market for RENTAL listings here right now (not sales)? A rising rental-DOM trend means longer vacancies and softer asking-rent achievability than the comps imply.
- What's the recent tenant-quality profile in this submarket — average credit score on applications, eviction rate, late-payment / NSF rate, and stable-employment percentage? A property-management company in the area should have these aggregated.
- How much new apartment / multifamily construction is in the pipeline within 1–3 miles? Heavy new supply (>2% of stock underway) typically softens rents 12–24 months out; light construction supports rent growth.
Investment metrics
- 1% rule
- 2.59% ✓
- Cap rate
- 22.51%
- Cash-on-cash
- 57.91%
- DSCR
- 3.58
- GRM
- 3.2
CMA / ARV
No comps found within radius.
Projected returns pro-forma
-3.0% appreciation · 3.0% rent growth · sell at horizon
- IRR
- 49.4%
- Equity multiple
- 3.16×
- Total profit
- $172,306
- Equity at exit
- $42,494
- IRR
- 55.0%
- Equity multiple
- 6.42×
- Total profit
- $432,416
- Equity at exit
- $24,642
Cash invested: $79,800 (down + closing). Projections, not guarantees.
Landlord ↔ Tenant lean methodology
- Overall (STATE)
- 87 Strongly Landlord-Friendly
- State Texas
- 87 Strongly Landlord-Friendly · R+5
- County
- — inherits STATE
- City
- — inherits STATE
ZIP-level market 78578
- Home prices YoY
- -21.7%
- Active inventory
- 254
- Price-to-rent
- 12.9×
Monthly cashflow live
- Estimated rent
- $7,368 medium interval (Pro) →
- Mortgage (P&I)
- −$1,495
- Tax est. 1.5%
- −$356 /mo · $4,275/yr
- Insurance
- −$119
- Flood insurance flood zone
- −$427 /mo · $5,118/yr
- HOA
- −$0
- Vacancy / Maint / Mgmt
- −$1,547
- Net cashflow
- $3,425
Break-even live
4-unit breakdown (identical units grouped — click to expand)
| Units | Beds | Baths | Est. rent |
|---|---|---|---|
| 4× units | 2 | 1 | $7,368 |
| #1 | 2 | 1 | $1,842 |
| #2 | 2 | 1 | $1,842 |
| #3 | 2 | 1 | $1,842 |
| #4 | 2 | 1 | $1,842 |
| Total (4 units) | $7,368 | ||
UW: 25.0% down · 7.5% · 30yr · 1.5% tax · 5.0% vac · 8.0% maint · 8.0% mgmt
Financing live
Cash to close
- Down payment
- $71,250
- Closing costs
- $8,550
- Reserves months
- —
- Total cash needed
- —
Loan-product check · same deal, 3 products live
Conventional
25% down · 7.5% · 30yr
- Down + closing
- —
- Monthly P&I
- —
- Monthly cashflow
- —
- DSCR
- —
- Eligible?
- —
Personal DTI + credit; lowest rate.
DSCR
20% down · 8.5% · 30yr
- Down + closing
- —
- Monthly P&I
- —
- Monthly cashflow
- —
- DSCR
- —
- Eligible?
- —
No personal income docs; deal must DSCR.
Hard money
10% down · 12.0% · 12mo
- Down + closing
- —
- Monthly P&I
- —
- Monthly cashflow
- —
- DSCR
- —
- Eligible?
- —
Short-term bridge; refi at stabilization.
Rent comps 1 comps
| Address | Beds | Baths | Sqft | Rent | $/sqft | DOM | Units | Dist |
|---|---|---|---|---|---|---|---|---|
| 1113 Pompano Ave Unit 1515052P Port Isabel, TX | 3.0 | 2.0 | 1991 | $7,195 | $3.61 | 13d | 1 | 0.77mi |
Listing history 2 events
-
2026-06-19remarks 263-char remark
-
2026-06-19$285,000 Active 1 DOM
ⓘ Source: listings_history table (triggers on properties + properties_extension) + one-shot
backfill from property_details.listing_events for pre-trigger history.
Climate risk First Street
- Flood 8/10 Severe FEMA zone AE · 98% chance over 30 yrs
- Wildfire 3/10 Moderate
- Heat 10/10 Extreme 7 d/yr ≥106°F today · 26 d/yr by 30 yrs out
- Wind 9/10 Extreme 99% chance of damaging wind over 30 yrs
- Air quality 2/10 Low 0 unhealthy d/yr today · 1 by 30 yrs out
Nearby sold comps map
Loading sold comps map…
Walkable amenities ~0.75 mi
Loading nearby amenities…
Taxation est. · year 1
- Rental income
- $88,416
- − Mortgage interest
- −$15,964
- − Property taxes
- −$4,275
- − Insurance
- −$6,544
- − Repairs & maintenance
- −$7,073
- − Management
- −$7,073
- − Depreciation
- −$8,291
- Taxable income
- $39,196
- Est. tax owed @ 24.0%
- −$9,407
- After-tax cash flow
- $31,688/yr
For passive investors: Depreciation is non-cash, so a rental often shows a tax loss while cash-flowing — sheltering income. Rental losses are passive: they offset passive income freely, and up to $25,000/yr can offset ordinary (W-2) income if you actively participate and your MAGI is under $100k (phasing out to $0 by $150k); unused losses carry forward. On sale, claimed depreciation is recaptured at up to 25%, and gains may owe capital-gains tax (a 1031 exchange can defer both). Figures are a year-1 estimate at your 24.0% rate — not tax advice; consult a CPA.
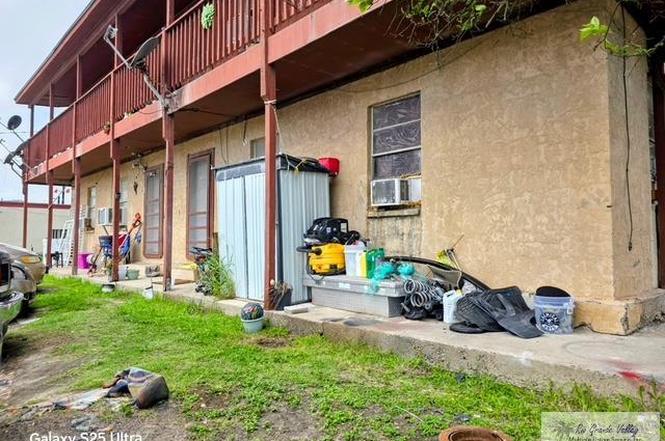
Condition & rehab AI · 10 photos
This multi-family property requires extensive repairs and updates to improve its condition and value. The property is currently in poor condition and requires significant work to bring it up to a livable standard.
Repairs flagged
- Major kitchen appliances — outdated and need replacement
- Major bathroom fixtures — outdated and need replacement
- Major roof — visible wear
- Major exterior siding — worn
- Major flooring — worn
- Major interior walls/paint — worn
- Major windows — worn
- Major foundation/structure — worn
- Major HVAC/mechanicals — worn
- Major landscaping — worn
Value-add opportunities
- Resale kitchen appliances — new appliances will attract buyers
- Resale bathroom fixtures — new fixtures will attract buyers
- Both exterior siding — new siding will improve curb appeal and value
- Both flooring — new flooring will improve curb appeal and value
- Both interior walls/paint — new paint will improve curb appeal and value
- Both windows — new windows will improve curb appeal and value
- Both foundation/structure — new foundation will improve structural integrity and value
- Both HVAC/mechanicals — new HVAC will improve comfort and value
- Both landscaping — new landscaping will improve curb appeal and value
Renovation cost estimate screening
| Repair item | Severity | Est. cost |
|---|---|---|
| kitchen appliances · outdated and need replacement | Major | $15,000–50,000 |
| bathroom fixtures · outdated and need replacement | Major | $15,000–50,000 |
| roof · visible wear | Major | $15,000–50,000 |
| exterior siding · worn | Major | $15,000–50,000 |
| flooring · worn | Major | $15,000–50,000 |
| interior walls/paint · worn | Major | $15,000–50,000 |
| windows · worn | Major | $15,000–50,000 |
| foundation/structure · worn | Major | $15,000–50,000 |
| HVAC/mechanicals · worn | Major | $15,000–50,000 |
| landscaping · worn | Major | $15,000–50,000 |
| Total estimated repair cost · 10 items | $150,000–500,000 |
Value-add ROI direction
- Resale kitchen appliances — new appliances will attract buyers ↑
- Resale bathroom fixtures — new fixtures will attract buyers ↑
- Both exterior siding — new siding will improve curb appeal and value ↑
- Both flooring — new flooring will improve curb appeal and value ↑
- Both interior walls/paint — new paint will improve curb appeal and value ↑
- Both windows — new windows will improve curb appeal and value ↑
- Both foundation/structure — new foundation will improve structural integrity and value ↑
- Both HVAC/mechanicals — new HVAC will improve comfort and value ↑
- Both landscaping — new landscaping will improve curb appeal and value ↑
ⓘ Cost ranges are severity-bucket heuristics (US national rule-of-thumb). Get contractor quotes + a written scope before underwriting a rehab budget.
Schools (NCES district)
- District
- Point Isabel ISD
- NCES district ID
- 4835250
- Math proficiency
- 14% ▼ -24.00%
- Reading proficiency
- 31% ▼ -10.00%
- Median HH income
- $38,115
- Composite
- 18.78/100
- National rank
- #8871
- State rank
- #756 of 826 in TX
Livability — Port Isabel
- Score
- 75/100
- State rank
- #157
- US rank
- #4282
Category grades
Schools grade is shown separately in the Schools card above.
Census & demographics
- Census place
- Port Isabel, TX
- Population (ZIP)
- 10,231
Population outlook (Cameron County) Hauer SSP2
- Today (2025)
- 441,603 people
- By 2030
- 448,113 · +1.5%
- By 2040
- 456,385 · +3.3%
- By 2050
- 456,294 · +3.3%
- By 2075
- 423,851 · -4.0%
- By 2100
- 342,787 · -22.4%
Race, ethnicity, and origin ACS 2023
- Neighborhood character
- Majority Hispanic (63%)
- Race & ethnicity
- Hispanic / Latino 63% White 35% Two or more races 19%
- Hispanic origin (detail)
- Mexican 59%
- Common ancestry
- Lithuanian 2% Romanian 1% Slovak 1%
- Foreign-born
- 18% · Canada
- Languages at home
- 57% English-only · Spanish 42%
Political lean MEDSL · Cameron
- 2024 margin
- Lean R (+5.8) · D 46.7% · R 52.5%
- 2008→2024 swing
- -34.6pp toward R · 2008: 28.8pp · 2024: -5.8pp
- All cycles
- 2024: R+5.8 2020: D+13.2 2016: D+32.5 2012: D+32.4 2008: D+28.8
Not yet ingested
- Civics
- —
Market trends
- HPI YoY
- ▼ -61.69%
- Current HPI
- 222.9501
- Rent YoY
- —
- Metro
- —
- State GDP YoY
- ▲ 3.95%
- F500 in state
- 110
Industry mix (Fortune 500 HQ in TX)
| Industry | F500 HQs | Revenue |
|---|---|---|
| Energy | 16 | $1,198B |
|
||
| Technology | 5 | $198B |
|
||
| Engineering / Construction | 4 | $72B |
|
||
| Energy Services | 3 | $60B |
|
||
| Utilities | 3 | $41B |
|
||
| Healthcare | 2 | $330B |
|
||
Price history
1 event — show timeline
- 2026-06-18 Listed $285,000 RGVMLS
Cash-flow waterfall
monthlySold comps — $/sqft
last 12 mo · ≤1 miLoading sold comps…