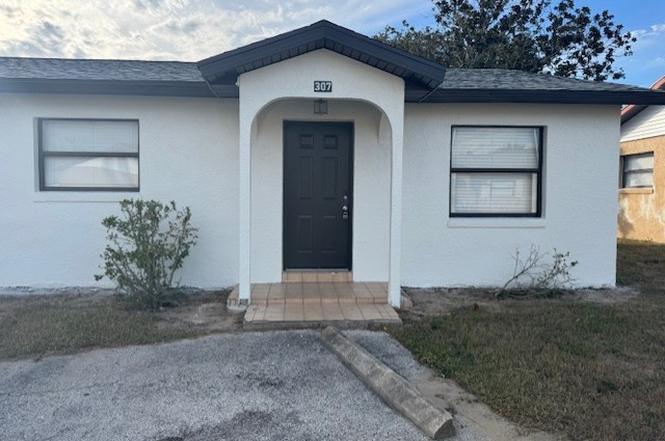
307 Blanco Ct #635 · Avon Park, FL
Flood risk 1/10 · Minimal
- FEMA flood zone
- X (unshaded)
- Chance of flooding over 30 yrs
- 0.0%
- Est. flood insurance / yr
- $507 – $1,088
Fire risk 4/10 · Minor
- Est. fire insurance / yr
- $947 – $1,759
Heat risk 9/10 · Severe
- Hot days now (above 108°F)
- 7 days/yr
- Hot days in 30 yrs
- 25 days/yr
Wind risk 9/10 · Severe
- Chance of severe wind over 30 yrs
- 99.0%
Air-quality risk 2/10 · Minimal
- Unhealthy air days now
- 2 days/yr
- Unhealthy air days in 30 yrs
- 2 days/yr
Risk factors via First Street. Map © Google.
Why this score? — see what drove the C- grade
The composite is a weighted blend of 9 inputs, each scored 0–100. Each bar is that input's sub-score; the figure is the points it added to the 100-point composite (weight × sub-score).
- Cash flow +20.8/30.0
- 1% rule +9.2/10.0
- DSCR +6.6/10.0
- ARV discount +4.7/15.0
- Schools +3.6/10.0
- Livability +3.6/5.0
- Rent growth +2.5/5.0
- Condition / age +2.5/5.0
- Appreciation +0.0/10.0
$80,000
🖨 Deal sheet 📄 Offer letter ✓ Due diligence
Listing remarks
INVESTMENT OPPORTUNITY!!! 2 bedroom, 1 bath investment opportunity located in Las Palmas Resort in Avon Park - OR - Perfect for a small family. Spacious kitchen with plenty of cabinet/pantry space. Updated vanity in bath w/ tub. New flooring throughout. All windows have blinds and windows are large and provide great natural light. Large closets in both bedrooms. Laundry room has ample space for additional storage. Brand new refrigerator. The community features BRAND NEW ROOFS throughout and is currently undergoing an exterior painting project, enhancing long-term value and curb appeal. This unit is almost complete! More photos to come. Notably, the association has never had a special asse
Key facts
- Spacious kitchen
- New flooring
- Large closets
Tags
Property features AI
Finance
- HOA & community: Homeowners association with a $255 monthly fee; Community clubhouse; Tennis courts
Exterior
- Parking: 1 parking space
- Utilities: Public water; Public sewer; Cable available; Sewer available
- Home design: Single family residence (villa); One story
- Construction: Block, concrete, and stucco construction; Shingle roof
- Exterior features: Front porch; Rear porch; Community pool
Interior
- Kitchen: Oven; Range; Refrigerator
- Bedrooms: 6 total rooms (includes bedrooms and living spaces)
- Flooring: Laminate; Simulated wood; Tile
- Bathrooms: 1 full bathroom
- Heating & cooling: Central heating (electric); Central air conditioning (electric)
- Interior features: Ceiling fan(s); Blinds
- Laundry & utility: Electric water heater
Neighborhood map
What this means for you Summary
Snapshot
- This is a 2-bed/1.0-bath single-family listed at $80k.
Deal economics
- At list price, monthly cash flow is $109 ($1k/yr) — positive.
- The deal already cash-flows at list — no discount required.
- Meets the 1% rule at list price ($1k rent vs $80k).
- Recommended offer: $70k (12.0% below list) — sets the bar for market timing.
- Cap rate 7.9% vs local median 3.9% in Avon Park — top-decile yield for the area; either an underpriced asset or a hidden risk that comps aren't pricing in. Stress-test before assuming the spread holds.
Location & tenants
- Location reads 71/100 on livability (#407 in FL) — a middle-class / working-renter tenant base. Strengths: cost of living A+, housing A+, health & safety A+; Watch: crime D+, amenities F, commute F.
- Highlands (other): math 45% / reading 43% proficiency, ranked #54 of 73 in FL (top 74%) — families likely to look elsewhere, expect single-tenant / working-renter base with shorter leases; 68% free/reduced lunch — lower-income household profile, screen leases tightly.
- Zoned schools: Avon Elementary School (math 52% / reading 45%, grade D, #1,152 of 2,144 statewide, top 55%, 523 students, 77% FRL); Avon Park Middle School (math 37% / reading 35%, grade F, #410 of 571 statewide, top 72%, 638 students, 77% FRL); Avon Park High School (math 35% / reading 39%, grade F, #340 of 667 statewide, top 52%, 928 students, 67% FRL).
- Market conditions: 475 active listings in the ZIP; 2 comparable units currently listed for rent nearby; 980 units permitted in Highlands County in 2024 (80 in 5+ unit buildings).
Forward outlook
- Local home prices are declining (-3.0%/yr); year-one equity from $553 of loan paydown is wiped out by about $2k of value loss. Plan a longer hold.
Negotiation context
- It's been on market 188 days — a 12% lower offer ($70k) is reasonable based on typical stale-listing flexibility.
- 2 sale attempts; this cycle's ask has dropped $10k (11%) from the opening price — seller is motivated, your offer sets the floor, not the list.
Risks & watch-outs
- Watch-outs: HOA is 22% of rent.
- Climate carrying-cost: severe wind risk, 99% chance of damaging wind over 30y; extreme-heat days projected 7→25/yr by 2055 (HVAC capex compounding) — expect insurance premiums to compound above CPI over the hold.
Questions for the listing agent
- It's been on market 188 days. Have you received any prior offers? Is the seller open to a 12% concession, seller financing, or rate buy-down credit?
- Built in 1974 — when were the roof, HVAC, electrical panel, plumbing, and water heater last replaced?
- What does the HOA fee cover, when was the last increase, and are there any pending special assessments or reserve-fund shortfalls?
- Why hasn't it sold? Are there any deal-killer items the seller is aware of (foundation, flood, title, zoning, code violations)?
- Is there a deadline driving the sale (1031 exchange, divorce, estate, relocation)? That informs how much negotiation room exists.
- Schools are F-rated, which usually means shorter tenancies and higher turnover. Who's the typical renter profile here, and what's been the actual vacancy rate?
- Crime grade is D in this area — have there been break-ins, vandalism, or insurance claims at this property in the last 3 years? What carrier currently insures it and at what premium?
- What's the average days-on-market for RENTAL listings here right now (not sales)? A rising rental-DOM trend means longer vacancies and softer asking-rent achievability than the comps imply.
- What's the recent tenant-quality profile in this submarket — average credit score on applications, eviction rate, late-payment / NSF rate, and stable-employment percentage? A property-management company in the area should have these aggregated.
- How much new for-sale + rental construction is in the pipeline within 1–3 miles? Heavy new supply typically softens prices + rents 12–24 months out; constrained supply supports both.
Investment metrics
- 1% rule
- 1.42% ✓
- Cap rate
- 7.93%
- Cash-on-cash
- 5.86%
- DSCR
- 1.26
- GRM
- 5.9
CMA / ARV
- ARV (on-the-fly)
- $75,330
- Comps found
- 12
Show comp detail 12 sales within ~0.75 mi
| Address | Dist | Beds/Ba | Sqft | Sold | Price | $/sf | Match |
|---|---|---|---|---|---|---|---|
| 483 Las Palmas Cir #658 | 0.04mi | 2/1.0 | 810 (0%) | 7mo | $75,000 | $93 | 92 |
| 425 Las Palmas Cir #612 | 0.06mi | 2/1.0 | 810 (0%) | 7mo | $75,000 | $93 | 91 |
| 330 Blanco Ct | 0.04mi | 2/1.0 | 810 (0%) | 9mo | $67,500 | $83 | 91 |
| 332 Blanco Ct | 0.04mi | 2/1.0 | 810 (0%) | 9mo | $67,500 | $83 | 90 |
| 338 Blanco Ct #655 | 0.06mi | 2/1.0 | 810 (0%) | 15mo | $65,000 | $80 | 85 |
| 412 Las Palmas Cir #607 | 0.06mi | 2/1.0 | 810 (0%) | 15mo | $65,000 | $80 | 85 |
| 505 Las Palmas Cir #680 | 0.07mi | 2/1.0 | 810 (0%) | 21mo | $75,000 | $93 | 79 |
| 602 S Delaney Ave | 0.57mi | 3/1.0 (+1) | 830 (+2%) | 11mo | $90,000 | $108 | 55 |
| 605 E Green St | 0.28mi | 2/1.5 | 700 (-14%) | 14mo | $120,000 | $171 | 51 |
| 1116 S Carolina Ave | 0.68mi | 3/1.0 (+1) | 864 (+7%) | 15mo | $96,000 | $111 | 39 |
| 1301 S Carolina Ave | 0.74mi | 3/1.0 (+1) | 882 (+9%) | 20mo | $122,570 | $139 | 29 |
| 210 Joe Hilton St | 0.74mi | 3/2.5 (+1) | 891 (+10%) | 12mo | $179,000 | $201 | 28 |
Match score weights: distance 35% · size 25% · config 20% · recency 20%. Top-matched comps best support the ARV.
Projected returns pro-forma
-3.0% appreciation · 3.0% rent growth · sell at horizon
- IRR
- -7.0%
- Equity multiple
- 0.74×
- Total profit
- $-5,833
- Equity at exit
- $11,928
- IRR
- 2.8%
- Equity multiple
- 1.20×
- Total profit
- $4,553
- Equity at exit
- $6,917
Cash invested: $22,400 (down + closing). Projections, not guarantees.
Landlord ↔ Tenant lean methodology
- Overall (STATE)
- 87 Strongly Landlord-Friendly
- State Florida
- 87 Strongly Landlord-Friendly · R+3
- County
- — inherits STATE
- City
- — inherits STATE
ZIP-level market 33825
- Home prices YoY
- -25.9%
- Active inventory
- 475
- Price-to-rent
- 5.9×
Monthly cashflow live
- Estimated rent
- $1,137 medium interval (Pro) →
- Mortgage (P&I)
- −$420
- Tax from tax record
- −$81 /mo · $969/yr
- Insurance
- −$33
- HOA
- −$255
- Vacancy / Maint / Mgmt
- −$239
- Net cashflow
- $109
Break-even live
UW: 25.0% down · 7.5% · 30yr · 1.5% tax · 5.0% vac · 8.0% maint · 8.0% mgmt
Financing live
Cash to close
- Down payment
- $20,000
- Closing costs
- $2,400
- Reserves months
- —
- Total cash needed
- —
Loan-product check · same deal, 3 products live
Conventional
25% down · 7.5% · 30yr
- Down + closing
- —
- Monthly P&I
- —
- Monthly cashflow
- —
- DSCR
- —
- Eligible?
- —
Personal DTI + credit; lowest rate.
DSCR
20% down · 8.5% · 30yr
- Down + closing
- —
- Monthly P&I
- —
- Monthly cashflow
- —
- DSCR
- —
- Eligible?
- —
No personal income docs; deal must DSCR.
Hard money
10% down · 12.0% · 12mo
- Down + closing
- —
- Monthly P&I
- —
- Monthly cashflow
- —
- DSCR
- —
- Eligible?
- —
Short-term bridge; refi at stabilization.
Rent comps 2 comps
| Address | Beds | Baths | Sqft | Rent | $/sqft | DOM | Units | Dist |
|---|---|---|---|---|---|---|---|---|
| 565 Luminary LOOP Avon Park, FL | 2.0–3.0 | 1.5–2.0 | 1142 | $994 | $0.87 | 23d | 6 | 1.09mi |
| 1015 W Bell St Avon Park, FL | 1.0 | 1.0 | 576 | $985 | $1.71 | 23d | 1 | 1.48mi |
HOA detail
- Monthly dues
- $255 · $3,060/yr
Listing history 18 events
-
2026-06-19days on market $80,000 Active 188 DOM
-
2026-06-18days on market $80,000 Active 187 DOM
-
2026-06-17days on market $80,000 Active 186 DOM
-
2026-06-16days on market $80,000 Active 185 DOM
-
2026-06-15days on market $80,000 Active 184 DOM
-
2026-06-14days on market $80,000 Active 182 DOM
-
2026-06-10days on market $80,000 Active 179 DOM
-
2026-06-09days on market $80,000 Active 178 DOM
-
2026-06-08days on market $80,000 Active 177 DOM
-
2026-06-07days on market $80,000 Active 176 DOM
-
2026-06-02days on market $80,000 Active 171 DOM
-
2026-06-01days on market $80,000 Active 170 DOM
-
2026-05-31days on market $80,000 Active 169 DOM
-
2026-05-30days on market $80,000 Active 168 DOM
-
2026-04-01status Active
-
2026-04-01historical
-
2026-03-13price $80,000
-
2025-12-11$90,000 Active
ⓘ Source: listings_history table (triggers on properties + properties_extension) + one-shot
backfill from property_details.listing_events for pre-trigger history.
Tax reassessment forecast FL · Resets to sale price
- Current annual tax
- $969 · $81/mo
- Projected year-2 tax
- $969 · $81/mo
- Expected delta
- $0/yr ($0/mo · 0.0%)
ⓘ Screening estimate from a state-policy table — verify with the county assessor before closing.
Climate risk First Street
- Flood 1/10 Low FEMA zone X (unshaded) · 0% chance over 30 yrs
- Wildfire 4/10 Moderate
- Heat 9/10 Extreme 7 d/yr ≥108°F today · 25 d/yr by 30 yrs out
- Wind 9/10 Extreme 99% chance of damaging wind over 30 yrs
- Air quality 2/10 Low 2 unhealthy d/yr today · 2 by 30 yrs out
Nearby sold comps map
Loading sold comps map…
Walkable amenities ~0.75 mi
Loading nearby amenities…
Taxation est. · year 1
- Rental income
- $13,641
- − Mortgage interest
- −$4,481
- − Property taxes
- −$969
- − Insurance
- −$400
- − Repairs & maintenance
- −$1,091
- − Management
- −$1,091
- − HOA
- −$3,060
- − Depreciation
- −$2,327
- Taxable income
- $221
- Est. tax owed @ 24.0%
- −$53
- After-tax cash flow
- $1,260/yr
For passive investors: Depreciation is non-cash, so a rental often shows a tax loss while cash-flowing — sheltering income. Rental losses are passive: they offset passive income freely, and up to $25,000/yr can offset ordinary (W-2) income if you actively participate and your MAGI is under $100k (phasing out to $0 by $150k); unused losses carry forward. On sale, claimed depreciation is recaptured at up to 25%, and gains may owe capital-gains tax (a 1031 exchange can defer both). Figures are a year-1 estimate at your 24.0% rate — not tax advice; consult a CPA.
Schools (NCES district)
- District
- Highlands
- NCES district ID
- 1200840
- Math proficiency
- 45% ▼ -7.00%
- Reading proficiency
- 43% ▼ -3.00%
- Median HH income
- $35,276
- Composite
- 36.42/100
- National rank
- #4672
- State rank
- #54 of 73 in FL
Livability — Avon Park
- Score
- 71/100
- State rank
- #407
- US rank
- #7205
Category grades
Schools grade is shown separately in the Schools card above.
Census & demographics
- Census place
- Avon Park, FL
- County
- Highlands County · 98,898 people
- City population
- 25,501
- Metro
- Sebring-Avon Park, FL
- Population (ZIP)
- 25,501
- Household income
- $46,949
- Rent vs Own
- Severe rent burden
- 691.0
Population outlook (Highlands County) Hauer SSP2
- Today (2025)
- 99,674 people
- By 2030
- 99,615 · -0.1%
- By 2040
- 99,342 · -0.3%
- By 2050
- 98,242 · -1.4%
- By 2075
- 93,291 · -6.4%
- By 2100
- 79,894 · -19.8%
Race, ethnicity, and origin ACS 2023
- Neighborhood character
- Diverse neighborhood (Simpson 0.64)
- Race & ethnicity
- White 51% Hispanic / Latino 27% Black 17% Two or more races 11% Asian 1%
- Hispanic origin (detail)
- Mexican 8% Puerto Rican 13% Cuban 2%
- Common ancestry
- Slovak 2% Lithuanian 2% Iranian 1%
- Foreign-born
- 10% · Canada, Vietnam, Guatemala
- Languages at home
- 74% English-only · Spanish 24% Tagalog/Filipino 1%
Political lean MEDSL · Highlands
- 2024 margin
- Solid R (+40.8) · D 29.3% · R 70.1%
- 2008→2024 swing
- -22.7pp toward R · 2008: -18.1pp · 2024: -40.8pp
- All cycles
- 2024: R+40.8 2020: R+34.4 2016: R+32.0 2012: R+23.0 2008: R+18.1
Not yet ingested
- Civics
- —
Market trends
- HPI YoY
- ▼ -98.54%
- Current HPI
- 281.8067
- Rent YoY
- —
- Metro
- Sebring-Avon Park, FL
- State GDP YoY
- ▲ 3.28%
- F500 in state
- 36
Industry mix (Fortune 500 HQ in FL)
| Industry | F500 HQs | Revenue |
|---|---|---|
| Industrial Technology | 2 | $29B |
|
||
| Insurance | 2 | $17B |
|
||
| Retail | 1 | $60B |
|
||
| Technology Distribution | 1 | $58B |
|
||
| Homebuilding | 1 | $35B |
|
||
| Technology Manufacturing | 1 | $35B |
|
||
Price history
-11.1% since first listed4 events — show timeline
- 2026-04-01 Relisted — HAOR as distributed by MLS GRID
- 2026-04-01 Delisted — HAOR as distributed by MLS GRID
- 2026-03-13 Price Changed $80,000 HAOR as distributed by MLS GRID
- 2025-12-11 Listed $90,000 HAOR as distributed by MLS GRID
Property tax history
+9.6%/yrLatest (2025): $969 · +12.9% YoY. Source: county tax records.
Cash-flow waterfall
monthlySold comps — $/sqft
last 12 mo · ≤1 miLoading sold comps…