 🏗️ New Construction
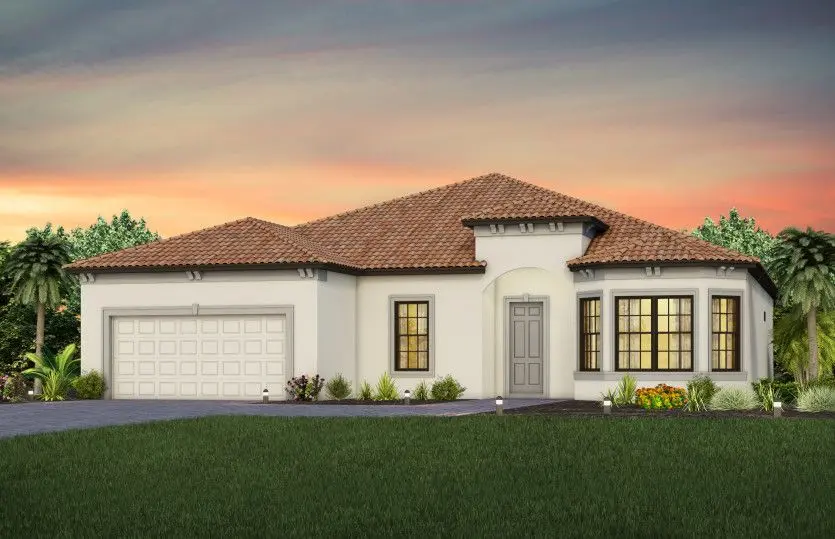
Stardom Plan · Estero, FL
Flood risk 1/10 · Minimal
- FEMA flood zone
- X (unshaded)
- Chance of flooding over 30 yrs
- 0.0%
- Est. flood insurance / yr
- $507 – $1,088
Fire risk 7/10 · Major
- Est. fire insurance / yr
- $947 – $1,759
Heat risk 9/10 · Severe
- Hot days now (above 107°F)
- 7 days/yr
- Hot days in 30 yrs
- 29 days/yr
Wind risk 10/10 · Severe
- Chance of severe wind over 30 yrs
- 99.0%
Air-quality risk 2/10 · Minimal
- Unhealthy air days now
- 1 days/yr
- Unhealthy air days in 30 yrs
- 1 days/yr
Risk factors via First Street. Map © Google.
Why this score? — see what drove the F grade
The composite is a weighted blend of 9 inputs, each scored 0–100. Each bar is that input's sub-score; the figure is the points it added to the 100-point composite (weight × sub-score).
- Cash flow +9.3/30.0
- ARV discount +7.5/15.0
- Schools +4.1/10.0
- Livability +4.0/5.0
- 1% rule +2.8/10.0
- DSCR +2.6/10.0
- Condition / age +2.5/5.0
- Rent growth +2.1/5.0
- Appreciation +0.0/10.0
$576,990
🖨 Deal sheet (PDF) 📄 Offer letter ✓ Due diligence
Key facts
- 2 garage spots
- Listed 956 days
Property features AI
Finance
- Other: Listing provided by Zillow; information deemed reliable but not guaranteed
- Financial info: List price $573,990
Exterior
- Home design: New construction plan (Stardom); Listed as Active
- Construction: Living area approximately 2269; Model/plan name: Stardom
- Exterior features: Address: 18405 Parksville Dr, Estero, FL 33928
Interior
- Bedrooms: 2 bedrooms
- Bathrooms: 2 full bathrooms and 1 half bathroom (2.5 total)
- Interior features: Plan model home (Stardom)
Neighborhood map
What this means for you Summary
Snapshot
- This is a 2-bed/2.5-bath single-family listed at $577k.
Deal economics
- At list price, monthly cash flow is $-462 ($-6k/yr) — negative.
- To cash-flow at today's rent, offer at most $559k (3.0% below list).
- To meet the 1% rule (rent ≥ 1% of price), the offer needs to be $489k (15.2% below list).
- Recommended offer: $489k (15.2% below list) — sets the bar for 1% rule.
- Cap rate 5.4% vs local median 3.4% in Estero — top-decile yield for the area; either an underpriced asset or a hidden risk that comps aren't pricing in. Stress-test before assuming the spread holds.
Location & tenants
- Location reads 79/100 on livability (#149 in FL, #2,242 nationally) — a middle-class / working-renter tenant base. Strengths: crime A+, employment A+, housing A+; Watch: amenities F, commute F, cost of living D-.
- Lee (suburban): math 47% / reading 50% proficiency, ranked #42 of 73 in FL (top 58%) — families likely to look elsewhere, expect single-tenant / working-renter base with shorter leases.
- Zoned schools: Pinewoods Elementary School (math 81% / reading 74%, grade A, #163 of 2,144 statewide, top 8%, 1,089 students, 25% FRL); Lexington Middle School (math 55% / reading 54%, grade B-, #183 of 571 statewide, top 34%, 1,138 students, 44% FRL); South Fort Myers High School (math 23% / reading 30%, grade F, #489 of 667 statewide, top 74%, 1,917 students, 50% FRL) — zoned schools average 39% FRL vs 57% district-wide (18 pts lower); this property's tenant base skews higher-income than the district average.
- Market conditions: Rents soft (-1.4%/yr); 674 active listings in the ZIP; 23 comparable units currently listed for rent nearby; rentals at typical pace (median 26d on market — plan ~3-4 weeks tenant-placement turnaround); solid renter incomes; 15,411 units permitted in Lee County in 2024 (4,686 in 5+ unit buildings).
- At $4,894/mo this rent would consume 57% of the median local household income ($103k/yr) (locally 606% of renters already pay >50% of income on rent) — very limited rent-growth headroom before tenants either downsize or default.
Forward outlook
- Local home prices are declining (-3.0%/yr); year-one equity from $4k of loan paydown is wiped out by about $19k of value loss. Plan a longer hold.
- Lee County population projected at +44% by 2050 — long-run rental-demand tailwind backs the buy-and-hold thesis.
Negotiation context
- It's been on market 956 days — a 12% lower offer ($508k) is reasonable based on typical stale-listing flexibility.
Risks & watch-outs
- Climate carrying-cost: severe wind risk, 99% chance of damaging wind over 30y; major wildfire risk; extreme-heat days projected 7→29/yr by 2055 (HVAC capex compounding) — expect insurance premiums to compound above CPI over the hold.
Questions for the listing agent
- What do current leases actually rent for vs. the listed asking? Can we see a recent rent roll and the last 12 months of T-12 income?
- It's been on market 956 days. Have you received any prior offers? Is the seller open to a 15% concession, seller financing, or rate buy-down credit?
- Why hasn't it sold? Are there any deal-killer items the seller is aware of (foundation, flood, title, zoning, code violations)?
- Is there a deadline driving the sale (1031 exchange, divorce, estate, relocation)? That informs how much negotiation room exists.
- Schools are A-rated — typically a magnet for longer-tenancy family renters. What's the average tenant stay here, and is there a school-zone premium baked into asking?
- The area grade is low — what's the realistic commute time and amenity access for the typical tenant pool here? Any planned neighborhood developments (good or bad) we should know about?
- What's the average days-on-market for RENTAL listings here right now (not sales)? A rising rental-DOM trend means longer vacancies and softer asking-rent achievability than the comps imply.
- What's the recent tenant-quality profile in this submarket — average credit score on applications, eviction rate, late-payment / NSF rate, and stable-employment percentage? A property-management company in the area should have these aggregated.
- How much new for-sale + rental construction is in the pipeline within 1–3 miles? Heavy new supply typically softens prices + rents 12–24 months out; constrained supply supports both.
Investment metrics
- 1% rule
- 0.78% ✗
- Cap rate
- 5.41%
- Cash-on-cash
- -3.16%
- DSCR
- 0.86
- GRM
- 10.7
CMA / ARV
- ARV (on-the-fly)
- $626,244
- Comps found
- 5
Show comp detail 5 sales within ~0.75 mi
| Address | Dist | Beds/Ba | Sqft | Sold | Price | $/sf | Match |
|---|---|---|---|---|---|---|---|
| 20175 Millrun Dr | 0.26mi | 3/2.5 (+1) | 2,300 (+1%) | 15mo | $695,000 | $302 | 68 |
| 20285 Napa Loop | 0.26mi | 3/3.0 (+1) | 2,133 (-6%) | 18mo | $580,000 | $272 | 56 |
| 20530 Pebble Glen Dr | 0.46mi | 3/3.0 (+1) | 2,099 (-8%) | 12mo | $579,000 | $276 | 49 |
| 18647 Ives Dr | 0.56mi | 3/3.0 (+1) | 2,032 (-10%) | 12mo | $664,900 | $327 | 39 |
| 20154 Hartford Blvd | 0.42mi | 3/2.0 (+1) | 2,056 (-9%) | 23mo | $535,260 | $260 | 38 |
Match score weights: distance 35% · size 25% · config 20% · recency 20%. Top-matched comps best support the ARV.
Projected returns pro-forma
-3.0% appreciation · 0.0% rent growth · sell at horizon
- IRR
- -25.0%
- Equity multiple
- 0.17×
- Total profit
- $-145,158
- Equity at exit
- $93,375
- IRR
- -33.5%
- Equity multiple
- -0.25×
- Total profit
- $-219,397
- Equity at exit
- $54,146
Cash invested: $175,348 (down + closing). Projections, not guarantees.
Landlord ↔ Tenant lean methodology
- Overall (STATE)
- 87 Strongly Landlord-Friendly
- State Florida
- 87 Strongly Landlord-Friendly · R+3
- County
- — inherits STATE
- City
- — inherits STATE
ZIP-level market 33928
- Rents YoY
- -1.4%
- Active inventory
- 674
- Price-to-rent
- 9.8×
Monthly cashflow live
- Estimated rent
- $4,894 high interval (Pro) →
- Mortgage (P&I)
- −$3,284
- Tax est. 1.5%
- −$783 /mo · $9,394/yr
- Insurance
- −$261
- HOA
- −$0
- Vacancy / Maint / Mgmt
- −$1,028
- Net cashflow
- $-462
Break-even live
Sensitivity live
| Price | -10% $-29 | -5% $-245 | +0% $-462 | +5% $-678 | +10% $-895 |
|---|---|---|---|---|---|
| Rent | -10% $-848 | -5% $-655 | +0% $-462 | +5% $-268 | +10% $-75 |
| Rate | -1.0pp $-146 | -0.5pp $-303 | base $-462 | +0.5pp $-624 | +1.0pp $-789 |
UW: 25.0% down · 7.5% · 30yr · 1.5% tax · 5.0% vac · 8.0% maint · 8.0% mgmt
Financing live
Cash to close
- Down payment
- $156,561
- Closing costs
- $18,787
- Reserves months
- —
- Total cash needed
- —
Loan-product check · same deal, 3 products live
Conventional
25% down · 7.5% · 30yr
- Down + closing
- —
- Monthly P&I
- —
- Monthly cashflow
- —
- DSCR
- —
- Eligible?
- —
Personal DTI + credit; lowest rate.
DSCR
20% down · 8.5% · 30yr
- Down + closing
- —
- Monthly P&I
- —
- Monthly cashflow
- —
- DSCR
- —
- Eligible?
- —
No personal income docs; deal must DSCR.
Hard money
10% down · 12.0% · 12mo
- Down + closing
- —
- Monthly P&I
- —
- Monthly cashflow
- —
- DSCR
- —
- Eligible?
- —
Short-term bridge; refi at stabilization.
Rent comps 23 comps
| Address | Beds | Baths | Sqft | Rent | $/sqft | DOM | Units | Dist |
|---|---|---|---|---|---|---|---|---|
| 20419 Pebble Glen Dr Estero, FL | 3.0 | 2.0 | 2088 | $6,490 | $3.11 | 25d | 1 | 0.13mi |
| 20285 Napa Loop Estero, FL | 3.0 | 3.0 | 2133 | $6,200 | $2.91 | 25d | 1 | 0.23mi |
| 20179 Millrun Dr Estero, FL | 3.0 | 2.5 | 2493 | $4,300 | $1.72 | 25d | 1 | 0.25mi |
| 18334 Ridgeline Dr Estero, FL | 3.0 | 3.0 | 2434 | $4,700 | $1.93 | 23d | 1 | 0.29mi |
| 18315 Parksville Dr Estero, FL | 3.0 | 3.0 | 2444 | $4,995 | $2.04 | 5d | 1 | 0.30mi |
| 19278 Hinkley Dr Estero, FL | 3.0 | 3.0 | 2201 | $3,395 | $1.54 | 5d | 1 | 0.30mi |
| 18315 Ridgeline Dr Estero, FL | 3.0 | 3.0 | 2202 | $3,750 | $1.70 | 18d | 1 | 0.34mi |
| 18278 Ridgeline Dr Estero, FL | 3.0 | 3.0 | 2434 | $7,500 | $3.08 | 25d | 1 | 0.35mi |
| 20047 Napa Loop Estero, FL | 3.0 | 3.0 | 2202 | $9,000 | $4.09 | 5d | 1 | 0.37mi |
| 20047 Napa Loop Estero, FL | 3.0 | 3.0 | 2621 | $3,495 | $1.33 | 18d | 1 | 0.37mi |
| 20514 Pebble Glen Dr Estero, FL | 2.0 | 2.0 | 1670 | $5,700 | $3.41 | 25d | 1 | 0.39mi |
| 18282 Parksville Dr Estero, FL | 3.0 | 3.0 | 2126 | $10,000 | $4.70 | 25d | 1 | 0.41mi |
| 20015 Napa Loop Estero, FL | 3.0 | 3.0 | 2202 | $8,000 | $3.63 | 25d | 1 | 0.43mi |
| 20530 Pebble Glen Dr Estero, FL | 3.0 | 3.0 | 2099 | $5,950 | $2.83 | 25d | 1 | 0.43mi |
| 20040 Hartford Blvd Estero, FL | 3.0 | 4.0 | 2534 | $3,800 | $1.50 | 25d | 1 | 0.43mi |
| 20024 Hartford Blvd Estero, FL | 3.0 | 2.0 | 2081 | $6,950 | $3.34 | 25d | 1 | 0.46mi |
| 19218 Hinkley Dr Estero, FL | 3.0 | 2.0 | 1655 | $3,000 | $1.81 | 16d | 1 | 0.46mi |
| 19100 Hanley Blvd Estero, FL | 3.0 | 3.0 | 2434 | $4,000 | $1.64 | 25d | 1 | 0.60mi |
| 19232 Gentry Pl Estero, FL | 3.0 | 3.0 | 2202 | $3,800 | $1.73 | 25d | 1 | 0.84mi |
| 19712 Deming Ln Estero, FL | 3.0 | 3.0 | 2091 | $8,500 | $4.07 | 23d | 1 | 1.03mi |
| 19565 Deming Ln Estero, FL | 3.0 | 3.0 | 1852 | $3,800 | $2.05 | 25d | 1 | 1.24mi |
| 19563 Utopia Ln Estero, FL | 3.0 | 2.0 | 2010 | $5,995 | $2.98 | 25d | 1 | 1.29mi |
| 19527 Utopia Ln Estero, FL | 3.0 | 3.0 | 1852 | $4,000 | $2.16 | 25d | 1 | 1.37mi |
Listing history 9 events
-
2026-06-22days on market $576,990 Active 956 DOM
-
2026-06-17days on market $576,990 Active 952 DOM
-
2026-06-16days on market $576,990 Active 951 DOM
-
2026-06-16days on market $576,990 Active 950 DOM
-
2026-06-13days on market $576,990 Active 948 DOM
-
2026-06-09days on market $576,990 Active 944 DOM
-
2026-06-07days on market $576,990 Active 942 DOM
-
2026-06-01days on market $576,990 Active 936 DOM
-
2026-06-01pricedays on market $576,990 Active 935 DOM
ⓘ Source: listings_history table (triggers on properties + properties_extension) + one-shot
backfill from property_details.listing_events for pre-trigger history.
Climate risk First Street
- Flood 1/10 Low FEMA zone X (unshaded) · 0% chance over 30 yrs
- Wildfire 7/10 Severe
- Heat 9/10 Extreme 7 d/yr ≥107°F today · 29 d/yr by 30 yrs out
- Wind 10/10 Extreme 99% chance of damaging wind over 30 yrs
- Air quality 2/10 Low 1 unhealthy d/yr today · 1 by 30 yrs out
Nearby sold comps map
Loading sold comps map…
Walkable amenities ~0.75 mi
Loading nearby amenities…
Taxation est. · year 1
- Rental income
- $58,725
- − Mortgage interest
- −$35,079
- − Property taxes
- −$9,394
- − Insurance
- −$3,131
- − Repairs & maintenance
- −$4,698
- − Management
- −$4,698
- − Depreciation
- −$18,218
- Taxable loss
- −$16,493
- Est. tax savings @ 24.0%
- +$3,958
- After-tax cash flow
- $-1,583/yr
For passive investors: Depreciation is non-cash, so a rental often shows a tax loss while cash-flowing — sheltering income. Rental losses are passive: they offset passive income freely, and up to $25,000/yr can offset ordinary (W-2) income if you actively participate and your MAGI is under $100k (phasing out to $0 by $150k); unused losses carry forward. On sale, claimed depreciation is recaptured at up to 25%, and gains may owe capital-gains tax (a 1031 exchange can defer both). Figures are a year-1 estimate at your 24.0% rate — not tax advice; consult a CPA.
Schools (NCES district)
- District
- Lee
- NCES district ID
- 1201080
- Math proficiency
- 47% ▼ -11.00%
- Reading proficiency
- 50% ▼ -4.00%
- Median HH income
- $49,518
- Composite
- 41.49/100
- National rank
- #3458
- State rank
- #42 of 73 in FL
Livability — Estero
- Score
- 79/100
- State rank
- #149
- US rank
- #2242
Category grades
Schools grade is shown separately in the Schools card above.
Census & demographics
- County
- Lee County · 788,662 people
- City population
- 31,926
- Metro
- Cape Coral-Fort Myers, FL
- Population (ZIP)
- 31,926
- Household income
- $102,624
- Rent vs Own
- Severe rent burden
- 606.0
Population outlook (Lee County) Hauer SSP2
- Today (2025)
- 871,946 people
- By 2030
- 955,468 · +9.6%
- By 2040
- 1,113,587 · +27.7%
- By 2050
- 1,256,891 · +44.1%
- By 2075
- 1,560,270 · +78.9%
- By 2100
- 1,726,848 · +98.0%
Race, ethnicity, and origin ACS 2023
- Neighborhood character
- Predominantly White (85%)
- Race & ethnicity
- White 85% Hispanic / Latino 8% Two or more races 7% Asian 3% Black 1%
- Hispanic origin (detail)
- Mexican 2% Puerto Rican 2% Cuban 1%
- Common ancestry
- Romanian 5% Lithuanian 3% Slovak 2%
- Foreign-born
- 11% · Canada, China, Jamaica
- Languages at home
- 90% English-only · Spanish 5% Other Indo-European 1% French/Haitian/Cajun 1%
Political lean MEDSL · Lee
- 2024 margin
- Strong R (+28.4) · D 35.5% · R 63.9%
- 2008→2024 swing
- -18.0pp toward R · 2008: -10.4pp · 2024: -28.4pp
- All cycles
- 2024: R+28.4 2020: R+19.2 2016: R+20.4 2012: R+16.6 2008: R+10.4
Not yet ingested
- Civics
- —
Market trends
- HPI YoY
- ▼ -109.49%
- Current HPI
- 197.5913
- Rent YoY
- ▼ -1.42%
- Metro
- Cape Coral-Fort Myers, FL
- State GDP YoY
- ▲ 3.28%
- F500 in state
- 36
Industry mix (Fortune 500 HQ in FL)
| Industry | F500 HQs | Revenue |
|---|---|---|
| Industrial Technology | 2 | $29B |
|
||
| Insurance | 2 | $17B |
|
||
| Retail | 1 | $60B |
|
||
| Technology Distribution | 1 | $58B |
|
||
| Homebuilding | 1 | $35B |
|
||
| Technology Manufacturing | 1 | $35B |
|
||
Cash-flow waterfall
monthlySold comps — $/sqft
last 12 mo · ≤1 miLoading sold comps…