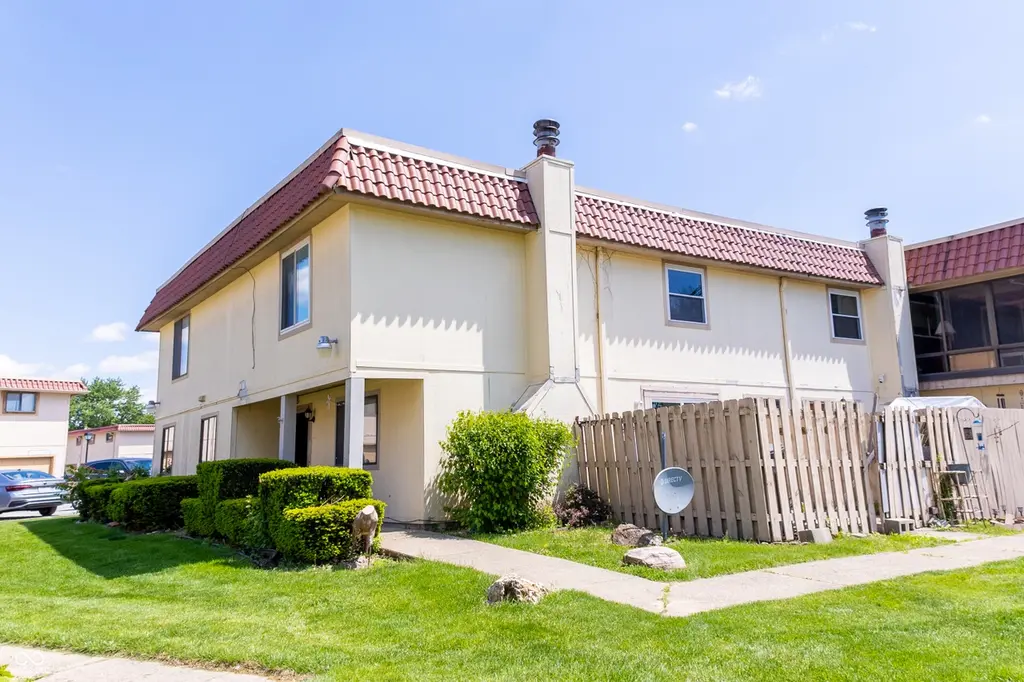
2714 Del Prado Dr · Indianapolis city (balance), IN
Flood risk 1/10 · Minimal
- FEMA flood zone
- X (unshaded)
- Chance of flooding over 30 yrs
- 0.0%
- Est. flood insurance / yr
- $507 – $1,088
Fire risk 1/10 · Minimal
- Est. fire insurance / yr
- $717 – $1,331
Heat risk 4/10 · Minor
- Hot days now (above 101°F)
- 7 days/yr
- Hot days in 30 yrs
- 19 days/yr
Wind risk 2/10 · Minimal
- Chance of severe wind over 30 yrs
- 1.0%
Air-quality risk 2/10 · Minimal
- Unhealthy air days now
- 2 days/yr
- Unhealthy air days in 30 yrs
- 2 days/yr
Risk factors via First Street. Map © Google.
Why this score? — see what drove the C+ grade
The composite is a weighted blend of 9 inputs, each scored 0–100. Each bar is that input's sub-score; the figure is the points it added to the 100-point composite (weight × sub-score).
- Cash flow +25.3/30.0
- 1% rule +10.0/10.0
- DSCR +8.4/10.0
- ARV discount +7.5/15.0
- Schools +3.5/10.0
- Rent growth +3.1/5.0
- Livability +2.5/5.0
- Condition / age +2.5/5.0
- Appreciation +0.0/10.0
$96,000
🖨 Deal sheet 📄 Offer letter ✓ Due diligence
Listing remarks
Beautiful 3BR, 2BA condo with a fireplace to keep you toasty on a cold winter night. Remodeled inside and out, this condo is move-in ready. All on one level, it also sits on a corner, offering both side and front yards. In the summer, enjoy the pool and all the summer amenities. Conveniently located on a bus line, close to the mall, doctors, grocers, and the library, and just minutes from downtown. Don't miss this one! All appliances stay, including the washer and dryer. So much for so little!
Key facts
- Remodeled
- All appliances stay
- Pool
Tags
Property features AI
Finance
- Other: Mandatory fee ownership interest; No common wall below (no one below)
- HOA & community: Homeowners association with monthly fee; Monthly HOA fee of $171; HOA covers clubhouse, grounds maintenance, insurance, snow removal, trash, park/playground, entrance/common areas
Exterior
- Parking: Assigned parking; Detached 1-car garage
- Utilities: Public water; Municipal sewer; Trash service
- Home design: Condominium (horizontal); Ground-level entry; One story
- Construction: Stucco exterior; Slab foundation
- Exterior features: Covered patio; Privacy fence
Interior
- Kitchen: Microwave; Refrigerator
- Bedrooms: Three bedrooms on the main level
- Bathrooms: Two full bathrooms (main level)
- Heating & cooling: Forced air heating; Central air conditioning
- Interior features: Masonry fireplace in the living room; Smoke detector(s)
- Laundry & utility: Washer; Dryer
Neighborhood map
What this means for you Summary
Snapshot
- This is a 3-bed/1.0-bath condo listed at $96k.
Deal economics
- At list price, monthly cash flow is $219 ($3k/yr) — positive.
- The deal already cash-flows at list — no discount required.
- Meets the 1% rule at list price ($2k rent vs $96k).
- Recommended offer: $95k (1.5% below list) — sets the bar for market timing.
- Cap rate 9.0% vs local median 4.4% in Indianapolis city (balance) — top-decile yield for the area; either an underpriced asset or a hidden risk that comps aren't pricing in. Stress-test before assuming the spread holds.
Location & tenants
- Location reads: area grade C — affects rentability + tenant quality, not the cash-flow math above.
- Perry Township Schools (urban): math 36% / reading 45% proficiency, ranked #138 of 301 in IN (top 46%) — families likely to look elsewhere, expect single-tenant / working-renter base with shorter leases.
- Market conditions: Rents rising (+2.5%/yr); 245 active listings in the ZIP; 35 comparable units currently listed for rent nearby; rentals leasing fast (median 8d on market — plan ~1-2 weeks tenant-placement turnaround); 1,906 units permitted in Marion County in 2024 (621 in 5+ unit buildings).
- This rent runs 34% of the median local income ($54k/yr) — at the standard rent-burdened threshold; future hikes will face affordability resistance.
Forward outlook
- Local home prices are declining (-3.0%/yr); year-one equity from $664 of loan paydown is wiped out by about $3k of value loss. Plan a longer hold.
- Marion County population projected at +18% by 2050 — long-run rental-demand tailwind backs the buy-and-hold thesis.
Negotiation context
- It's been on market 20 days — a 2% lower offer ($95k) is reasonable based on typical stale-listing flexibility.
Risks & watch-outs
- Watch-outs: property tax is 3.2% of price.
Questions for the listing agent
- Property tax is high relative to price — has the assessment been appealed recently, and will the sale trigger a re-assessment?
- What does the HOA fee cover, when was the last increase, and are there any pending special assessments or reserve-fund shortfalls?
- Any open or pending special assessments — roof, HVAC, plumbing, elevator, façade? What's the per-unit balance and payoff schedule, and is the seller paying it off at close or rolling it to the buyer?
- Is there a deadline driving the sale (1031 exchange, divorce, estate, relocation)? That informs how much negotiation room exists.
- What's the average days-on-market for RENTAL listings here right now (not sales)? A rising rental-DOM trend means longer vacancies and softer asking-rent achievability than the comps imply.
- What's the recent tenant-quality profile in this submarket — average credit score on applications, eviction rate, late-payment / NSF rate, and stable-employment percentage? A property-management company in the area should have these aggregated.
- How much new apartment / multifamily construction is in the pipeline within 1–3 miles? Heavy new supply (>2% of stock underway) typically softens rents 12–24 months out; light construction supports rent growth.
Investment metrics
- 1% rule
- 1.56% ✓
- Cap rate
- 9.03%
- Cash-on-cash
- 9.79%
- DSCR
- 1.44
- GRM
- 5.3
CMA / ARV
No comps found within radius.
Projected returns pro-forma
-3.0% appreciation · 2.46% rent growth · sell at horizon
- IRR
- -2.2%
- Equity multiple
- 0.92×
- Total profit
- $-2,193
- Equity at exit
- $14,314
- IRR
- 6.9%
- Equity multiple
- 1.51×
- Total profit
- $13,629
- Equity at exit
- $8,300
Cash invested: $26,880 (down + closing). Projections, not guarantees.
Landlord ↔ Tenant lean methodology
- Overall (STATE)
- 90 Strongly Landlord-Friendly
- State Indiana
- 90 Strongly Landlord-Friendly · R+11
- County
- — inherits STATE
- City
- — inherits STATE
ZIP-level market 46227
- Rents YoY
- 2.5%
- Active inventory
- 245
- Price-to-rent
- 5.3×
Monthly cashflow live
- Estimated rent
- $1,502 high interval (Pro) →
- Mortgage (P&I)
- −$503
- Tax from tax record
- −$253 /mo · $3,031/yr
- Insurance
- −$40
- HOA
- −$171
- Vacancy / Maint / Mgmt
- −$315
- Net cashflow
- $219
Break-even live
UW: 25.0% down · 7.5% · 30yr · 1.5% tax · 5.0% vac · 8.0% maint · 8.0% mgmt
Financing live
Cash to close
- Down payment
- $24,000
- Closing costs
- $2,880
- Reserves months
- —
- Total cash needed
- —
Loan-product check · same deal, 3 products live
Conventional
25% down · 7.5% · 30yr
- Down + closing
- —
- Monthly P&I
- —
- Monthly cashflow
- —
- DSCR
- —
- Eligible?
- —
Personal DTI + credit; lowest rate.
DSCR
20% down · 8.5% · 30yr
- Down + closing
- —
- Monthly P&I
- —
- Monthly cashflow
- —
- DSCR
- —
- Eligible?
- —
No personal income docs; deal must DSCR.
Hard money
10% down · 12.0% · 12mo
- Down + closing
- —
- Monthly P&I
- —
- Monthly cashflow
- —
- DSCR
- —
- Eligible?
- —
Short-term bridge; refi at stabilization.
Rent comps 35 comps
| Address | Beds | Baths | Sqft | Rent | $/sqft | DOM | Units | Dist |
|---|---|---|---|---|---|---|---|---|
| 8213 Zona Dr Indianapolis, IN | 1.0–3.0 | 1.0–1.5 | 935 | $1,480 | $1.58 | 1d | 16 | 0.28mi |
| 8055 Crossing Dr Indianapolis, IN | 1.0–2.0 | 1.0 | 775 | $1,224 | $1.58 | 2d | 15 | 0.38mi |
| 2816 E County Line Rd Indianapolis, IN | 2.0 | 1.0 | 1265 | $910 | $0.72 | 23d | 1 | 0.48mi |
| 8631 Pleasant Creek Ct Indianapolis, IN | 3.0 | 2.0 | 1120 | $1,706 | $1.52 | 7d | 1 | 0.53mi |
| 7909 Southfield Dr Indianapolis, IN | 3.0 | 2.0 | 1056 | $1,445 | $1.37 | 7d | 1 | 0.53mi |
| 2524 Tamarack Ln Indianapolis, IN | 1.0–2.0 | 1.0 | 655 | $969 | $1.48 | 7d | 7 | 0.56mi |
| 8960 S Keystone Ave Indianapolis, IN | 1.0–2.0 | 1.0 | 881 | $1,270 | $1.44 | 1d | 7 | 0.57mi |
| 8126 Xenia Dr Indianapolis, IN | 3.0 | 2.0 | 1176 | $4,500 | $3.83 | 1d | 1 | 0.61mi |
| 3546 Valley Lake Dr Indianapolis, IN | 3.0 | 1.0 | 984 | $1,645 | $1.67 | 4d | 1 | 0.65mi |
| 3503 Pleasant Lake Dr Indianapolis, IN | 3.0 | 1.0 | 1064 | $1,615 | $1.52 | 12d | 1 | 0.65mi |
| 3717 Piermont Dr Indianapolis, IN | 1.0–3.0 | 1.0–2.0 | 1038 | $1,730 | $1.67 | 2d | 23 | 0.72mi |
| 1933 Lisa Walk Dr Indianapolis, IN | 3.0 | 2.0 | 1374 | $1,670 | $1.22 | 14d | 1 | 0.74mi |
| 3741 Lima Ct Indianapolis, IN | 2.0 | 1.0 | 976 | $1,350 | $1.38 | 7d | 1 | 0.79mi |
| 7913 Ella Dobbs Ln Indianapolis, IN | 1.0–3.0 | 1.0–2.0 | 1021 | $1,650 | $1.62 | 23d | 1 | 0.84mi |
| 1039 N Paz Dr Greenwood, IN | 1.0–2.0 | 1.0 | 800 | $1,193 | $1.49 | 1d | 8 | 0.85mi |
| 8580 Beechmill Ln Indianapolis, IN | 1.0–2.0 | 1.0–1.5 | 794 | $1,265 | $1.59 | 2d | 13 | 0.94mi |
| 921 Parliament Pl Greenwood, IN | 1.0–3.0 | 1.0–2.0 | 994 | $1,525 | $1.53 | 2d | 30 | 0.96mi |
| 14 Greenwood Trl N Greenwood, IN | 2.0 | 1.5 | 1088 | $1,275 | $1.17 | 14d | 1 | 0.99mi |
| 1542 Citrin Pl Unit 7810 Indianapolis, IN | 2.0 | 2.0 | 1027 | $1,505 | $1.47 | 4d | 1 | 1.01mi |
| 1542 Citrin Pl Unit 1538 Indianapolis, IN | 3.0 | 2.5 | 1299 | $1,755 | $1.35 | 16d | 1 | 1.01mi |
| 1542 Citrin Pl Indianapolis, IN | 3.0 | 2.5 | 1299 | $1,755 | $1.35 | 3d | 1 | 1.01mi |
| 968 Greenwood Trl W Greenwood, IN | 2.0 | 2.0 | 1088 | $1,475 | $1.36 | 12d | 1 | 1.02mi |
| 1201 Community Pl Indianapolis, IN | 2.0–3.0 | 1.0–1.5 | 908 | $1,530 | $1.69 | 23d | 3 | 1.15mi |
| 800 Kings Mill Rd Greenwood, IN | 2.0 | 1.0–2.0 | 701 | $1,358 | $1.94 | 1d | 52 | 1.24mi |
| 1009 Lismore Ln Indianapolis, IN | 1.0–2.0 | 1.0–2.0 | 875 | $1,365 | $1.56 | 23d | 1 | 1.26mi |
| 745 Wood Dale Ter Greenwood, IN | 1.0–3.0 | 1.0–1.5 | 1032 | $1,659 | $1.61 | 3d | 10 | 1.27mi |
| 88 Keran Manor Ct Greenwood, IN | 2.0 | 1.0 | 945 | $1,450 | $1.53 | 43d | 1 | 1.29mi |
| 1043 Mikes Way Greenwood, IN | 3.0 | 2.0 | 1090 | $1,650 | $1.51 | 43d | 1 | 1.39mi |
| 622 Wood Dale Ter Greenwood, IN | 1.0–2.0 | 1.0–1.5 | 947 | $1,104 | $1.17 | 23d | 3 | 1.40mi |
| 628 Wooddale Ter Unit 1007 Greenwood, IN | 2.0 | 1.5 | 1013 | $1,104 | $1.09 | 43d | 1 | 1.40mi |
| 614 Park Madison Dr Greenwood, IN | 2.0 | 2.0 | 1150 | $1,250 | $1.09 | 10d | 1 | 1.42mi |
| 601 Wood Dale Ter Greenwood, IN | 2.0 | 1.5 | 960 | $1,174 | $1.22 | 44d | 1 | 1.45mi |
| 600 Wooddale Ter Apt 07 Greenwood, IN | 2.0 | 1.0 | 750 | $999 | $1.33 | 23d | 1 | 1.48mi |
| 600 Wood Dale Ter Greenwood, IN | 2.0 | 1.0 | 750 | $999 | $1.33 | 43d | 1 | 1.48mi |
| 4545 Scarlet Oak Way Indianapolis, IN | 1.0–3.0 | 1.0–2.0 | 1101 | $2,061 | $1.87 | 1d | 16 | 1.48mi |
HOA detail condo
- Monthly dues
- $171 · $2,052/yr
- Likely covers
- pool
- Assessments
- None detected in remarks — confirm with the listing agent.
Listing history 9 events
-
2026-06-10status $96,000 Pending 20 DOM
-
2026-06-09days on market $96,000 Active 20 DOM
-
2026-06-08days on market $96,000 Active 19 DOM
-
2026-06-07days on market $96,000 Active 18 DOM
-
2026-06-03days on market $96,000 Active 14 DOM
-
2026-06-02days on market $96,000 Active 13 DOM
-
2026-06-01days on market $96,000 Active 12 DOM
-
2026-05-31days on market $96,000 Active 11 DOM
-
2026-05-20$120,000 Active
ⓘ Source: listings_history table (triggers on properties + properties_extension) + one-shot
backfill from property_details.listing_events for pre-trigger history.
Tax reassessment forecast IN · Partial reset (capped growth)
- Current annual tax
- $3,031 · $253/mo
- Projected year-2 tax
- $3,031 · $253/mo
- Expected delta
- $0/yr ($0/mo · 0.0%)
ⓘ Screening estimate from a state-policy table — verify with the county assessor before closing.
Climate risk First Street
- Flood 1/10 Low FEMA zone X (unshaded) · 0% chance over 30 yrs
- Wildfire 1/10 Low
- Heat 4/10 Moderate 7 d/yr ≥101°F today · 19 d/yr by 30 yrs out
- Wind 2/10 Low 100% chance of damaging wind over 30 yrs
- Air quality 2/10 Low 2 unhealthy d/yr today · 2 by 30 yrs out
Nearby sold comps map
Loading sold comps map…
Walkable amenities ~0.75 mi
Loading nearby amenities…
Taxation est. · year 1
- Rental income
- $18,019
- − Mortgage interest
- −$5,377
- − Property taxes
- −$3,031
- − Insurance
- −$480
- − Repairs & maintenance
- −$1,442
- − Management
- −$1,442
- − HOA
- −$2,052
- − Depreciation
- −$2,793
- Taxable income
- $1,403
- Est. tax owed @ 24.0%
- −$337
- After-tax cash flow
- $2,294/yr
For passive investors: Depreciation is non-cash, so a rental often shows a tax loss while cash-flowing — sheltering income. Rental losses are passive: they offset passive income freely, and up to $25,000/yr can offset ordinary (W-2) income if you actively participate and your MAGI is under $100k (phasing out to $0 by $150k); unused losses carry forward. On sale, claimed depreciation is recaptured at up to 25%, and gains may owe capital-gains tax (a 1031 exchange can defer both). Figures are a year-1 estimate at your 24.0% rate — not tax advice; consult a CPA.
Schools (NCES district)
- District
- Perry Township Schools
- NCES district ID
- 1808820
- Math proficiency
- 36% ▼ -13.00%
- Reading proficiency
- 45% ▼ -6.00%
- Median HH income
- $47,170
- Composite
- 34.61/100
- National rank
- #5153
- State rank
- #138 of 301 in IN
Livability — Indianapolis city (balance)
No livability data for this city. (Only ~50 U.S. cities are tracked.)
Census & demographics
- Census place
- Indianapolis city (balance), IN
- County
- Marion County · 998,460 people
- City population
- 881,119
- Metro
- Indianapolis-Carmel-Anderson, IN
- Population (ZIP)
- 57,587
- Household income
- $53,629
- Rent vs Own
- Severe rent burden
- 3583.0
Population outlook (Marion County) Hauer SSP2
- Today (2025)
- 1,025,572 people
- By 2030
- 1,065,727 · +3.9%
- By 2040
- 1,141,577 · +11.3%
- By 2050
- 1,208,920 · +17.9%
- By 2075
- 1,367,288 · +33.3%
- By 2100
- 1,438,201 · +40.2%
Race, ethnicity, and origin ACS 2023
- Neighborhood character
- Diverse neighborhood (Simpson 0.59)
- Race & ethnicity
- White 61% Asian 12% Black 11% Hispanic / Latino 10% Two or more races 8%
- Hispanic origin (detail)
- Mexican 8%
- Common ancestry
- Italian 2% Slovak 2% Lithuanian 1%
- Foreign-born
- 17% · Philippines, Canada, Vietnam
- Languages at home
- 79% English-only · Other Asian/Pacific 9% Spanish 7% Other Indo-European 1%
Political lean MEDSL · Marion
- 2024 margin
- Strong D (+27.7) · D 63.0% · R 35.3% · Other 1.7%
- 2008→2024 swing
- -0.7pp no change · 2008: 28.4pp · 2024: 27.7pp
- All cycles
- 2024: D+27.7 2020: D+29.1 2016: D+22.8 2012: D+22.2 2008: D+28.4
Not yet ingested
- Civics
- —
Market trends
- HPI YoY
- ▼ -260.49%
- Current HPI
- 276.8271
- Rent YoY
- ▲ 2.46%
- Metro
- Indianapolis-Carmel-Anderson, IN
- State GDP YoY
- ▲ 2.90%
- F500 in state
- 18
Industry mix (Fortune 500 HQ in IN)
| Industry | F500 HQs | Revenue |
|---|---|---|
| Industrial Machinery | 2 | $37B |
|
||
| Healthcare | 1 | $177B |
|
||
| Pharmaceuticals | 1 | $45B |
|
||
| Metals / Steel | 1 | $18B |
|
||
| Agriculture | 1 | $17B |
|
||
| Packaging | 1 | $12B |
|
||
Price history
1 event — show timeline
- 2026-05-20 Listed $120,000 MIBOR as Distributed by MLS Grid
Property tax history
+21.2%/yrLatest (2025): $3,031 · +5.5% YoY. Source: county tax records.
Cash-flow waterfall
monthlySold comps — $/sqft
last 12 mo · ≤1 miLoading sold comps…