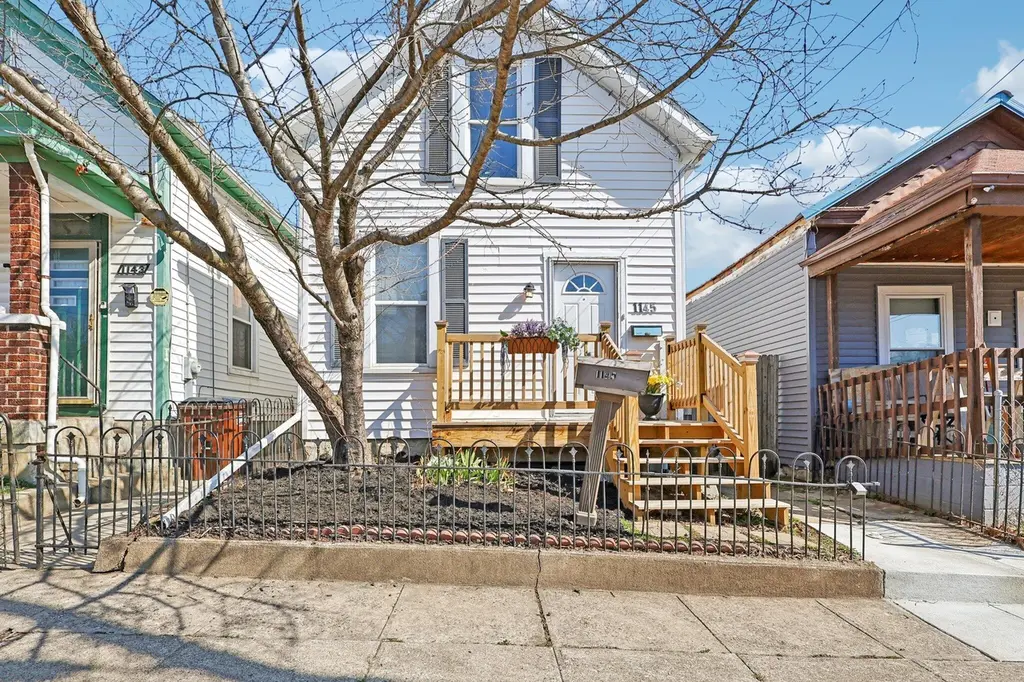
1145 Isabella St · Newport, KY
Flood risk 1/10 · Minimal
- FEMA flood zone
- X (unshaded)
- Chance of flooding over 30 yrs
- 0.0%
- Est. flood insurance / yr
- $473 – $860
Fire risk 1/10 · Minimal
- Est. fire insurance / yr
- $839 – $1,559
Heat risk 5/10 · Moderate
- Hot days now (above 103°F)
- 7 days/yr
- Hot days in 30 yrs
- 20 days/yr
Wind risk 2/10 · Minimal
- Chance of severe wind over 30 yrs
- 1.0%
Air-quality risk 3/10 · Minor
- Unhealthy air days now
- 2 days/yr
- Unhealthy air days in 30 yrs
- 3 days/yr
Risk factors via First Street. Map © Google.
Why this score? — see what drove the C+ grade
The composite is a weighted blend of 9 inputs, each scored 0–100. Each bar is that input's sub-score; the figure is the points it added to the 100-point composite (weight × sub-score).
- Cash flow +28.9/30.0
- DSCR +10.0/10.0
- 1% rule +6.8/10.0
- ARV discount +5.8/15.0
- Livability +4.1/5.0
- Rent growth +3.7/5.0
- Condition / age +2.5/5.0
- Schools +1.7/10.0
- Appreciation +0.0/10.0
$159,900
🖨 Deal sheet (PDF) 📄 Offer letter ✓ Due diligence
Listing remarks MLS
Welcome to this well maintained 3 bedroom, 1 Bathroom home located in Newport! Centrally located to easily access events on either side of the river. This home features a full bathroom, washer and dryer all on the first floor. Major mechanical updates include furnace, central AC, and water heater all being just four years old Newer roof and step outside to a fenced in yard for your pets.
Key facts
- Full bathroom
- Washer and dryer
- Fenced in yard
Tags
Neighborhood map
What this means for you Summary
Snapshot
- This is a 3-bed/1.0-bath single-family listed at $160k.
Deal economics
- At list price, monthly cash flow is $540 ($6k/yr) — positive.
- The deal already cash-flows at list — no discount required.
- Meets the 1% rule at list price ($2k rent vs $160k).
- Recommended offer: $155k (3.0% below list) — sets the bar for market timing.
- Cap rate 10.3% vs local median 4.9% in Newport — top-decile yield for the area; either an underpriced asset or a hidden risk that comps aren't pricing in. Stress-test before assuming the spread holds.
Location & tenants
- Location reads 82/100 on livability (#58 in KY, #1,070 nationally) — a professional / high-income tenant draw. Strengths: amenities A+, commute A+, cost of living A+; Watch: schools D, crime F, employment D-.
- Newport Independent (suburban): math 14% / reading 26% proficiency, ranked #160 of 165 in KY (top 97%) — low school quality limits family demand, transient renter base, plan for 1-2y turnover; 79% free/reduced lunch — lower-income household profile, screen leases tightly.
- Market conditions: Rents rising fast (+4.6%/yr); 236 active listings in the ZIP; 25 comparable units currently listed for rent nearby; rentals leasing fast (median 3d on market — plan ~1-2 weeks tenant-placement turnaround); 247 units permitted in Campbell County in 2024 (77 in 5+ unit buildings).
- This rent runs 38% of the median local income ($60k/yr) — at the standard rent-burdened threshold; future hikes will face affordability resistance.
Forward outlook
- Local home prices are declining (-3.0%/yr); year-one equity from $1k of loan paydown is wiped out by about $5k of value loss. Plan a longer hold.
- At projected returns (-3.0% appreciation + 4.6% rent growth), your $45k cash investment doubles in ~8 years — after that, you're playing with house money.
Negotiation context
- It's been on market 46 days — a 3% lower offer ($155k) is reasonable based on typical stale-listing flexibility.
- 12 sale attempts since 29y ago; this cycle's ask has dropped $15k (9%) from the opening price — seller is motivated, your offer sets the floor, not the list.
Risks & watch-outs
- Watch-outs: built in 1917 — expect roof / HVAC / electrical / plumbing capex.
- Climate carrying-cost: extreme-heat days projected 7→20/yr by 2055 (HVAC capex compounding) — expect insurance premiums to compound above CPI over the hold.
Questions for the listing agent
- It's been on market 46 days. Have you received any prior offers? Is the seller open to a 3% concession, seller financing, or rate buy-down credit?
- Built in 1917 — when were the roof, HVAC, electrical panel, plumbing, and water heater last replaced?
- Is there a deadline driving the sale (1031 exchange, divorce, estate, relocation)? That informs how much negotiation room exists.
- Schools are D-rated, which usually means shorter tenancies and higher turnover. Who's the typical renter profile here, and what's been the actual vacancy rate?
- Crime grade is F in this area — have there been break-ins, vandalism, or insurance claims at this property in the last 3 years? What carrier currently insures it and at what premium?
- What's the average days-on-market for RENTAL listings here right now (not sales)? A rising rental-DOM trend means longer vacancies and softer asking-rent achievability than the comps imply.
- What's the recent tenant-quality profile in this submarket — average credit score on applications, eviction rate, late-payment / NSF rate, and stable-employment percentage? A property-management company in the area should have these aggregated.
- How much new for-sale + rental construction is in the pipeline within 1–3 miles? Heavy new supply typically softens prices + rents 12–24 months out; constrained supply supports both.
Investment metrics
- 1% rule
- 1.18% ✓
- Cap rate
- 10.34%
- Cash-on-cash
- 14.47%
- DSCR
- 1.64
- GRM
- 7.1
CMA / ARV
- ARV (median comp)
- $153,981
- List price
- $159,900
- Delta
- 3.84%
- Verdict
- FAIR
- Comps
- 20 within 1.0 mi
Show comp detail 12 sales within ~0.75 mi
| Address | Dist | Beds/Ba | Sqft | Sold | Price | $/sf | Match |
|---|---|---|---|---|---|---|---|
| 65 Parkview Ave | 0.39mi | 2/1.5 (-1) | 990 (-1%) | 1mo | $182,500 | $184 | 72 |
| 55 Biehl St | 0.23mi | 2/1.0 (-1) | 962 (-4%) | 7mo | $282,500 | $294 | 72 |
| 1037 Putnam St | 0.25mi | 2/2.0 (-1) | 1,065 (+6%) | 2mo | $225,000 | $211 | 67 |
| 1302 John St | 0.34mi | 2/1.0 (-1) | 867 (-13%) | 0mo | $225,000 | $260 | 57 |
| 409 E 13th St | 0.54mi | 2/1.0 (-1) | 1,083 (+8%) | 1mo | $180,000 | $166 | 55 |
| 926 Putnam St | 0.32mi | 2/1.0 (-1) | 857 (-14%) | 6mo | $155,000 | $181 | 51 |
| 308 Elm St | 0.46mi | 3/1.5 | 1,136 (+14%) | 4mo | $190,000 | $167 | 50 |
| 58 16th St | 0.38mi | 2/1.5 (-1) | 1,120 (+12%) | 7mo | $150,000 | $134 | 49 |
| 37 17th St | 0.43mi | 2/1.0 (-1) | 1,141 (+14%) | 7mo | $238,500 | $209 | 46 |
| 930 Park Ave | 0.74mi | 2/2.0 (-1) | 1,053 (+5%) | 3mo | $275,000 | $261 | 46 |
| 319 Elm St | 0.48mi | 2/1.5 (-1) | 850 (-15%) | 0mo | $160,000 | $188 | 45 |
| 2007 Monmouth St | 0.72mi | 2/1.0 (-1) | 1,118 (+12%) | 6mo | $220,000 | $197 | 37 |
Match score weights: distance 35% · size 25% · config 20% · recency 20%. Top-matched comps best support the ARV.
Projected returns pro-forma
-3.0% appreciation · 4.64% rent growth · sell at horizon
- IRR
- 6.5%
- Equity multiple
- 1.26×
- Total profit
- $11,573
- Equity at exit
- $23,842
- IRR
- 17.1%
- Equity multiple
- 2.51×
- Total profit
- $67,532
- Equity at exit
- $13,825
Cash invested: $44,772 (down + closing). Projections, not guarantees.
Landlord ↔ Tenant lean methodology
- Overall (STATE)
- 83 Strongly Landlord-Friendly
- State Kentucky
- 83 Strongly Landlord-Friendly · R+16
- County
- — inherits STATE
- City
- — inherits STATE
ZIP-level market 41071
- Rents YoY
- 4.6%
- Active inventory
- 236
- Price-to-rent
- 7.1×
Monthly cashflow live
- Estimated rent
- $1,890 high interval (Pro) →
- Mortgage (P&I)
- −$839
- Tax from tax record
- −$48 /mo · $576/yr
- Insurance
- −$67
- HOA
- −$0
- Vacancy / Maint / Mgmt
- −$397
- Net cashflow
- $540
Break-even live
Sensitivity live
| Price | -10% $630 | -5% $585 | +0% $540 | +5% $495 | +10% $449 |
|---|---|---|---|---|---|
| Rent | -10% $390 | -5% $465 | +0% $540 | +5% $614 | +10% $689 |
| Rate | -1.0pp $620 | -0.5pp $580 | base $540 | +0.5pp $498 | +1.0pp $456 |
UW: 25.0% down · 7.5% · 30yr · 1.5% tax · 5.0% vac · 8.0% maint · 8.0% mgmt
Financing live
Cash to close
- Down payment
- $39,975
- Closing costs
- $4,797
- Reserves months
- —
- Total cash needed
- —
Loan-product check · same deal, 3 products live
Conventional
25% down · 7.5% · 30yr
- Down + closing
- —
- Monthly P&I
- —
- Monthly cashflow
- —
- DSCR
- —
- Eligible?
- —
Personal DTI + credit; lowest rate.
DSCR
20% down · 8.5% · 30yr
- Down + closing
- —
- Monthly P&I
- —
- Monthly cashflow
- —
- DSCR
- —
- Eligible?
- —
No personal income docs; deal must DSCR.
Hard money
10% down · 12.0% · 12mo
- Down + closing
- —
- Monthly P&I
- —
- Monthly cashflow
- —
- DSCR
- —
- Eligible?
- —
Short-term bridge; refi at stabilization.
Rent comps 25 comps
| Address | Beds | Baths | Sqft | Rent | $/sqft | DOM | Units | Dist |
|---|---|---|---|---|---|---|---|---|
| 128 W 9th St Newport, KY | 2.0 | 1.0 | 1012 | $1,650 | $1.63 | 2d | 1 | 0.30mi |
| 911 Putnam St #2 Newport, KY | 2.0 | 1.0 | 1000 | $1,600 | $1.60 | 22d | 1 | 0.34mi |
| 203 W 8th St Newport, KY | 2.0 | 1.5 | 1456 | $2,300 | $1.58 | 22d | 1 | 0.41mi |
| 1044 Washington Ave #2 Newport, KY | 2.0 | 2.0 | 1250 | $1,800 | $1.44 | 44d | 1 | 0.49mi |
| 344 E 13th St Unit 1 Covington, KY | 2.0 | 1.0 | 1000 | $1,275 | $1.27 | 24d | 1 | 0.60mi |
| 814 Washington Ave Unit 2 Newport, KY | 2.0 | 2.0 | 1450 | $1,500 | $1.03 | 24d | 1 | 0.61mi |
| 929 Boone St Newport, KY | 2.0 | 2.0 | 1458 | $1,495 | $1.03 | 44d | 1 | 0.64mi |
| 210 W 5th St Newport, KY | 1.0–2.0 | 1.0–2.0 | 845 | $1,800 | $2.13 | 3d | 15 | 0.64mi |
| 1025 Scott St Unit 2 Covington, KY | 2.0 | 2.0 | 1100 | $1,800 | $1.64 | 3d | 1 | 0.86mi |
| 508 Greenup St Unit 508-02 Covington, KY | 2.0 | 1.0 | 1220 | $1,800 | $1.48 | 2d | 1 | 0.86mi |
| 100 Aqua Way Newport, KY | 1.0–3.0 | 1.0–2.0 | 1092 | $3,850 | $3.53 | 2d | 4 | 0.97mi |
| 1914 Eastern Ave Apt 1 Covington, KY | 2.0 | 1.0 | 750 | $1,200 | $1.60 | 24d | 1 | 0.98mi |
| 2335 Alexandria Pike Southgate, KY | 2.0 | 1.0 | 557 | $1,140 | $2.04 | 2d | 17 | 1.00mi |
| 103 E 3rd St Covington, KY | 2.0 | 2.5 | 1291 | $3,250 | $2.52 | 2d | 1 | 1.03mi |
| 512 Wallace Ave Unit 512/18 Covington, KY | 2.0 | 2.0 | 900 | $1,299 | $1.44 | 8d | 1 | 1.17mi |
| 50 W Rivercenter Blvd Covington, KY | 1.0–2.0 | 1.0–2.5 | 1273 | $3,640 | $2.86 | 2d | 9 | 1.23mi |
| 3949 Vision CIR Southgate, KY | 1.0–2.0 | 1.0–2.0 | 1132 | $2,515 | $2.22 | 2d | 10 | 1.25mi |
| 621 E Mehring Way Cincinnati, OH | 1.0–2.0 | 1.0–2.0 | 938 | $2,249 | $2.40 | 2d | 12 | 1.33mi |
| 601 E Pete Rose Way Cincinnati, OH | 3.0 | 1.0–2.5 | 1039 | $2,936 | $2.83 | 2d | 22 | 1.35mi |
| 1700 Aspen Pines Dr Wilder, KY | 1.0–3.0 | 1.0–2.5 | 1420 | $2,365 | $1.67 | 2d | 14 | 1.41mi |
| 121 E Freedom Way Cincinnati, OH | 2.0 | 1.0–2.0 | 988 | $2,999 | $3.03 | 2d | 27 | 1.41mi |
| 515 Main St Covington, KY | 1.0–2.0 | 1.0–2.0 | 934 | $2,215 | $2.37 | 2d | 8 | 1.42mi |
| 239 Grandview Ave Bellevue, KY | 2.0 | 2.0 | 1093 | $1,645 | $1.50 | 5d | 2 | 1.43mi |
| 35 Gettysburg Square Rd Fort Thomas, KY | 1.0–2.0 | 1.0 | 800 | $1,630 | $2.04 | 3d | 29 | 1.46mi |
| 309 Sycamore St #201 Cincinnati, OH | 2.0 | 2.0 | 850 | $1,600 | $1.88 | 24d | 1 | 1.48mi |
Listing history 44 events
-
2026-05-15status Pending 390-char remark
Show marketing remark (390 chars)
Welcome to this well maintained 3 bedroom, 1 Bathroom home located in Newport! Centrally located to easily access events on either side of the river. This home features a full bathroom, washer and dryer all on the first floor. Major mechanical updates include furnace, central AC, and water heater all being just four years old Newer roof and step outside to a fenced in yard for your pets.
-
2026-04-24status Active 390-char remark
Show marketing remark (390 chars)
Welcome to this well maintained 3 bedroom, 1 Bathroom home located in Newport! Centrally located to easily access events on either side of the river. This home features a full bathroom, washer and dryer all on the first floor. Major mechanical updates include furnace, central AC, and water heater all being just four years old Newer roof and step outside to a fenced in yard for your pets.
-
2026-03-26status Pending 390-char remark
Show marketing remark (390 chars)
Welcome to this well maintained 3 bedroom, 1 Bathroom home located in Newport! Centrally located to easily access events on either side of the river. This home features a full bathroom, washer and dryer all on the first floor. Major mechanical updates include furnace, central AC, and water heater all being just four years old Newer roof and step outside to a fenced in yard for your pets.
-
2026-03-24price $159,900 390-char remark
Show marketing remark (390 chars)
Welcome to this well maintained 3 bedroom, 1 Bathroom home located in Newport! Centrally located to easily access events on either side of the river. This home features a full bathroom, washer and dryer all on the first floor. Major mechanical updates include furnace, central AC, and water heater all being just four years old Newer roof and step outside to a fenced in yard for your pets.
-
2026-03-01$174,900 Active 390-char remark
Show marketing remark (390 chars)
Welcome to this well maintained 3 bedroom, 1 Bathroom home located in Newport! Centrally located to easily access events on either side of the river. This home features a full bathroom, washer and dryer all on the first floor. Major mechanical updates include furnace, central AC, and water heater all being just four years old Newer roof and step outside to a fenced in yard for your pets.
-
2025-12-05historical
-
2025-08-25price $162,900
-
2025-08-06price $169,900
-
2025-07-26price $172,900
-
2025-07-24price $179,900
-
2025-07-11price $184,900
-
2025-07-09price $189,900
-
2025-07-06price $193,900
-
2025-06-22price $199,900
-
2025-06-14price $204,900
-
2025-06-05$209,900 Active
-
2023-08-01soldstatus $140,000
-
2023-07-27soldstatus $140,000 Sold
-
2023-06-27status Pending
-
2023-06-12status Active
-
2023-05-04status Pending
-
2023-04-25status Active
-
2023-04-17status Pending
-
2023-04-13$140,000 Active
-
2022-04-13soldstatus $110,000
-
2022-03-29soldstatus $110,000 Sold
-
2022-03-04status Pending
-
2021-12-08status Active
-
2021-11-27status Pending
-
2021-11-11$125,000 Active
-
2018-03-22soldstatus $85,000
-
2017-12-07soldstatus $68,900
-
2017-12-06soldstatus $68,900
-
2017-09-15$69,900
-
2008-09-30historical
-
2008-02-12$79,900
-
2007-02-27soldstatus $36,000
-
2007-02-16soldstatus $36,000
-
2007-01-16$39,900
-
1997-12-19soldstatus $25,000
-
1997-11-06soldstatus $25,000
-
1997-09-15$29,900
-
1994-10-31soldstatus $38,500
-
1987-09-10soldstatus $21,500
ⓘ Source: listings_history table (triggers on properties + properties_extension) + one-shot
backfill from property_details.listing_events for pre-trigger history.
Tax reassessment forecast KY · Resets to sale price
- Current annual tax
- $576 · $48/mo
- Projected year-2 tax
- $1,375 · $115/mo
- Expected delta
- +$799/yr (+$67/mo · 138.6%)
ⓘ Screening estimate from a state-policy table — verify with the county assessor before closing.
Climate risk First Street
- Flood 1/10 Low FEMA zone X (unshaded) · 0% chance over 30 yrs
- Wildfire 1/10 Low
- Heat 5/10 Major 7 d/yr ≥103°F today · 20 d/yr by 30 yrs out
- Wind 2/10 Low 100% chance of damaging wind over 30 yrs
- Air quality 3/10 Moderate 2 unhealthy d/yr today · 3 by 30 yrs out
Nearby sold comps map
Loading sold comps map…
Walkable amenities ~0.75 mi
Loading nearby amenities…
Taxation est. · year 1
- Rental income
- $22,678
- − Mortgage interest
- −$8,957
- − Property taxes
- −$576
- − Insurance
- −$800
- − Repairs & maintenance
- −$1,814
- − Management
- −$1,814
- − Depreciation
- −$4,652
- Taxable income
- $4,065
- Est. tax owed @ 24.0%
- −$976
- After-tax cash flow
- $5,502/yr
For passive investors: Depreciation is non-cash, so a rental often shows a tax loss while cash-flowing — sheltering income. Rental losses are passive: they offset passive income freely, and up to $25,000/yr can offset ordinary (W-2) income if you actively participate and your MAGI is under $100k (phasing out to $0 by $150k); unused losses carry forward. On sale, claimed depreciation is recaptured at up to 25%, and gains may owe capital-gains tax (a 1031 exchange can defer both). Figures are a year-1 estimate at your 24.0% rate — not tax advice; consult a CPA.
Schools (NCES district)
- District
- Newport Independent
- NCES district ID
- 2104440
- Math proficiency
- 14% ▼ -11.00%
- Reading proficiency
- 26% ▼ -6.00%
- Median HH income
- $35,783
- Composite
- 16.51/100
- National rank
- #9182
- State rank
- #160 of 165 in KY
Livability — Newport
- Score
- 82/100
- State rank
- #58
- US rank
- #1070
Category grades
Schools grade is shown separately in the Schools card above.
Census & demographics
- Census place
- Newport, KY
- County
- Campbell County · 84,793 people
- City population
- 19,680
- Metro
- Cincinnati, OH-KY-IN
- Population (ZIP)
- 19,680
- Household income
- $59,976
- Rent vs Own
- Severe rent burden
- 1136.0
Population outlook (Campbell County) Hauer SSP2
- Today (2025)
- 95,668 people
- By 2030
- 96,886 · +1.3%
- By 2040
- 97,734 · +2.2%
- By 2050
- 96,413 · +0.8%
- By 2075
- 90,211 · -5.7%
- By 2100
- 79,434 · -17.0%
Race, ethnicity, and origin ACS 2023
- Neighborhood character
- Predominantly White (84%)
- Race & ethnicity
- White 84% Black 7% Two or more races 6% Hispanic / Latino 5%
- Common ancestry
- Slovak 3% Lithuanian 2% Italian 2%
- Foreign-born
- 4% · Canada
- Languages at home
- 95% English-only · Spanish 3% Other Indo-European 1%
Political lean MEDSL · Campbell
- 2024 margin
- R (+19.7) · D 39.2% · R 58.9% · Other 1.9%
- 2008→2024 swing
- +1.2pp toward D · 2008: -20.9pp · 2024: -19.7pp
- All cycles
- 2024: R+19.7 2020: R+18.6 2016: R+24.5 2012: R+22.8 2008: R+20.9
Not yet ingested
- Civics
- —
Market trends
- HPI YoY
- ▼ -193.38%
- Current HPI
- 244.9069
- Rent YoY
- ▲ 4.64%
- Metro
- Cincinnati, OH-KY-IN
- State GDP YoY
- ▲ 1.81%
- F500 in state
- 4
Industry mix (Fortune 500 HQ in KY)
| Industry | F500 HQs | Revenue |
|---|---|---|
| Healthcare | 1 | $118B |
|
||
| Food / Beverage | 1 | $7B |
|
||
Price history
+643.7% since first listed44 events — show timeline
- 2026-05-15 Pending — NKMLS
- 2026-04-24 Relisted — NKMLS
- 2026-03-26 Pending — NKMLS
- 2026-03-24 Price Changed $159,900 NKMLS
- 2026-03-01 Listed $174,900 NKMLS
- 2025-12-05 Listing Removed — ImagineMLS
- 2025-08-25 Price Changed $162,900 ImagineMLS
- 2025-08-06 Price Changed $169,900 ImagineMLS
- 2025-07-26 Price Changed $172,900 ImagineMLS
- 2025-07-24 Price Changed $179,900 ImagineMLS
- 2025-07-11 Price Changed $184,900 ImagineMLS
- 2025-07-09 Price Changed $189,900 ImagineMLS
- 2025-07-06 Price Changed $193,900 ImagineMLS
- 2025-06-22 Price Changed $199,900 ImagineMLS
- 2025-06-14 Price Changed $204,900 ImagineMLS
- 2025-06-05 Listed $209,900 ImagineMLS
- 2023-08-01 Sold (Public Records) $140,000 Public Records
- 2023-07-27 Sold (MLS) $140,000 NKMLS
- 2023-06-27 Pending — NKMLS
- 2023-06-12 Relisted — NKMLS
- 2023-05-04 Pending — NKMLS
- 2023-04-25 Relisted — NKMLS
- 2023-04-17 Pending — NKMLS
- 2023-04-13 Listed $140,000 NKMLS
- 2022-04-13 Sold (Public Records) $110,000 Public Records
- 2022-03-29 Sold (MLS) $110,000 NKMLS
- 2022-03-04 Pending — NKMLS
- 2021-12-08 Relisted — NKMLS
- 2021-11-27 Pending — NKMLS
- 2021-11-11 Listed $125,000 NKMLS
- 2018-03-22 Sold (Public Records) $85,000 Public Records
- 2017-12-07 Sold (Public Records) $68,900 Public Records
- 2017-12-06 Sold (MLS) $68,900 NKMLS
- 2017-09-15 Listed $69,900 NKMLS
- 2008-09-30 Listing Removed — NKMLS
- 2008-02-12 Listed $79,900 NKMLS
- 2007-02-27 Sold (Public Records) $36,000 Public Records
- 2007-02-16 Sold (MLS) $36,000 NKMLS
- 2007-01-16 Listed $39,900 NKMLS
- 1997-12-19 Sold (Public Records) $25,000 Public Records
- 1997-11-06 Sold (MLS) $25,000 NKMLS
- 1997-09-15 Listed $29,900 NKMLS
- 1994-10-31 Sold (Public Records) $38,500 Public Records
- 1987-09-10 Sold (Public Records) $21,500 Public Records
Property tax history
+7.8%/yrLatest (2025): $576 · -3.7% YoY. Source: county tax records.
Cash-flow waterfall
monthlySold comps — $/sqft
last 12 mo · ≤1 miLoading sold comps…