 🏗️ New Construction
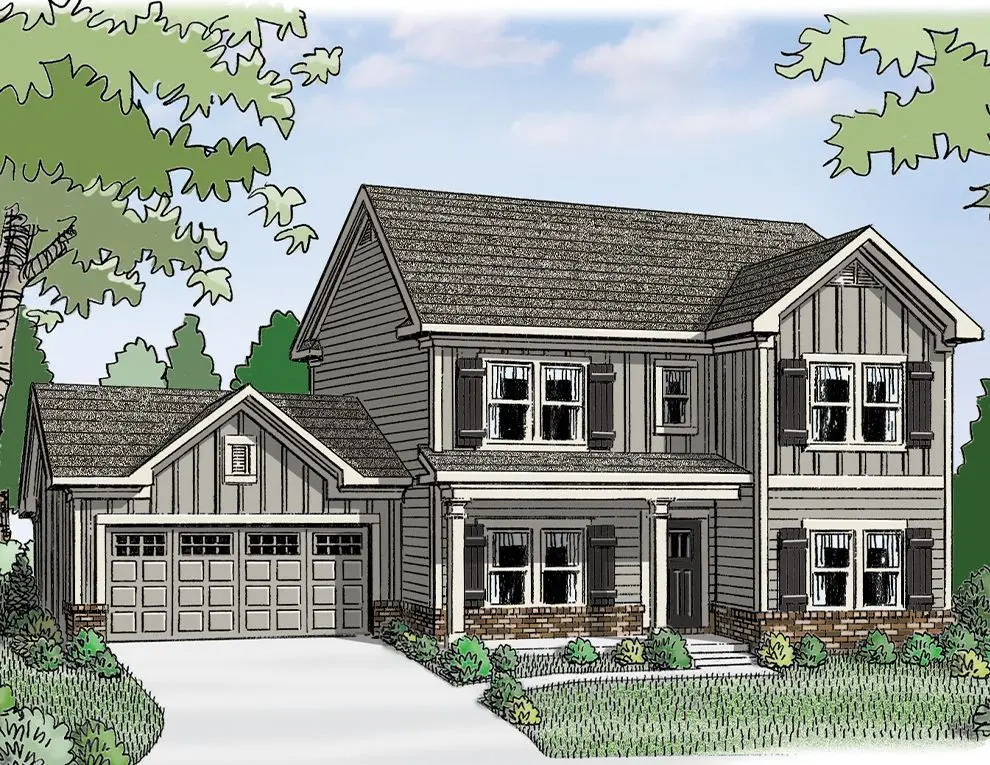
(GA)The Jefferson | Front Entry Plan · Eatonton, GA
Flood risk No data
- FEMA flood zone
- —
- Chance of flooding over 30 yrs
- —
- Est. flood insurance / yr
- —
Fire risk No data
- Est. fire insurance / yr
- —
Heat risk No data
- Hot days now (above threshold)
- —
- Hot days in 30 yrs
- —
Wind risk No data
- Chance of severe wind over 30 yrs
- —
Air-quality risk No data
- Unhealthy air days now
- —
- Unhealthy air days in 30 yrs
- —
Risk factors via First Street. Map © Google.
Why this score? — see what drove the D- grade
The composite is a weighted blend of 9 inputs, each scored 0–100. Each bar is that input's sub-score; the figure is the points it added to the 100-point composite (weight × sub-score).
- Cash flow +9.9/30.0
- ARV discount +7.5/15.0
- Condition / age +5.0/5.0
- Livability +3.6/5.0
- 1% rule +3.0/10.0
- DSCR +2.8/10.0
- Schools +2.7/10.0
- Rent growth +2.5/5.0
- Appreciation +0.0/10.0
$335,900
🖨 Deal sheet 📄 Offer letter ✓ Due diligence
Listing remarks
Unique 4 bedroom / 3 bath home with formal dining room, study and guest room on the main level. The open kitchen with large serving bar, breakfast area and family room with optional fireplace are perfect for entertaining. Walk-in pantry, mud room and entry foyer are additional features on the main level. The Owner's retreat is located upstairs and boasts a trey ceiling, double vanity bath, separate shower and garden tub plus a generous walk-in closet. There are 2 additional bedrooms upstairs, both with walk-in closets.
Key facts
- 2 garage spots
- Listed 27 days
Property features AI
Finance
- Financial info: List price: $340,900
Exterior
- Parking: 2 total parking spaces; 2-car garage
- Home design: Single-family plan (front entry)
- Exterior features: Living area: 2325 (listed)
Interior
- Bedrooms: 4 bedrooms
- Bathrooms: 3 full bathrooms
- Interior features: Plan: The Jefferson (Front Entry)
Neighborhood map
What this means for you Summary
Snapshot
- This is a 4-bed/3.0-bath single-family listed at $336k. Condition is rated excellent.
Deal economics
- At list price, monthly cash flow is $-265 ($-3k/yr) — negative.
- The deal already cash-flows at list — no discount required.
- Meets the 1% rule at list price ($3k rent vs $336k).
- Recommended offer: $331k (1.5% below list) — sets the bar for market timing.
- Cap rate 5.5% vs local median 4.2% in Eatonton — top-decile yield for the area; either an underpriced asset or a hidden risk that comps aren't pricing in. Stress-test before assuming the spread holds.
Location & tenants
- Location reads 71/100 on livability (#76 in GA) — a middle-class / working-renter tenant base. Strengths: cost of living A+, housing A+, crime A; Watch: schools F, amenities F, commute F.
- Putnam County (rural): math 33% / reading 30% proficiency, ranked #86 of 174 in GA (top 49%) — families likely to look elsewhere, expect single-tenant / working-renter base with shorter leases; 69% free/reduced lunch — lower-income household profile, screen leases tightly.
- Market conditions: 522 active listings in the ZIP; 2 comparable units currently listed for rent nearby; 129 units permitted in Putnam County in 2024 (50 in 5+ unit buildings).
- At $3,407/mo this rent would consume 62% of the median local household income ($66k/yr) (locally 696% of renters already pay >50% of income on rent) — very limited rent-growth headroom before tenants either downsize or default.
Forward outlook
- Local home prices are declining (-3.0%/yr); year-one equity from $3k of loan paydown is wiped out by about $13k of value loss. Plan a longer hold.
- Putnam County population projected at -18% by 2050 — secular population decline; favor cash flow + early exit over multi-decade hold.
Negotiation context
- It's been on market 28 days — a 2% lower offer ($331k) is reasonable based on typical stale-listing flexibility.
Questions for the listing agent
- What do current leases actually rent for vs. the listed asking? Can we see a recent rent roll and the last 12 months of T-12 income?
- Is there a deadline driving the sale (1031 exchange, divorce, estate, relocation)? That informs how much negotiation room exists.
- Schools are F-rated, which usually means shorter tenancies and higher turnover. Who's the typical renter profile here, and what's been the actual vacancy rate?
- The area grade is low — what's the realistic commute time and amenity access for the typical tenant pool here? Any planned neighborhood developments (good or bad) we should know about?
- What's the average days-on-market for RENTAL listings here right now (not sales)? A rising rental-DOM trend means longer vacancies and softer asking-rent achievability than the comps imply.
- What's the recent tenant-quality profile in this submarket — average credit score on applications, eviction rate, late-payment / NSF rate, and stable-employment percentage? A property-management company in the area should have these aggregated.
- How much new for-sale + rental construction is in the pipeline within 1–3 miles? Heavy new supply typically softens prices + rents 12–24 months out; constrained supply supports both.
Investment metrics
- 1% rule
- 0.80% ✗
- Cap rate
- 5.55%
- Cash-on-cash
- -2.65%
- DSCR
- 0.88
- GRM
- 10.5
CMA / ARV
- ARV (on-the-fly)
- $427,800
- Comps found
- 5
Show comp detail 5 sales within ~0.75 mi
| Address | Dist | Beds/Ba | Sqft | Sold | Price | $/sf | Match |
|---|---|---|---|---|---|---|---|
| 118 Lake Dr | 0.42mi | 4/3.5 | 2,437 (+5%) | 6mo | $1,005,000 | $412 | 66 |
| 100 Farriers Ln | 0.43mi | 4/3.0 | 2,655 (+14%) | 14mo | $473,000 | $178 | 45 |
| 106 Farriers Ln | 0.47mi | 4/3.0 | 2,655 (+14%) | 15mo | $489,000 | $184 | 42 |
| 151 Lakemore Dr | 0.53mi | 4/2.5 | 2,608 (+12%) | 15mo | $950,000 | $364 | 41 |
| 110 Farriers Ln | 0.51mi | 4/3.0 | 2,655 (+14%) | 14mo | $483,000 | $182 | 41 |
Match score weights: distance 35% · size 25% · config 20% · recency 20%. Top-matched comps best support the ARV.
Projected returns pro-forma
-3.0% appreciation · 3.0% rent growth · sell at horizon
- IRR
- -20.7%
- Equity multiple
- 0.28×
- Total profit
- $-86,142
- Equity at exit
- $63,786
- IRR
- -13.9%
- Equity multiple
- 0.19×
- Total profit
- $-96,527
- Equity at exit
- $36,988
Cash invested: $119,784 (down + closing). Projections, not guarantees.
Landlord ↔ Tenant lean methodology
- Overall (STATE)
- 90 Strongly Landlord-Friendly
- State Georgia
- 90 Strongly Landlord-Friendly · R+3
- County
- — inherits STATE
- City
- — inherits STATE
ZIP-level market 31024
- Active inventory
- 522
- Price-to-rent
- 8.2×
Monthly cashflow live
- Estimated rent
- $3,407 medium interval (Pro) →
- Mortgage (P&I)
- −$2,243
- Tax est. 1.5%
- −$535 /mo · $6,417/yr
- Insurance
- −$178
- HOA
- −$0
- Vacancy / Maint / Mgmt
- −$715
- Net cashflow
- $-265
Break-even live
UW: 25.0% down · 7.5% · 30yr · 1.5% tax · 5.0% vac · 8.0% maint · 8.0% mgmt
Financing live
Cash to close
- Down payment
- $106,950
- Closing costs
- $12,834
- Reserves months
- —
- Total cash needed
- —
Loan-product check · same deal, 3 products live
Conventional
25% down · 7.5% · 30yr
- Down + closing
- —
- Monthly P&I
- —
- Monthly cashflow
- —
- DSCR
- —
- Eligible?
- —
Personal DTI + credit; lowest rate.
DSCR
20% down · 8.5% · 30yr
- Down + closing
- —
- Monthly P&I
- —
- Monthly cashflow
- —
- DSCR
- —
- Eligible?
- —
No personal income docs; deal must DSCR.
Hard money
10% down · 12.0% · 12mo
- Down + closing
- —
- Monthly P&I
- —
- Monthly cashflow
- —
- DSCR
- —
- Eligible?
- —
Short-term bridge; refi at stabilization.
Rent comps 2 comps
| Address | Beds | Baths | Sqft | Rent | $/sqft | DOM | Units | Dist |
|---|---|---|---|---|---|---|---|---|
| 501 Port Laz Ln Unit 1 Eatonton, GA | 3.0 | 3.5 | 2024 | $2,900 | $1.43 | 21d | 1 | 0.64mi |
| 501 Port Laz Ln Eatonton, GA | 3.0 | 4.0 | 2024 | $2,900 | $1.43 | 21d | 1 | 0.64mi |
Listing history 16 events
-
2026-06-19days on market $335,900 Active 28 DOM
-
2026-06-18days on market $335,900 Active 27 DOM
-
2026-06-17days on market $335,900 Active 26 DOM
-
2026-06-16days on market $335,900 Active 25 DOM
-
2026-06-15days on market $335,900 Active 24 DOM
-
2026-06-14days on market $335,900 Active 22 DOM
-
2026-06-12days on market $335,900 Active 21 DOM
-
2026-06-09days on market $335,900 Active 18 DOM
-
2026-06-08days on market $335,900 Active 17 DOM
-
2026-06-07days on market $335,900 Active 16 DOM
-
2026-06-05pricedays on market $335,900 Active 13 DOM
-
2026-06-03days on market $340,900 Active 12 DOM
-
2026-06-02days on market $340,900 Active 11 DOM
-
2026-06-01days on market $340,900 Active 10 DOM
-
2026-05-31days on market $340,900 Active 9 DOM
-
2026-05-30days on market $340,900 Active 8 DOM
ⓘ Source: listings_history table (triggers on properties + properties_extension) + one-shot
backfill from property_details.listing_events for pre-trigger history.
Nearby sold comps map
Loading sold comps map…
Walkable amenities ~0.75 mi
Loading nearby amenities…
Taxation est. · year 1
- Rental income
- $40,884
- − Mortgage interest
- −$23,963
- − Property taxes
- −$6,417
- − Insurance
- −$2,139
- − Repairs & maintenance
- −$3,271
- − Management
- −$3,271
- − Depreciation
- −$12,445
- Taxable loss
- −$10,622
- Est. tax savings @ 24.0%
- +$2,549
- After-tax cash flow
- $-630/yr
For passive investors: Depreciation is non-cash, so a rental often shows a tax loss while cash-flowing — sheltering income. Rental losses are passive: they offset passive income freely, and up to $25,000/yr can offset ordinary (W-2) income if you actively participate and your MAGI is under $100k (phasing out to $0 by $150k); unused losses carry forward. On sale, claimed depreciation is recaptured at up to 25%, and gains may owe capital-gains tax (a 1031 exchange can defer both). Figures are a year-1 estimate at your 24.0% rate — not tax advice; consult a CPA.
Condition & rehab AI · 8 photos
This home is in excellent condition with no visible repairs or maintenance needed. It offers a well-designed floor plan with a spacious kitchen, owner's suite, and ample outdoor space. The property is move-in ready and would benefit from minor updates to further enhance its value.
Value-add opportunities
- Both Painting exterior and interior walls — Fresh paint enhances curb appeal and interior aesthetics.
- Both Landscaping improvements — Enhanced landscaping can increase both resale and rental value.
- Resale Kitchen appliances — Upgraded appliances can attract more buyers.
- Resale Bathroom fixtures — Modern fixtures can improve the appeal of the bathrooms.
- Resale Flooring in kitchen and bathrooms — Updated flooring can enhance the overall look and feel of the home.
Renovation cost estimate screening
Value-add ROI direction
- Both Painting exterior and interior walls — Fresh paint enhances curb appeal and interior aesthetics. ↑
- Both Landscaping improvements — Enhanced landscaping can increase both resale and rental value. ↑
- Resale Kitchen appliances — Upgraded appliances can attract more buyers. ↑
- Resale Bathroom fixtures — Modern fixtures can improve the appeal of the bathrooms. ↑
- Resale Flooring in kitchen and bathrooms — Updated flooring can enhance the overall look and feel of the home. ↑
ⓘ Cost ranges are severity-bucket heuristics (US national rule-of-thumb). Get contractor quotes + a written scope before underwriting a rehab budget.
Schools (NCES district)
- District
- Putnam County
- NCES district ID
- 1304260
- Math proficiency
- 33% ▼ -5.00%
- Reading proficiency
- 30% ▼ -1.00%
- Median HH income
- $44,038
- Composite
- 26.9/100
- National rank
- #7088
- State rank
- #86 of 174 in GA
Livability — Eatonton
- Score
- 71/100
- State rank
- #76
- US rank
- #6665
Category grades
Schools grade is shown separately in the Schools card above.
Census & demographics
- County
- Putnam County · 21,601 people
- City population
- 21,601
- Metro
- nan
- Population (ZIP)
- 21,601
- Household income
- $65,971
- Rent vs Own
- Severe rent burden
- 696.0
Population outlook (Putnam County) Hauer SSP2
- Today (2025)
- 20,747 people
- By 2030
- 20,163 · -2.8%
- By 2040
- 18,680 · -10.0%
- By 2050
- 17,117 · -17.5%
- By 2075
- 13,269 · -36.0%
- By 2100
- 9,234 · -55.5%
Race, ethnicity, and origin ACS 2023
- Neighborhood character
- Majority White (64%)
- Race & ethnicity
- White 64% Black 26% Hispanic / Latino 7% Two or more races 5%
- Hispanic origin (detail)
- Mexican 4%
- Common ancestry
- Slovak 1% Italian 1% Lithuanian 1%
- Foreign-born
- 6% · Canada
- Languages at home
- 94% English-only · Spanish 5%
Political lean MEDSL · Putnam
- 2024 margin
- Solid R (+42.2) · D 28.7% · R 71.0%
- 2008→2024 swing
- -10.9pp toward R · 2008: -31.4pp · 2024: -42.2pp
- All cycles
- 2024: R+42.2 2020: R+40.9 2016: R+40.0 2012: R+35.8 2008: R+31.4
Not yet ingested
- Civics
- —
Market trends
- HPI YoY
- ▼ -199.84%
- Current HPI
- 269.8265
- Rent YoY
- —
- Metro
- nan
- State GDP YoY
- ▲ 2.66%
- F500 in state
- 28
Industry mix (Fortune 500 HQ in GA)
| Industry | F500 HQs | Revenue |
|---|---|---|
| Paper / Packaging | 2 | $29B |
|
||
| Retail | 1 | $160B |
|
||
| Transportation / Logistics | 1 | $91B |
|
||
| Airlines | 1 | $62B |
|
||
| Consumer Goods | 1 | $47B |
|
||
| Utilities | 1 | $25B |
|
||
Cash-flow waterfall
monthlySold comps — $/sqft
last 12 mo · ≤1 miLoading sold comps…