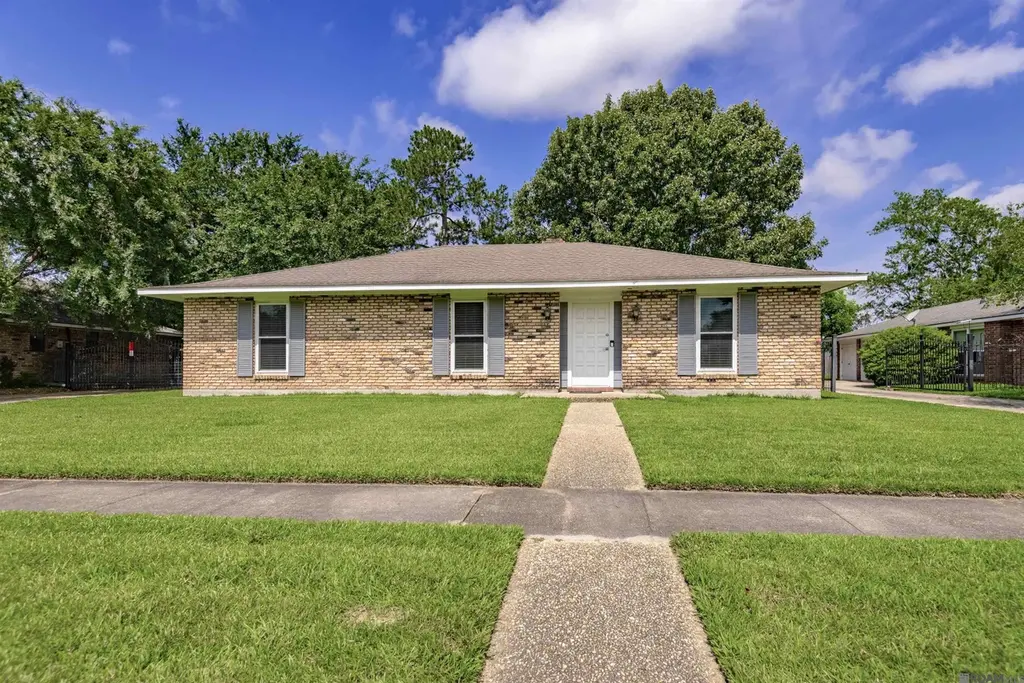
4620 Southwind Dr · Baton Rouge, LA
Flood risk 1/10 · Minimal
- FEMA flood zone
- X
- Chance of flooding over 30 yrs
- 0.0%
- Est. flood insurance / yr
- $507 – $1,088
Fire risk 1/10 · Minimal
- Est. fire insurance / yr
- $1,269 – $2,357
Heat risk 8/10 · Major
- Hot days now (above 108°F)
- 7 days/yr
- Hot days in 30 yrs
- 21 days/yr
Wind risk 9/10 · Severe
- Chance of severe wind over 30 yrs
- 99.0%
Air-quality risk 3/10 · Minor
- Unhealthy air days now
- 2 days/yr
- Unhealthy air days in 30 yrs
- 3 days/yr
Risk factors via First Street. Map © Google.
Why this score? — see what drove the D+ grade
The composite is a weighted blend of 9 inputs, each scored 0–100. Each bar is that input's sub-score; the figure is the points it added to the 100-point composite (weight × sub-score).
- ARV discount +15.0/15.0
- Cash flow +14.3/30.0
- DSCR +4.4/10.0
- Livability +3.7/5.0
- 1% rule +3.4/10.0
- Rent growth +2.5/5.0
- Condition / age +2.5/5.0
- Schools +2.4/10.0
- Appreciation +0.0/10.0
$200,000
🖨 Deal sheet (PDF) 📄 Offer letter ✓ Due diligence
Listing remarks MLS
Opportunity awaits in this charming 3-bedroom, 2-bath home situated on a spacious lot with a fully fenced backyard. While some updates could further enhance the property, several improvements have already been completed, including an updated kitchen, newer laminate flooring throughout the main living areas and bedrooms, and durable ceramic tile flooring in the kitchen and bathrooms. The inviting living room features a vaulted ceiling, exposed brick fireplace, and plenty of natural light, creating a warm and welcoming atmosphere. The spacious kitchen offers painted cabinetry, stainless steel appliances including a gas range and dishwasher, ample counter space, and room for gathering. Step outside to enjoy the oversized covered patio overlooking the private backyard mature trees offer awesome shade. WHOLE HOME generator, 8 ft privacy fence in rear yard. Gate across the drive way. Rear 2 car carport & storage garage with roll up door. A great opportunity for buyers seeking value, space, and the chance to make a home their own. Age of roof is unknown. Flood Zone X. Make appointment for private showing today.
Key facts
- Updated kitchen
- 0.28 acre lot
- 2 parking spots
Tags
Property features AI
Exterior
- Parking: 2 parking spaces total; 2-space carport
- Security: Security system; Smoke detectors
- Utilities: Public water; Public sewer; Cable connected
- Home design: Single-family detached residence; Residential property
- Construction: Frame and brick construction; Composition roof; Slab foundation; Built on level topography
- Exterior features: Covered patio; Outdoor lighting; Full privacy wood fence; Level lot
Interior
- Kitchen: Range; Oven; Dishwasher; Stainless steel appliances; Gas water heater
- Flooring: Tile; Ceramic tile; Laminate
- Bathrooms: 2 full bathrooms
- Heating & cooling: Central heating; Central air; Ceiling fans
- Interior features: Cathedral ceilings; Beamed ceilings; Walk-in closets; Window treatments; Wood-burning fireplace
- Laundry & utility: Washer hookup inside; Electric dryer hookup
Neighborhood map
What this means for you Summary
Snapshot
- This is a 3-bed/2.0-bath single-family listed at $200k.
Deal economics
- At list price, monthly cash flow is $38 ($452/yr) — positive.
- The deal already cash-flows at list — no discount required.
- To meet the 1% rule (rent ≥ 1% of price), the offer needs to be $168k (16.1% below list).
- Recommended offer: $168k (16.1% below list) — sets the bar for 1% rule.
- Cap rate 6.5% vs local median 4.2% in Baton Rouge — top-decile yield for the area; either an underpriced asset or a hidden risk that comps aren't pricing in. Stress-test before assuming the spread holds.
Location & tenants
- Location reads 74/100 on livability (#24 in LA, #4,535 nationally) — a middle-class / working-renter tenant base. Strengths: commute A+, cost of living A+, health & safety A+; Watch: amenities D, crime F, employment D-.
- East Baton Rouge Parish (urban): math 22% / reading 34% proficiency, ranked #47 of 98 in LA (top 48%) — low school quality limits family demand, transient renter base, plan for 1-2y turnover; 77% free/reduced lunch — lower-income household profile, screen leases tightly.
- Zoned schools: Parkview Elementary School (math 47% / reading 64%, grade C, #89 of 646 statewide, top 14%, 539 students, 68% FRL); Woodlawn Middle School (math 20% / reading 39%, grade F, #116 of 218 statewide, top 53%, 887 students, 69% FRL); Woodlawn High School (math 25% / reading 30%, grade F, #133 of 265 statewide, top 51%, 1,527 students, 62% FRL).
- Market conditions: Rents flat; 255 active listings in the ZIP; 22 comparable units currently listed for rent nearby; rentals at typical pace (median 25d on market — plan ~3-4 weeks tenant-placement turnaround); 45% of comp listings sitting > 30 days — soft ceiling on asking rent; 2,252 units permitted in East Baton Rouge Parish in 2024 (440 in 5+ unit buildings).
Forward outlook
- Local home prices are declining (-3.0%/yr); year-one equity from $1k of loan paydown is wiped out by about $6k of value loss. Plan a longer hold.
- East Baton Rouge County population projected at +4% by 2050 — modest demand growth; plan on rents tracking national, not racing it.
Negotiation context
- Only 1 days on market — expect competitive offers; lowballing is unlikely to land.
- 4 sale attempts since 12y ago with the ask held roughly flat each time — persistent listings suggest the price (not the market) is what's stuck; bring a comps-based counter.
- Current owner paid $155k; 29% above their basis — modest negotiation headroom, anchor on the comps not their cost.
Risks & watch-outs
- Climate carrying-cost: severe wind risk, 99% chance of damaging wind over 30y; extreme-heat days projected 7→21/yr by 2055 (HVAC capex compounding) — expect insurance premiums to compound above CPI over the hold.
Questions for the listing agent
- Is there a deadline driving the sale (1031 exchange, divorce, estate, relocation)? That informs how much negotiation room exists.
- Crime grade is F in this area — have there been break-ins, vandalism, or insurance claims at this property in the last 3 years? What carrier currently insures it and at what premium?
- The area grade is low — what's the realistic commute time and amenity access for the typical tenant pool here? Any planned neighborhood developments (good or bad) we should know about?
- What's the average days-on-market for RENTAL listings here right now (not sales)? A rising rental-DOM trend means longer vacancies and softer asking-rent achievability than the comps imply.
- What's the recent tenant-quality profile in this submarket — average credit score on applications, eviction rate, late-payment / NSF rate, and stable-employment percentage? A property-management company in the area should have these aggregated.
- How much new for-sale + rental construction is in the pipeline within 1–3 miles? Heavy new supply typically softens prices + rents 12–24 months out; constrained supply supports both.
Investment metrics
- 1% rule
- 0.84% ✗
- Cap rate
- 6.52%
- Cash-on-cash
- 0.81%
- DSCR
- 1.04
- GRM
- 9.9
CMA / ARV
- ARV (on-the-fly)
- $254,400
- Comps found
- 12
Show comp detail 12 sales within ~0.75 mi
| Address | Dist | Beds/Ba | Sqft | Sold | Price | $/sf | Match |
|---|---|---|---|---|---|---|---|
| 4817 Shadeland Dr | 0.13mi | 3/2.0 | 1,804 (+6%) | 2mo | $249,700 | $138 | 81 |
| 4939 Sweet Birch Dr | 0.27mi | 3/2.0 | 1,757 (+4%) | 2mo | $280,000 | $159 | 80 |
| 4637 Tartan Dr | 0.10mi | 3/2.0 | 1,813 (+7%) | 7mo | $219,000 | $121 | 78 |
| 4212 Stumberg Ln | 0.38mi | 3/2.0 | 1,639 (-3%) | 2mo | $219,000 | $134 | 75 |
| 4634 Doral Dr | 0.21mi | 4/2.0 (+1) | 1,867 (+10%) | 8mo | $180,000 | $96 | 62 |
| 12829 Stutgart Ave | 0.46mi | 3/2.0 | 1,903 (+12%) | 1mo | $320,000 | $168 | 58 |
| 13013 Carrington Place Ave | 0.43mi | 3/2.0 | 1,903 (+12%) | 7mo | $285,000 | $150 | 54 |
| 5130 Stumberg Ln | 0.39mi | 4/2.5 (+1) | 1,516 (-11%) | 8mo | $225,000 | $148 | 51 |
| 5431 Parkknoll Place Dr | 0.55mi | 3/2.0 | 1,936 (+14%) | 1mo | $360,000 | $186 | 50 |
| 5003 S Laurel Creek Ct | 0.61mi | 3/2.0 | 1,898 (+12%) | 2mo | $285,000 | $150 | 50 |
| 4130 Country Glen Dr | 0.66mi | 3/2.0 | 1,530 (-10%) | 6mo | $225,000 | $147 | 47 |
| 5638 Hidden Ridge Ln | 0.70mi | 3/2.0 | 1,848 (+9%) | 7mo | $298,500 | $162 | 47 |
Match score weights: distance 35% · size 25% · config 20% · recency 20%. Top-matched comps best support the ARV.
Projected returns pro-forma
-3.0% appreciation · 0.16% rent growth · sell at horizon
- IRR
- -18.1%
- Equity multiple
- 0.38×
- Total profit
- $-34,705
- Equity at exit
- $29,821
- IRR
- -16.5%
- Equity multiple
- 0.19×
- Total profit
- $-45,341
- Equity at exit
- $17,292
Cash invested: $56,000 (down + closing). Projections, not guarantees.
Landlord ↔ Tenant lean methodology
- Overall (STATE)
- 90 Strongly Landlord-Friendly
- State Louisiana
- 90 Strongly Landlord-Friendly · R+12
- County
- — inherits STATE
- City
- — inherits STATE
ZIP-level market 70816
- Rents YoY
- 0.2%
- Active inventory
- 255
- Price-to-rent
- 9.9×
Monthly cashflow live
- Estimated rent
- $1,678 high interval (Pro) →
- Mortgage (P&I)
- −$1,049
- Tax from tax record
- −$156 /mo · $1,871/yr
- Insurance
- −$83
- HOA
- −$0
- Vacancy / Maint / Mgmt
- −$352
- Net cashflow
- $38
Break-even live
Sensitivity live
| Price | -10% $151 | -5% $94 | +0% $38 | +5% $-19 | +10% $-76 |
|---|---|---|---|---|---|
| Rent | -10% $-95 | -5% $-29 | +0% $38 | +5% $104 | +10% $170 |
| Rate | -1.0pp $138 | -0.5pp $89 | base $38 | +0.5pp $-14 | +1.0pp $-67 |
UW: 25.0% down · 7.5% · 30yr · 1.5% tax · 5.0% vac · 8.0% maint · 8.0% mgmt
Financing live
Cash to close
- Down payment
- $50,000
- Closing costs
- $6,000
- Reserves months
- —
- Total cash needed
- —
Loan-product check · same deal, 3 products live
Conventional
25% down · 7.5% · 30yr
- Down + closing
- —
- Monthly P&I
- —
- Monthly cashflow
- —
- DSCR
- —
- Eligible?
- —
Personal DTI + credit; lowest rate.
DSCR
20% down · 8.5% · 30yr
- Down + closing
- —
- Monthly P&I
- —
- Monthly cashflow
- —
- DSCR
- —
- Eligible?
- —
No personal income docs; deal must DSCR.
Hard money
10% down · 12.0% · 12mo
- Down + closing
- —
- Monthly P&I
- —
- Monthly cashflow
- —
- DSCR
- —
- Eligible?
- —
Short-term bridge; refi at stabilization.
Rent comps 22 comps
| Address | Beds | Baths | Sqft | Rent | $/sqft | DOM | Units | Dist |
|---|---|---|---|---|---|---|---|---|
| 12417 Coursey Blvd Baton Rouge, LA | 3.0 | 2.0 | 1679 | $1,800 | $1.07 | 25d | 1 | 0.10mi |
| 12138 Coursey Blvd #1 Baton Rouge, LA | 2.0 | 1.5 | 1150 | $1,550 | $1.35 | 25d | 1 | 0.26mi |
| 5017 Parkoaks Dr Baton Rouge, LA | 3.0 | 2.0 | 2107 | $1,950 | $0.93 | 45d | 1 | 0.31mi |
| 4360 Stumberg Ln Baton Rouge, LA | 2.0 | 2.5 | 1100 | $1,300 | $1.18 | 45d | 1 | 0.35mi |
| 5050 Stumberg Ln Baton Rouge, LA | 3.0 | 2.0 | 1591 | $1,950 | $1.23 | 25d | 1 | 0.36mi |
| 4138 Stumberg Ln Baton Rouge, LA | 3.0 | 2.0 | 1477 | $1,925 | $1.30 | 45d | 1 | 0.37mi |
| 4126 Stumberg Ln Baton Rouge, LA | 3.0 | 2.0 | 1480 | $2,150 | $1.45 | 16d | 1 | 0.40mi |
| 12784 Brogdon Ln Unit 12784-H Baton Rouge, LA | 2.0 | 2.0 | 1100 | $1,100 | $1.00 | 45d | 1 | 0.44mi |
| 5159 S Oaks Dr Baton Rouge, LA | 2.0 | 2.5 | 1200 | $1,500 | $1.25 | 45d | 1 | 0.48mi |
| 5113 Sandy Ridge Dr Baton Rouge, LA | 3.0 | 2.0 | 1812 | $1,695 | $0.94 | 23d | 1 | 0.80mi |
| 4644 Grenache Dr Baton Rouge, LA | 4.0 | 3.0 | 2159 | $2,250 | $1.04 | 25d | 1 | 0.88mi |
| 13675 Coursey Blvd Baton Rouge, LA | 1.0–3.0 | 1.0–2.0 | 951 | $1,300 | $1.37 | 45d | 23 | 0.88mi |
| 5908 Stumberg Ln #21 Baton Rouge, LA | 2.0 | 2.0 | 1588 | $1,600 | $1.01 | 45d | 1 | 1.04mi |
| 6212 Stumberg Ln Baton Rouge, LA | 3.0 | 2.0 | 1424 | $1,500 | $1.05 | 45d | 1 | 1.07mi |
| 4630 Southpark Dr Baton Rouge, LA | 3.0 | 2.0 | 1364 | $1,400 | $1.03 | 25d | 1 | 1.09mi |
| 14142 Watercrest Ln Baton Rouge, LA | 3.0 | 3.0 | 1875 | $2,300 | $1.23 | 16d | 1 | 1.10mi |
| 4719 Mendocino Way Baton Rouge, LA | 4.0 | 2.0 | 1704 | $2,200 | $1.29 | 16d | 1 | 1.23mi |
| 11151 Stanley Aubin Ln Baton Rouge, LA | 3.0 | 2.0 | 1265 | $1,450 | $1.15 | 45d | 1 | 1.33mi |
| 10854 Woodland Oaks Dr Baton Rouge, LA | 3.0 | 2.0 | 2084 | $2,150 | $1.03 | 16d | 1 | 1.34mi |
| 3237 Toulon Dr Apt 7 Baton Rouge, LA | 2.0 | 1.5 | 1100 | $875 | $0.80 | 45d | 1 | 1.36mi |
| 10655 Woodland Oaks Dr Baton Rouge, LA | 3.0 | 2.0 | 1852 | $2,200 | $1.19 | 16d | 1 | 1.44mi |
| 11070 Mead Rd Baton Rouge, LA | 1.0–2.0 | 1.0–2.0 | 836 | $1,284 | $1.53 | 16d | 19 | 1.47mi |
Listing history 3 events
-
2026-06-22status $200,000 Active 1 DOM
-
2026-06-14remarks 699-char remark
-
2026-06-14$200,000 Pending 1 DOM
ⓘ Source: listings_history table (triggers on properties + properties_extension) + one-shot
backfill from property_details.listing_events for pre-trigger history.
Tax reassessment forecast LA · Resets to sale price
- Current annual tax
- $1,871 · $156/mo
- Projected year-2 tax
- $1,871 · $156/mo
- Expected delta
- $0/yr ($0/mo · 0.0%)
ⓘ Screening estimate from a state-policy table — verify with the county assessor before closing.
Climate risk First Street
- Flood 1/10 Low FEMA zone X · 0% chance over 30 yrs
- Wildfire 1/10 Low
- Heat 8/10 Severe 7 d/yr ≥108°F today · 21 d/yr by 30 yrs out
- Wind 9/10 Extreme 99% chance of damaging wind over 30 yrs
- Air quality 3/10 Moderate 2 unhealthy d/yr today · 3 by 30 yrs out
Nearby sold comps map
Loading sold comps map…
Walkable amenities ~0.75 mi
Loading nearby amenities…
Taxation est. · year 1
- Rental income
- $20,137
- − Mortgage interest
- −$11,203
- − Property taxes
- −$1,871
- − Insurance
- −$1,000
- − Repairs & maintenance
- −$1,611
- − Management
- −$1,611
- − Depreciation
- −$5,818
- Taxable loss
- −$2,977
- Est. tax savings @ 24.0%
- +$714
- After-tax cash flow
- $1,166/yr
For passive investors: Depreciation is non-cash, so a rental often shows a tax loss while cash-flowing — sheltering income. Rental losses are passive: they offset passive income freely, and up to $25,000/yr can offset ordinary (W-2) income if you actively participate and your MAGI is under $100k (phasing out to $0 by $150k); unused losses carry forward. On sale, claimed depreciation is recaptured at up to 25%, and gains may owe capital-gains tax (a 1031 exchange can defer both). Figures are a year-1 estimate at your 24.0% rate — not tax advice; consult a CPA.
Schools (NCES district)
- District
- East Baton Rouge Parish
- NCES district ID
- 2200540
- Math proficiency
- 22% ▼ -36.00%
- Reading proficiency
- 34% ▼ -31.00%
- Median HH income
- $46,263
- Composite
- 24.14/100
- National rank
- #7745
- State rank
- #47 of 98 in LA
Livability — Baton Rouge
- Score
- 74/100
- State rank
- #24
- US rank
- #4535
Category grades
Schools grade is shown separately in the Schools card above.
Census & demographics
- Census place
- Baton Rouge, LA
- County
- East Baton Rouge Parish · 399,686 people
- City population
- 351,868
- Metro
- Baton Rouge, LA
- Population (ZIP)
- 45,718
- Household income
- $67,353
- Rent vs Own
- Severe rent burden
- 2162.0
Population outlook (East Baton Rouge County) Hauer SSP2
- Today (2025)
- 464,810 people
- By 2030
- 472,137 · +1.6%
- By 2040
- 480,243 · +3.3%
- By 2050
- 484,422 · +4.2%
- By 2075
- 492,069 · +5.9%
- By 2100
- 476,347 · +2.5%
Race, ethnicity, and origin ACS 2023
- Neighborhood character
- Diverse neighborhood (Simpson 0.67)
- Race & ethnicity
- Black 41% White 38% Hispanic / Latino 11% Two or more races 7% Asian 5%
- Hispanic origin (detail)
- Mexican 3%
- Common ancestry
- Lithuanian 7% Italian 1% Hispanic 1%
- Foreign-born
- 11% · Canada, China, Vietnam
- Languages at home
- 86% English-only · Spanish 9% Chinese 1% Other Indo-European 1%
Political lean MEDSL · East Baton Rouge
- 2024 margin
- D (+11.1) · D 54.5% · R 43.4% · Other 2.1%
- 2008→2024 swing
- +8.9pp toward D · 2008: 2.2pp · 2024: 11.1pp
- All cycles
- 2024: D+11.1 2020: D+13.1 2016: D+9.2 2012: D+5.2 2008: D+2.2
Not yet ingested
- Civics
- —
Market trends
- HPI YoY
- ▼ -161.21%
- Current HPI
- 157.3823
- Rent YoY
- ▲ 0.16%
- Metro
- Baton Rouge, LA
- State GDP YoY
- ▲ 3.29%
- F500 in state
- 10
Industry mix (Fortune 500 HQ in LA)
| Industry | F500 HQs | Revenue |
|---|---|---|
| Telecommunications | 2 | $23B |
|
||
| Utilities | 1 | $12B |
|
||
| Wholesale / Distribution | 1 | $5B |
|
||
| Advertising | 1 | $2B |
|
||
Price history
+25.1% since first listed9 events — show timeline
- 2026-06-13 Pending — AcadianaMLS
- 2026-06-13 Pending — GBRMLS
- 2026-06-12 Listed $200,000 GBRMLS
- 2026-06-12 Listed $200,000 AcadianaMLS
- 2015-01-22 Sold (Public Records) $155,000 Public Records
- 2015-01-20 Sold (MLS) — GBRMLS
- 2014-09-19 Listed $159,900 AcadianaMLS
- 2014-09-19 Listed $159,900 GBRMLS
- 1979-02-07 Sold (Public Records) — Public Records
Property tax history
+24.0%/yrLatest (2025): $1,871 · +4.7% YoY. Source: county tax records.
Cash-flow waterfall
monthlySold comps — $/sqft
last 12 mo · ≤1 miLoading sold comps…