 🏗️ New Construction
Belmont (Autumn Lake) Plan · Louisville/Jefferson County metro government (balance), KY
Flood risk 1/10 · Minimal
- FEMA flood zone
- X
- Chance of flooding over 30 yrs
- 0.0%
- Est. flood insurance / yr
- $507 – $1,088
Fire risk 4/10 · Minor
- Est. fire insurance / yr
- $839 – $1,559
Heat risk 5/10 · Moderate
- Hot days now (above 104°F)
- 7 days/yr
- Hot days in 30 yrs
- 19 days/yr
Wind risk 2/10 · Minimal
- Chance of severe wind over 30 yrs
- 2.0%
Air-quality risk 3/10 · Minor
- Unhealthy air days now
- 2 days/yr
- Unhealthy air days in 30 yrs
- 3 days/yr
Risk factors via First Street. Map © Google.
Why this score? — see what drove the C+ grade
The composite is a weighted blend of 9 inputs, each scored 0–100. Each bar is that input's sub-score; the figure is the points it added to the 100-point composite (weight × sub-score).
- Cash flow +26.7/30.0
- 1% rule +10.0/10.0
- DSCR +9.2/10.0
- ARV discount +7.5/15.0
- Rent growth +3.0/5.0
- Livability +2.5/5.0
- Condition / age +2.5/5.0
- Schools +2.3/10.0
- Appreciation +0.0/10.0
$75,995
🖨 Deal sheet (PDF) 📄 Offer letter ✓ Due diligence
Listing remarks
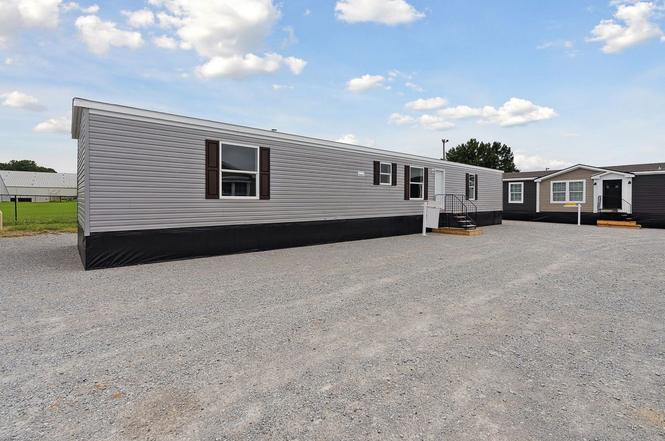
The Belmont offers a smart, spacious layout designed for comfortable everyday living. This thoughtfully designed home features 3 bedrooms and 2 full baths, providing plenty of room for family and guests. At the heart of the home, you'll find a beautiful, well-appointed kitchen that flows seamlessly into an expansive living area with extended length-perfect for entertaining, relaxing, or creating flexible spaces to fit your lifestyle. With its open design and generous proportions, the Belmont delivers both functionality and style in a home that truly feels inviting.
Key facts
- Listed 122 days
Property features AI
Finance
- Other: Address: 2801 Autumn Lake Dr, Louisville KY 40272; Listing status: Active
- Financial info: List price $75,995
- HOA & community: Association fee of $595
Exterior
- Home design: Plan: Belmont (Autumn Lake); New construction plan
- Construction: Living area approximately 1,193; Built as part of Belmont (Autumn Lake) plan
Interior
- Bedrooms: 3 bedrooms
- Bathrooms: 2 full bathrooms
- Interior features: Open living area
Neighborhood map
What this means for you Summary
Snapshot
- This is a 3-bed/2.0-bath manufactured listed at $76k.
Deal economics
- At list price, monthly cash flow is $206 ($2k/yr) — positive.
- The deal already cash-flows at list — no discount required.
- Meets the 1% rule at list price ($2k rent vs $76k).
- Recommended offer: $67k (12.0% below list) — sets the bar for market timing.
- Cap rate 9.6% vs local median 4.0% in Louisville/Jefferson County metro government (balance) — top-decile yield for the area; either an underpriced asset or a hidden risk that comps aren't pricing in. Stress-test before assuming the spread holds.
Location & tenants
- Location reads: area grade C — affects rentability + tenant quality, not the cash-flow math above.
- Jefferson County (urban): math 19% / reading 35% proficiency, ranked #121 of 165 in KY (top 73%) — low school quality limits family demand, transient renter base, plan for 1-2y turnover.
- Market conditions: Rents rising (+2.1%/yr); 218 active listings in the ZIP; 6 comparable units currently listed for rent nearby; rentals leasing fast (median 13d on market — plan ~1-2 weeks tenant-placement turnaround); 2,836 units permitted in Jefferson County in 2024 (1,558 in 5+ unit buildings).
Forward outlook
- Local home prices are declining (-3.0%/yr); year-one equity from $525 of loan paydown is wiped out by about $2k of value loss. Plan a longer hold.
- Jefferson County population projected at +13% by 2050 — modest demand growth; plan on rents tracking national, not racing it.
Negotiation context
- It's been on market 123 days — a 12% lower offer ($67k) is reasonable based on typical stale-listing flexibility.
Risks & watch-outs
- Watch-outs: HOA is 35% of rent.
- Climate carrying-cost: extreme-heat days projected 7→19/yr by 2055 (HVAC capex compounding) — expect insurance premiums to compound above CPI over the hold.
Questions for the listing agent
- It's been on market 123 days. Have you received any prior offers? Is the seller open to a 12% concession, seller financing, or rate buy-down credit?
- What does the HOA fee cover, when was the last increase, and are there any pending special assessments or reserve-fund shortfalls?
- Why hasn't it sold? Are there any deal-killer items the seller is aware of (foundation, flood, title, zoning, code violations)?
- Is there a deadline driving the sale (1031 exchange, divorce, estate, relocation)? That informs how much negotiation room exists.
- What's the average days-on-market for RENTAL listings here right now (not sales)? A rising rental-DOM trend means longer vacancies and softer asking-rent achievability than the comps imply.
- What's the recent tenant-quality profile in this submarket — average credit score on applications, eviction rate, late-payment / NSF rate, and stable-employment percentage? A property-management company in the area should have these aggregated.
- How much new for-sale + rental construction is in the pipeline within 1–3 miles? Heavy new supply typically softens prices + rents 12–24 months out; constrained supply supports both.
Investment metrics
- 1% rule
- 2.21% ✓
- Cap rate
- 9.55%
- Cash-on-cash
- 11.64%
- DSCR
- 1.52
- GRM
- 3.8
CMA / ARV
No comps found within radius.
Projected returns pro-forma
-3.0% appreciation · 2.07% rent growth · sell at horizon
- IRR
- -0.4%
- Equity multiple
- 0.98×
- Total profit
- $-338
- Equity at exit
- $11,331
- IRR
- 7.9%
- Equity multiple
- 1.56×
- Total profit
- $11,947
- Equity at exit
- $6,571
Cash invested: $21,279 (down + closing). Projections, not guarantees.
Landlord ↔ Tenant lean methodology
- Overall (STATE)
- 83 Strongly Landlord-Friendly
- State Kentucky
- 83 Strongly Landlord-Friendly · R+16
- County
- — inherits STATE
- City
- — inherits STATE
ZIP-level market 40272
- Rents YoY
- 2.1%
- Active inventory
- 218
- Price-to-rent
- 3.8×
Monthly cashflow live
- Estimated rent
- $1,679 high interval (Pro) →
- Mortgage (P&I)
- −$399
- Tax est. 1.5%
- −$95 /mo · $1,140/yr
- Insurance
- −$32
- HOA
- −$595
- Vacancy / Maint / Mgmt
- −$353
- Net cashflow
- $206
Break-even live
Sensitivity live
| Price | -10% $259 | -5% $233 | +0% $206 | +5% $180 | +10% $154 |
|---|---|---|---|---|---|
| Rent | -10% $74 | -5% $140 | +0% $206 | +5% $273 | +10% $339 |
| Rate | -1.0pp $245 | -0.5pp $226 | base $206 | +0.5pp $187 | +1.0pp $167 |
UW: 25.0% down · 7.5% · 30yr · 1.5% tax · 5.0% vac · 8.0% maint · 8.0% mgmt
Financing live
Cash to close
- Down payment
- $18,999
- Closing costs
- $2,280
- Reserves months
- —
- Total cash needed
- —
Loan-product check · same deal, 3 products live
Conventional
25% down · 7.5% · 30yr
- Down + closing
- —
- Monthly P&I
- —
- Monthly cashflow
- —
- DSCR
- —
- Eligible?
- —
Personal DTI + credit; lowest rate.
DSCR
20% down · 8.5% · 30yr
- Down + closing
- —
- Monthly P&I
- —
- Monthly cashflow
- —
- DSCR
- —
- Eligible?
- —
No personal income docs; deal must DSCR.
Hard money
10% down · 12.0% · 12mo
- Down + closing
- —
- Monthly P&I
- —
- Monthly cashflow
- —
- DSCR
- —
- Eligible?
- —
Short-term bridge; refi at stabilization.
Rent comps 6 comps
| Address | Beds | Baths | Sqft | Rent | $/sqft | DOM | Units | Dist |
|---|---|---|---|---|---|---|---|---|
| 12306 Glengrove Cir Louisville, KY | 2.0–3.0 | 1.0–2.0 | 1215 | $1,976 | $1.63 | 2d | 36 | 0.54mi |
| 5402 Logwood Ave Louisville, KY | 3.0 | 1.0 | 950 | $1,375 | $1.45 | 12d | 1 | 0.76mi |
| 11711 Wiltonwood Ct Louisville, KY | 3.0 | 1.0 | 1200 | $1,459 | $1.22 | 12d | 1 | 0.88mi |
| 13217 Forge Cir Louisville, KY | 3.0 | 1.5 | 1092 | $1,495 | $1.37 | 2d | 1 | 0.94mi |
| 7019 James Madison Way Louisville, KY | 3.0 | 2.0 | 1374 | $1,750 | $1.27 | 2d | 1 | 1.12mi |
| 6902 Betsy Ross Dr Louisville, KY | 4.0 | 1.0 | 1230 | $1,700 | $1.38 | 15d | 1 | 1.47mi |
HOA detail
- Monthly dues
- $595 · $7,140/yr
Listing history 13 events
-
2026-06-18days on market $75,995 Active 123 DOM
-
2026-06-17days on market $75,995 Active 122 DOM
-
2026-06-16days on market $75,995 Active 121 DOM
-
2026-06-15days on market $75,995 Active 120 DOM
-
2026-06-13days on market $75,995 Active 118 DOM
-
2026-06-10days on market $75,995 Active 115 DOM
-
2026-06-09days on market $75,995 Active 114 DOM
-
2026-06-08days on market $75,995 Active 113 DOM
-
2026-06-07days on market $75,995 Active 112 DOM
-
2026-06-03days on market $75,995 Active 108 DOM
-
2026-06-02days on market $75,995 Active 107 DOM
-
2026-06-01days on market $75,995 Active 106 DOM
-
2026-05-31days on market $75,995 Active 105 DOM
ⓘ Source: listings_history table (triggers on properties + properties_extension) + one-shot
backfill from property_details.listing_events for pre-trigger history.
Climate risk First Street
- Flood 1/10 Low FEMA zone X · 0% chance over 30 yrs
- Wildfire 4/10 Moderate
- Heat 5/10 Major 7 d/yr ≥104°F today · 19 d/yr by 30 yrs out
- Wind 2/10 Low 2% chance of damaging wind over 30 yrs
- Air quality 3/10 Moderate 2 unhealthy d/yr today · 3 by 30 yrs out
Nearby sold comps map
Loading sold comps map…
Walkable amenities ~0.75 mi
Loading nearby amenities…
Taxation est. · year 1
- Rental income
- $20,150
- − Mortgage interest
- −$4,257
- − Property taxes
- −$1,140
- − Insurance
- −$380
- − Repairs & maintenance
- −$1,612
- − Management
- −$1,612
- − HOA
- −$7,140
- − Depreciation
- −$2,211
- Taxable income
- $1,798
- Est. tax owed @ 24.0%
- −$432
- After-tax cash flow
- $2,045/yr
For passive investors: Depreciation is non-cash, so a rental often shows a tax loss while cash-flowing — sheltering income. Rental losses are passive: they offset passive income freely, and up to $25,000/yr can offset ordinary (W-2) income if you actively participate and your MAGI is under $100k (phasing out to $0 by $150k); unused losses carry forward. On sale, claimed depreciation is recaptured at up to 25%, and gains may owe capital-gains tax (a 1031 exchange can defer both). Figures are a year-1 estimate at your 24.0% rate — not tax advice; consult a CPA.
Schools (NCES district)
- District
- Jefferson County
- NCES district ID
- 2102990
- Math proficiency
- 19% ▼ -17.00%
- Reading proficiency
- 35% ▼ -11.00%
- Median HH income
- $47,885
- Composite
- 23.45/100
- National rank
- #7884
- State rank
- #121 of 165 in KY
Livability — Louisville/Jefferson County metro government (balance)
No livability data for this city. (Only ~50 U.S. cities are tracked.)
Census & demographics
- Census place
- Louisville/Jefferson County metro government (balance), KY
- County
- Jefferson County · 790,184 people
- City population
- 419,741
- Metro
- Louisville/Jefferson County, KY-IN
- Population (ZIP)
- 38,289
- Household income
- $69,940
- Rent vs Own
- Severe rent burden
- 702.0
Population outlook (Jefferson County) Hauer SSP2
- Today (2025)
- 823,112 people
- By 2030
- 849,343 · +3.2%
- By 2040
- 895,696 · +8.8%
- By 2050
- 933,630 · +13.4%
- By 2075
- 1,028,262 · +24.9%
- By 2100
- 1,072,675 · +30.3%
Race, ethnicity, and origin ACS 2023
- Neighborhood character
- Predominantly White (77%)
- Race & ethnicity
- White 77% Black 9% Hispanic / Latino 9% Two or more races 9%
- Hispanic origin (detail)
- Mexican 3% Cuban 3%
- Common ancestry
- Slovak 2% Lithuanian 1% Italian 1%
- Foreign-born
- 6% · Canada
- Languages at home
- 92% English-only · Spanish 7%
Political lean MEDSL · Jefferson
- 2024 margin
- D (+16.6) · D 57.4% · R 40.9% · Other 1.7%
- 2008→2024 swing
- +4.5pp toward D · 2008: 12.0pp · 2024: 16.6pp
- All cycles
- 2024: D+16.6 2020: D+20.1 2016: D+13.3 2012: D+11.1 2008: D+12.0
Not yet ingested
- Civics
- —
Market trends
- HPI YoY
- ▼ -262.10%
- Current HPI
- 247.2954
- Rent YoY
- ▲ 2.07%
- Metro
- Louisville/Jefferson County, KY-IN
- State GDP YoY
- ▲ 1.81%
- F500 in state
- 4
Industry mix (Fortune 500 HQ in KY)
| Industry | F500 HQs | Revenue |
|---|---|---|
| Healthcare | 1 | $118B |
|
||
| Food / Beverage | 1 | $7B |
|
||
Cash-flow waterfall
monthlySold comps — $/sqft
last 12 mo · ≤1 miLoading sold comps…