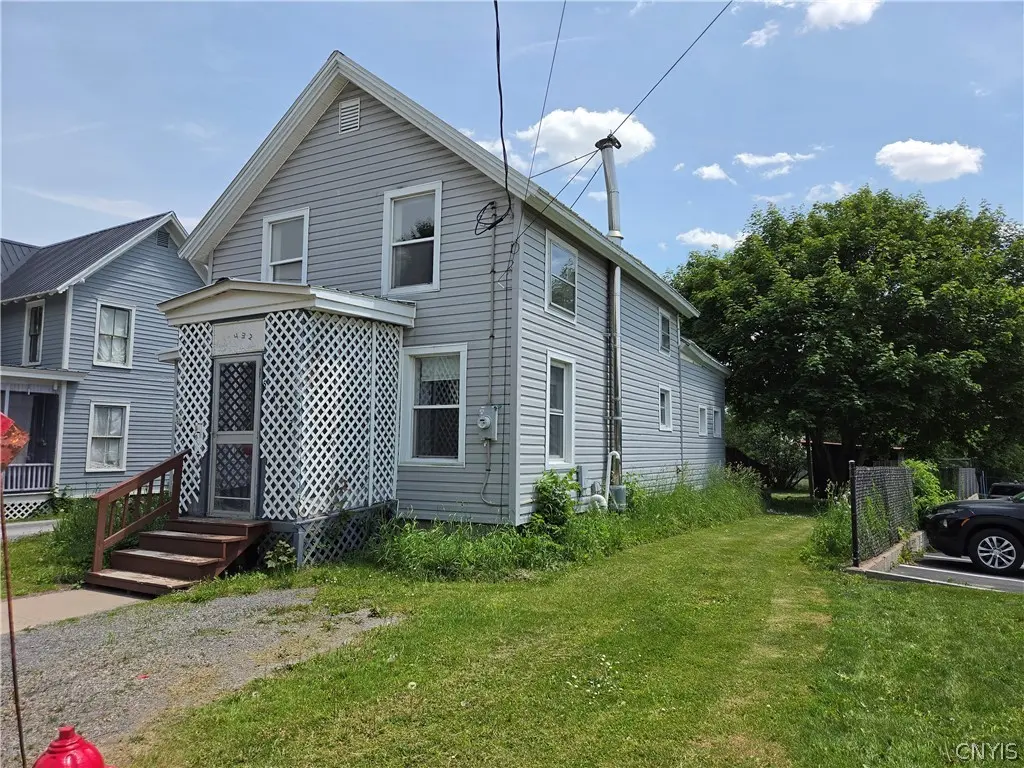
5432 Bostwick St · Lowville, NY
Flood risk 1/10 · Minimal
- FEMA flood zone
- X
- Chance of flooding over 30 yrs
- 0.0%
- Est. flood insurance / yr
- $473 – $860
Fire risk 1/10 · Minimal
- Est. fire insurance / yr
- $691 – $1,283
Heat risk 1/10 · Minimal
- Hot days now (above 91°F)
- 7 days/yr
- Hot days in 30 yrs
- 17 days/yr
Wind risk 1/10 · Minimal
- Chance of severe wind over 30 yrs
- —
Air-quality risk 2/10 · Minimal
- Unhealthy air days now
- 0 days/yr
- Unhealthy air days in 30 yrs
- 1 days/yr
Risk factors via First Street. Map © Google.
Why this score? — see what drove the A- grade
The composite is a weighted blend of 9 inputs, each scored 0–100. Each bar is that input's sub-score; the figure is the points it added to the 100-point composite (weight × sub-score).
- Cash flow +30.0/30.0
- 1% rule +10.0/10.0
- DSCR +10.0/10.0
- Appreciation +10.0/10.0
- ARV discount +7.5/15.0
- Schools +4.5/10.0
- Livability +3.5/5.0
- Rent growth +2.5/5.0
- Condition / age +2.5/5.0
$85,000
🖨 Deal sheet (PDF) 📄 Offer letter ✓ Due diligence
Listing remarks
This village home is a diamond in the rough, looking for a new owner to give it some updates. Home features a first floor living room, dining room with raised platform for wood or pellet stove if desired, a first floor bedroom/ full bath and kitchen. Second level has two additional bedrooms and another full bath. Conveniently located next to school facilities.
Key facts
- Kitchen
- Dining room
- Full bath
Tags
Property features AI
Exterior
- Parking: No garage; Shared driveway (off-street parking)
- Utilities: Public water connected; Sewer connected; Electric service connected
- Home design: Two-story residence; Existing/resale property; Rectangular residential lot; City street frontage; Lot dimensions approximately 38 x 122
- Construction: Frame construction; Blown-in insulation; Stone foundation; Built as existing (year built details: existing)
- Exterior features: Gravel driveway; Shared driveway
Interior
- Kitchen: Gas oven and gas range; Dishwasher; Refrigerator
- Bedrooms: One bedroom on the main level
- Flooring: Carpet; Hardwood; Laminate; Vinyl; Various/varies
- Bathrooms: Two full bathrooms; One full bathroom on the main level
- Heating & cooling: Gas forced-air heating
- Interior features: Separate/formal living room; Country-style kitchen; Bedroom on main level; Full dirt-floored basement
- Laundry & utility: Washer and dryer; Main-level laundry; Electric water heater
Neighborhood map
What this means for you Summary
Snapshot
- This is a 4-bed/1.5-bath single-family listed at $85k.
Deal economics
- At list price, monthly cash flow is $364 ($4k/yr) — positive.
- The deal already cash-flows at list — no discount required.
- Meets the 1% rule at list price ($1k rent vs $85k).
- Recommended offer: $84k (1.5% below list) — sets the bar for market timing.
- Cap rate 11.4% vs local median 3.5% in Lowville — top-decile yield for the area; either an underpriced asset or a hidden risk that comps aren't pricing in. Stress-test before assuming the spread holds.
Location & tenants
- Location reads 69/100 on livability (#490 in NY) — a middle-class / working-renter tenant base. Strengths: cost of living A, housing A-, crime B; Watch: health & safety D, amenities F, commute F.
- Lowville Academy & Central School District (town): math 51% / reading 54% proficiency, ranked #345 of 590 in NY (top 58%) — acceptable for families but not a draw, mixed tenant base, ~2y average lease.
- Zoned schools: Lowville Elementary School (math 55% / reading 52%, grade C, #974 of 2,108 statewide, top 46%, 618 students, 50% FRL); Lowville Middle School (math 34% / reading 57%, grade D+, #337 of 729 statewide, top 47%, 297 students, 46% FRL); Lowville High School (math 98% / reading 30%, grade B-, #808 of 1,100 statewide, top 74%, 367 students, 44% FRL).
- Market conditions: 46 active listings in the ZIP; 110 units permitted in Lewis County in 2024 (0 in 5+ unit buildings).
Forward outlook
- In year one you build about $9k of equity ($588 loan paydown + $8k appreciation (10.0% local appreciation)).
- Lewis County population projected at -20% by 2050 — secular population decline; favor cash flow + early exit over multi-decade hold.
- At projected returns (10.0% appreciation + 3.0% rent growth), your $24k cash investment doubles in ~2 years — after that, you're playing with house money.
- By year 4, paydown + projected appreciation supports a ~$32k cash-out refi (75% LTV) — recoverable capital for the next deal without selling this one.
Negotiation context
- It's been on market 17 days — a 2% lower offer ($84k) is reasonable based on typical stale-listing flexibility.
Risks & watch-outs
- Watch-outs: property tax is 3.4% of price; built in 1900 — expect roof / HVAC / electrical / plumbing capex.
Questions for the listing agent
- Built in 1900 — when were the roof, HVAC, electrical panel, plumbing, and water heater last replaced?
- Property tax is high relative to price — has the assessment been appealed recently, and will the sale trigger a re-assessment?
- Is there a deadline driving the sale (1031 exchange, divorce, estate, relocation)? That informs how much negotiation room exists.
- Schools are A-rated — typically a magnet for longer-tenancy family renters. What's the average tenant stay here, and is there a school-zone premium baked into asking?
- What's the average days-on-market for RENTAL listings here right now (not sales)? A rising rental-DOM trend means longer vacancies and softer asking-rent achievability than the comps imply.
- What's the recent tenant-quality profile in this submarket — average credit score on applications, eviction rate, late-payment / NSF rate, and stable-employment percentage? A property-management company in the area should have these aggregated.
- How much new for-sale + rental construction is in the pipeline within 1–3 miles? Heavy new supply typically softens prices + rents 12–24 months out; constrained supply supports both.
Investment metrics
- 1% rule
- 1.62% ✓
- Cap rate
- 11.44%
- Cash-on-cash
- 18.38%
- DSCR
- 1.82
- GRM
- 5.1
CMA / ARV
- ARV (on-the-fly)
- $214,110
- Comps found
- 12
Show comp detail 12 sales within ~0.75 mi
| Address | Dist | Beds/Ba | Sqft | Sold | Price | $/sf | Match |
|---|---|---|---|---|---|---|---|
| 7679 Sharp St | 0.45mi | 3/2.0 (-1) | 1,604 (+1%) | 3mo | $180,000 | $112 | 67 |
| 5364 Eugene St | 0.23mi | 4/1.5 | 1,707 (+8%) | 12mo | $186,400 | $109 | 66 |
| 7604 Easton St | 0.46mi | 4/2.5 | 1,558 (-2%) | 12mo | $210,000 | $135 | 61 |
| 5564 Trinity Ave | 0.41mi | 3/1.5 (-1) | 1,452 (-8%) | 3mo | $165,000 | $114 | 59 |
| 7611 Collins St | 0.52mi | 3/2.0 (-1) | 1,633 (+3%) | 10mo | $250,000 | $153 | 55 |
| 7650 Sharp St | 0.52mi | 3/1.5 (-1) | 1,620 (+2%) | 16mo | $159,000 | $98 | 54 |
| 7672 Sharp St | 0.48mi | 3/1.5 (-1) | 1,462 (-8%) | 12mo | $225,000 | $154 | 50 |
| 7594 E State St | 0.71mi | 3/2.0 (-1) | 1,600 (+1%) | 12mo | $225,000 | $141 | 48 |
| 5557 Woodlawn Ave | 0.40mi | 3/1.5 (-1) | 1,440 (-9%) | 17mo | $289,900 | $201 | 47 |
| 7636 E State St | 0.61mi | 4/2.0 | 1,811 (+14%) | 0mo | $275,000 | $152 | 46 |
| 5543 Trinity Ave | 0.34mi | 3/2.0 (-1) | 1,789 (+13%) | 13mo | $184,900 | $103 | 45 |
| 5483 River St | 0.62mi | 3/2.0 (-1) | 1,664 (+5%) | 18mo | $134,000 | $81 | 41 |
Match score weights: distance 35% · size 25% · config 20% · recency 20%. Top-matched comps best support the ARV.
Projected returns pro-forma
10.0% appreciation · 3.0% rent growth · sell at horizon
- IRR
- 38.0%
- Equity multiple
- 3.92×
- Total profit
- $69,610
- Equity at exit
- $76,575
- IRR
- 32.7%
- Equity multiple
- 8.85×
- Total profit
- $186,942
- Equity at exit
- $165,136
Cash invested: $23,800 (down + closing). Projections, not guarantees.
Landlord ↔ Tenant lean methodology
- Overall (STATE)
- 15 Strongly Tenant-Friendly
- State New York
- 15 Strongly Tenant-Friendly · D+10
- County
- — inherits STATE
- City
- — inherits STATE
ZIP-level market 13367
- Home prices YoY
- 20.2%
- Active inventory
- 46
- Price-to-rent
- 5.1×
Monthly cashflow live
- Estimated rent
- $1,376 medium interval (Pro) →
- Mortgage (P&I)
- −$446
- Tax from tax record
- −$242 /mo · $2,899/yr
- Insurance
- −$35
- HOA
- −$0
- Vacancy / Maint / Mgmt
- −$289
- Net cashflow
- $364
Break-even live
Sensitivity live
| Price | -10% $413 | -5% $389 | +0% $364 | +5% $340 | +10% $316 |
|---|---|---|---|---|---|
| Rent | -10% $256 | -5% $310 | +0% $364 | +5% $419 | +10% $473 |
| Rate | -1.0pp $407 | -0.5pp $386 | base $364 | +0.5pp $342 | +1.0pp $320 |
UW: 25.0% down · 7.5% · 30yr · 1.5% tax · 5.0% vac · 8.0% maint · 8.0% mgmt
Financing live
Cash to close
- Down payment
- $21,250
- Closing costs
- $2,550
- Reserves months
- —
- Total cash needed
- —
Loan-product check · same deal, 3 products live
Conventional
25% down · 7.5% · 30yr
- Down + closing
- —
- Monthly P&I
- —
- Monthly cashflow
- —
- DSCR
- —
- Eligible?
- —
Personal DTI + credit; lowest rate.
DSCR
20% down · 8.5% · 30yr
- Down + closing
- —
- Monthly P&I
- —
- Monthly cashflow
- —
- DSCR
- —
- Eligible?
- —
No personal income docs; deal must DSCR.
Hard money
10% down · 12.0% · 12mo
- Down + closing
- —
- Monthly P&I
- —
- Monthly cashflow
- —
- DSCR
- —
- Eligible?
- —
Short-term bridge; refi at stabilization.
Listing history 13 events
-
2026-06-22days on market $85,000 Active 17 DOM
-
2026-06-21days on market $85,000 Active 16 DOM
-
2026-06-19days on market $85,000 Active 14 DOM
-
2026-06-18days on market $85,000 Active 13 DOM
-
2026-06-17days on market $85,000 Active 12 DOM
-
2026-06-16days on market $85,000 Active 11 DOM
-
2026-06-15days on market $85,000 Active 10 DOM
-
2026-06-14days on market $85,000 Active 8 DOM
-
2026-06-12days on market $85,000 Active 7 DOM
-
2026-06-09days on market $85,000 Active 4 DOM
-
2026-06-08days on market $85,000 Active 3 DOM
-
2026-06-07remarks 362-char remark
-
2026-06-07$85,000 Active 2 DOM
ⓘ Source: listings_history table (triggers on properties + properties_extension) + one-shot
backfill from property_details.listing_events for pre-trigger history.
Tax reassessment forecast NY · Partial reset (capped growth)
- Current annual tax
- $2,899 · $242/mo
- Projected year-2 tax
- $2,899 · $242/mo
- Expected delta
- $0/yr ($0/mo · 0.0%)
ⓘ Screening estimate from a state-policy table — verify with the county assessor before closing.
Climate risk First Street
- Flood 1/10 Low FEMA zone X · 0% chance over 30 yrs
- Wildfire 1/10 Low
- Heat 1/10 Low 7 d/yr ≥91°F today · 17 d/yr by 30 yrs out
- Wind 1/10 Low
- Air quality 2/10 Low 0 unhealthy d/yr today · 1 by 30 yrs out
Nearby sold comps map
Loading sold comps map…
Walkable amenities ~0.75 mi
Loading nearby amenities…
Taxation est. · year 1
- Rental income
- $16,515
- − Mortgage interest
- −$4,761
- − Property taxes
- −$2,899
- − Insurance
- −$425
- − Repairs & maintenance
- −$1,321
- − Management
- −$1,321
- − Depreciation
- −$2,473
- Taxable income
- $3,314
- Est. tax owed @ 24.0%
- −$795
- After-tax cash flow
- $3,578/yr
For passive investors: Depreciation is non-cash, so a rental often shows a tax loss while cash-flowing — sheltering income. Rental losses are passive: they offset passive income freely, and up to $25,000/yr can offset ordinary (W-2) income if you actively participate and your MAGI is under $100k (phasing out to $0 by $150k); unused losses carry forward. On sale, claimed depreciation is recaptured at up to 25%, and gains may owe capital-gains tax (a 1031 exchange can defer both). Figures are a year-1 estimate at your 24.0% rate — not tax advice; consult a CPA.
Schools (NCES district)
- District
- Lowville Academy & Central School District
- NCES district ID
- 3617820
- Math proficiency
- 51% ▼ -9.00%
- Reading proficiency
- 54% ▼ -7.00%
- Median HH income
- $47,554
- Composite
- 44.62/100
- National rank
- #2773
- State rank
- #345 of 590 in NY
Livability — Lowville
- Score
- 69/100
- State rank
- #490
- US rank
- #8619
Category grades
Schools grade is shown separately in the Schools card above.
Census & demographics
- Census place
- Lowville, NY
- Population (ZIP)
- 8,786
Population outlook (Lewis County) Hauer SSP2
- Today (2025)
- 26,126 people
- By 2030
- 25,354 · -3.0%
- By 2040
- 23,359 · -10.6%
- By 2050
- 20,927 · -19.9%
- By 2075
- 15,533 · -40.5%
- By 2100
- 10,215 · -60.9%
Race, ethnicity, and origin ACS 2023
- Neighborhood character
- Predominantly White (91%)
- Race & ethnicity
- White 91% Two or more races 5% Hispanic / Latino 4% Black 1%
- Common ancestry
- Lithuanian 9% Romanian 5% Iranian 2%
- Foreign-born
- 2% · Canada
- Languages at home
- 96% English-only · Spanish 3%
Political lean MEDSL · Lewis
- 2024 margin
- Solid R (+44.4) · D 27.8% · R 72.2%
- 2008→2024 swing
- -35.6pp toward R · 2008: -8.8pp · 2024: -44.4pp
- All cycles
- 2024: R+44.4 2020: R+39.2 2016: R+39.6 2012: R+8.7 2008: R+8.8
Not yet ingested
- Civics
- —
Market trends
- HPI YoY
- ▲ 49.81%
- Current HPI
- 296.4815
- Rent YoY
- —
- Metro
- —
- State GDP YoY
- ▲ 2.60%
- F500 in state
- 92
Industry mix (Fortune 500 HQ in NY)
| Industry | F500 HQs | Revenue |
|---|---|---|
| Financial Services | 10 | $950B |
|
||
| Consumer Goods | 9 | $162B |
|
||
| Insurance | 4 | $225B |
|
||
| Telecommunications | 2 | $144B |
|
||
| Pharmaceuticals | 2 | $112B |
|
||
| Media / Entertainment | 2 | $69B |
|
||
Price history
1 event — show timeline
- 2026-06-05 Listed $85,000 CNYIS
Property tax history
+12.4%/yrLatest (2025): $2,899 · +3.0% YoY. Source: county tax records.
Cash-flow waterfall
monthlySold comps — $/sqft
last 12 mo · ≤1 miLoading sold comps…