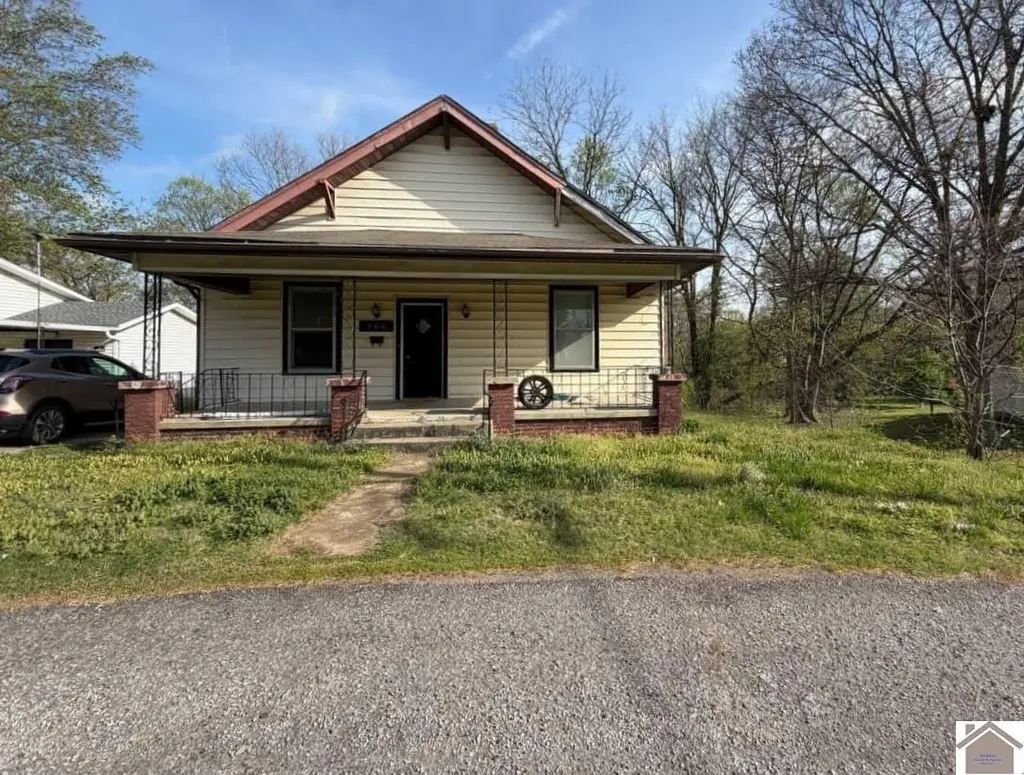
300 5th St · Fulton, KY
Flood risk 1/10 · Minimal
- FEMA flood zone
- X (unshaded)
- Chance of flooding over 30 yrs
- 0.0%
- Est. flood insurance / yr
- $507 – $1,088
Fire risk 3/10 · Minor
- Est. fire insurance / yr
- $839 – $1,559
Heat risk 6/10 · Moderate
- Hot days now (above 107°F)
- 7 days/yr
- Hot days in 30 yrs
- 21 days/yr
Wind risk 4/10 · Minor
- Chance of severe wind over 30 yrs
- 8.0%
Air-quality risk 1/10 · Minimal
- Unhealthy air days now
- 0 days/yr
- Unhealthy air days in 30 yrs
- 0 days/yr
Risk factors via First Street. Map © Google.
Why this score? — see what drove the B grade
The composite is a weighted blend of 9 inputs, each scored 0–100. Each bar is that input's sub-score; the figure is the points it added to the 100-point composite (weight × sub-score).
- Cash flow +30.0/30.0
- 1% rule +10.0/10.0
- DSCR +10.0/10.0
- ARV discount +7.5/15.0
- Appreciation +5.1/10.0
- Livability +3.4/5.0
- Schools +2.7/10.0
- Rent growth +2.5/5.0
- Condition / age +2.2/5.0
$44,500
🖨 Deal sheet (PDF) 📄 Offer letter ✓ Due diligence
Listing remarks
This 3 bedroom, 1 bath house in Fulton is full of potential! Some repairs are needed, and this is a perfect opportunity for an investment purchase. Selling "As Is".
Key facts
- 9,148 sq ft lot
- Listed 33 days
Property features AI
Exterior
- Utilities: Public water; Natural gas available
- Home design: Single-family residence; Residential property
- Exterior features: Rolling slope lot
Interior
- Bathrooms: 1 full bathroom
- Heating & cooling: Central air conditioning; Natural gas heating
- Interior features: Unfinished basement
Neighborhood map
What this means for you Summary
Snapshot
- This is a 3-bed/1.0-bath single-family listed at $44k. Condition is rated fair.
Deal economics
- At list price, monthly cash flow is $646 ($8k/yr) — positive.
- The deal already cash-flows at list — no discount required.
- Meets the 1% rule at list price ($1k rent vs $44k).
- Recommended offer: $43k (3.0% below list) — sets the bar for market timing.
- Cap rate 23.7% vs local median 5.3% in Fulton — top-decile yield for the area; either an underpriced asset or a hidden risk that comps aren't pricing in. Stress-test before assuming the spread holds.
Location & tenants
- Location reads 68/100 on livability (#204 in KY) — a middle-class / working-renter tenant base. Strengths: cost of living A+, health & safety A+; Watch: housing D+, amenities D, schools F.
- Fulton Independent (town): math 25% / reading 35% proficiency, ranked #170 of 173 in KY (top 98%) — families likely to look elsewhere, expect single-tenant / working-renter base with shorter leases; 73% free/reduced lunch — lower-income household profile, screen leases tightly.
- Market conditions: 45 active listings in the ZIP.
Forward outlook
- In year one you build about $387 of equity ($308 loan paydown + $79 appreciation (0.2% local appreciation)).
- Fulton County population projected at -24% by 2050 — secular population decline; favor cash flow + early exit over multi-decade hold.
- At projected returns (0.2% appreciation + 3.0% rent growth), your $12k cash investment doubles in ~2 years — after that, you're playing with house money.
Negotiation context
- It's been on market 33 days — a 3% lower offer ($43k) is reasonable based on typical stale-listing flexibility.
Risks & watch-outs
- Climate carrying-cost: extreme-heat days projected 7→21/yr by 2055 (HVAC capex compounding) — expect insurance premiums to compound above CPI over the hold.
Questions for the listing agent
- It's been on market 33 days. Have you received any prior offers? Is the seller open to a 3% concession, seller financing, or rate buy-down credit?
- Have any recent inspections been done? Can we get a copy of the seller's disclosures and any deferred-maintenance estimates?
- Is there a deadline driving the sale (1031 exchange, divorce, estate, relocation)? That informs how much negotiation room exists.
- Schools are F-rated, which usually means shorter tenancies and higher turnover. Who's the typical renter profile here, and what's been the actual vacancy rate?
- What's the average days-on-market for RENTAL listings here right now (not sales)? A rising rental-DOM trend means longer vacancies and softer asking-rent achievability than the comps imply.
- What's the recent tenant-quality profile in this submarket — average credit score on applications, eviction rate, late-payment / NSF rate, and stable-employment percentage? A property-management company in the area should have these aggregated.
- How much new for-sale + rental construction is in the pipeline within 1–3 miles? Heavy new supply typically softens prices + rents 12–24 months out; constrained supply supports both.
Investment metrics
- 1% rule
- 2.71% ✓
- Cap rate
- 23.72%
- Cash-on-cash
- 62.25%
- DSCR
- 3.77
- GRM
- 3.1
CMA / ARV
- ARV (on-the-fly)
- $97,600
- Comps found
- 9
Show comp detail 9 sales within ~0.75 mi
| Address | Dist | Beds/Ba | Sqft | Sold | Price | $/sf | Match |
|---|---|---|---|---|---|---|---|
| 304 Eddings St | 0.27mi | 3/2.0 | 1,560 (-2%) | 7mo | $139,000 | $89 | 74 |
| 104 Park Ave | 0.37mi | 3/2.0 | 1,456 (-9%) | 6mo | $184,000 | $126 | 58 |
| 206 Pearl St | 0.33mi | 3/2.0 | 1,818 (+14%) | 9mo | $139,500 | $77 | 51 |
| 611 Green St | 0.41mi | 4/2.0 (+1) | 1,750 (+9%) | 9mo | $37,000 | $21 | 49 |
| 656 US Highway 45 | 0.37mi | 3/1.5 | 1,457 (-9%) | 21mo | $88,500 | $61 | 49 |
| 507 W State Line Rd | 0.50mi | 3/1.0 | 1,404 (-12%) | 15mo | $39,900 | $28 | 44 |
| 118 West St | 0.42mi | 4/2.0 (+1) | 1,770 (+11%) | 12mo | $125,000 | $71 | 43 |
| 636 US Hwy. 45 | 0.37mi | 3/2.5 | 1,447 (-10%) | 23mo | $70,595 | $49 | 42 |
| 703 Tennessee St | 0.73mi | 2/1.5 (-1) | 1,459 (-9%) | 15mo | $25,000 | $17 | 32 |
Match score weights: distance 35% · size 25% · config 20% · recency 20%. Top-matched comps best support the ARV.
Projected returns pro-forma
0.18% appreciation · 3.0% rent growth · sell at horizon
- IRR
- 64.3%
- Equity multiple
- 4.23×
- Total profit
- $40,256
- Equity at exit
- $13,316
- IRR
- 66.2%
- Equity multiple
- 8.58×
- Total profit
- $94,398
- Equity at exit
- $16,326
Cash invested: $12,460 (down + closing). Projections, not guarantees.
Landlord ↔ Tenant lean methodology
- Overall (STATE)
- 83 Strongly Landlord-Friendly
- State Kentucky
- 83 Strongly Landlord-Friendly · R+16
- County
- — inherits STATE
- City
- — inherits STATE
ZIP-level market 42041
- Home prices YoY
- 0.1%
- Active inventory
- 45
- Price-to-rent
- 3.1×
Monthly cashflow live
- Estimated rent
- $1,207 medium interval (Pro) →
- Mortgage (P&I)
- −$233
- Tax est. 1.5%
- −$56 /mo · $668/yr
- Insurance
- −$19
- HOA
- −$0
- Vacancy / Maint / Mgmt
- −$254
- Net cashflow
- $646
Break-even live
Sensitivity live
| Price | -10% $677 | -5% $662 | +0% $646 | +5% $631 | +10% $616 |
|---|---|---|---|---|---|
| Rent | -10% $551 | -5% $599 | +0% $646 | +5% $694 | +10% $742 |
| Rate | -1.0pp $669 | -0.5pp $658 | base $646 | +0.5pp $635 | +1.0pp $623 |
UW: 25.0% down · 7.5% · 30yr · 1.5% tax · 5.0% vac · 8.0% maint · 8.0% mgmt
Financing live
Cash to close
- Down payment
- $11,125
- Closing costs
- $1,335
- Reserves months
- —
- Total cash needed
- —
Loan-product check · same deal, 3 products live
Conventional
25% down · 7.5% · 30yr
- Down + closing
- —
- Monthly P&I
- —
- Monthly cashflow
- —
- DSCR
- —
- Eligible?
- —
Personal DTI + credit; lowest rate.
DSCR
20% down · 8.5% · 30yr
- Down + closing
- —
- Monthly P&I
- —
- Monthly cashflow
- —
- DSCR
- —
- Eligible?
- —
No personal income docs; deal must DSCR.
Hard money
10% down · 12.0% · 12mo
- Down + closing
- —
- Monthly P&I
- —
- Monthly cashflow
- —
- DSCR
- —
- Eligible?
- —
Short-term bridge; refi at stabilization.
Listing history 17 events
-
2026-06-21days on market $44,500 Active 33 DOM
-
2026-06-18days on market $44,500 Active 31 DOM
-
2026-06-17days on market $44,500 Active 30 DOM
-
2026-06-16days on market $44,500 Active 29 DOM
-
2026-06-15days on market $44,500 Active 28 DOM
-
2026-06-13days on market $44,500 Active 26 DOM
-
2026-06-12days on market $44,500 Active 25 DOM
-
2026-06-09days on market $44,500 Active 22 DOM
-
2026-06-08days on market $44,500 Active 21 DOM
-
2026-06-07pricedays on market $44,500 Active 20 DOM
-
2026-06-05days on market $45,000 Active 18 DOM
-
2026-06-04days on market $45,000 Active 16 DOM
-
2026-06-02days on market $45,000 Active 15 DOM
-
2026-06-01days on market $45,000 Active 14 DOM
-
2026-05-31days on market $45,000 Active 13 DOM
-
2026-05-31days on market $45,000 Active 12 DOM
-
2026-05-18$45,000 Active
ⓘ Source: listings_history table (triggers on properties + properties_extension) + one-shot
backfill from property_details.listing_events for pre-trigger history.
Climate risk First Street
- Flood 1/10 Low FEMA zone X (unshaded) · 0% chance over 30 yrs
- Wildfire 3/10 Moderate
- Heat 6/10 Major 7 d/yr ≥107°F today · 21 d/yr by 30 yrs out
- Wind 4/10 Moderate 8% chance of damaging wind over 30 yrs
- Air quality 1/10 Low 0 unhealthy d/yr today · 0 by 30 yrs out
Nearby sold comps map
Loading sold comps map…
Walkable amenities ~0.75 mi
Loading nearby amenities…
Taxation est. · year 1
- Rental income
- $14,490
- − Mortgage interest
- −$2,493
- − Property taxes
- −$668
- − Insurance
- −$222
- − Repairs & maintenance
- −$1,159
- − Management
- −$1,159
- − Depreciation
- −$1,295
- Taxable income
- $7,494
- Est. tax owed @ 24.0%
- −$1,799
- After-tax cash flow
- $5,958/yr
For passive investors: Depreciation is non-cash, so a rental often shows a tax loss while cash-flowing — sheltering income. Rental losses are passive: they offset passive income freely, and up to $25,000/yr can offset ordinary (W-2) income if you actively participate and your MAGI is under $100k (phasing out to $0 by $150k); unused losses carry forward. On sale, claimed depreciation is recaptured at up to 25%, and gains may owe capital-gains tax (a 1031 exchange can defer both). Figures are a year-1 estimate at your 24.0% rate — not tax advice; consult a CPA.
Condition & rehab AI · 13 photos
This 3-bedroom, 1-bath house in Fulton has potential for a moderate renovation. It requires exterior painting, kitchen appliance replacement, and bathroom cleaning to improve its condition and value.
Repairs flagged
- Major Kitchen appliances — Old and worn
- Minor Bathroom cleaning — Cluttered and in need of cleaning
- Moderate Exterior painting — Siding appears weathered
Value-add opportunities
- Both Paint exterior and interior — Fresh paint enhances curb appeal and interior aesthetics
- Both Replace kitchen appliances — Modern appliances improve functionality and appeal
- Both Clean and organize bathroom — A clean and organized bathroom enhances the home's appeal
Renovation cost estimate screening
| Repair item | Severity | Est. cost |
|---|---|---|
| Kitchen appliances · Old and worn | Major | $15,000–50,000 |
| Bathroom cleaning · Cluttered and in need of cleaning | Minor | $500–3,000 |
| Exterior painting · Siding appears weathered | Moderate | $3,000–15,000 |
| Total estimated repair cost · 3 items | $18,500–68,000 |
Value-add ROI direction
- Both Paint exterior and interior — Fresh paint enhances curb appeal and interior aesthetics ↑
- Both Replace kitchen appliances — Modern appliances improve functionality and appeal ↑
- Both Clean and organize bathroom — A clean and organized bathroom enhances the home's appeal ↑
ⓘ Cost ranges are severity-bucket heuristics (US national rule-of-thumb). Get contractor quotes + a written scope before underwriting a rehab budget.
Schools (NCES district)
- District
- Fulton Independent
- NCES district ID
- 2102070
- Math proficiency
- 25% ▬ 0.00%
- Reading proficiency
- 35% ▬ 0.00%
- Median HH income
- $29,755
- Composite
- 27.09/100
- National rank
- #12479
- State rank
- #170 of 173 in KY
Livability — Fulton
- Score
- 68/100
- State rank
- #204
- US rank
- #10052
Category grades
Schools grade is shown separately in the Schools card above.
Census & demographics
- Census place
- Fulton, KY
- Population (ZIP)
- 4,584
Population outlook (Fulton County) Hauer SSP2
- Today (2025)
- 5,425 people
- By 2030
- 5,042 · -7.1%
- By 2040
- 4,456 · -17.9%
- By 2050
- 4,120 · -24.1%
- By 2075
- 4,003 · -26.2%
- By 2100
- 4,258 · -21.5%
Race, ethnicity, and origin ACS 2023
- Neighborhood character
- Predominantly White (71%)
- Race & ethnicity
- White 71% Black 18% Two or more races 8% Hispanic / Latino 3% Pacific Islander 1%
- Common ancestry
- Portuguese 2% Serbian 2% Scandinavian 2%
- Foreign-born
- 1%
- Languages at home
- 97% English-only · Spanish 2% Other Indo-European 1%
Political lean MEDSL · Fulton
- 2024 margin
- Solid R (+39.9) · D 29.6% · R 69.5%
- 2008→2024 swing
- -29.5pp toward R · 2008: -10.3pp · 2024: -39.9pp
- All cycles
- 2024: R+39.9 2020: R+33.5 2016: R+32.5 2012: R+16.2 2008: R+10.3
Not yet ingested
- Civics
- —
Market trends
- HPI YoY
- ▲ 0.18%
- Current HPI
- 174.9435
- Rent YoY
- —
- Metro
- —
- State GDP YoY
- ▲ 1.81%
- F500 in state
- 4
Industry mix (Fortune 500 HQ in KY)
| Industry | F500 HQs | Revenue |
|---|---|---|
| Healthcare | 1 | $118B |
|
||
| Food / Beverage | 1 | $7B |
|
||
Price history
1 event — show timeline
- 2026-05-18 Listed $45,000 WKRMLS
Cash-flow waterfall
monthlySold comps — $/sqft
last 12 mo · ≤1 miLoading sold comps…