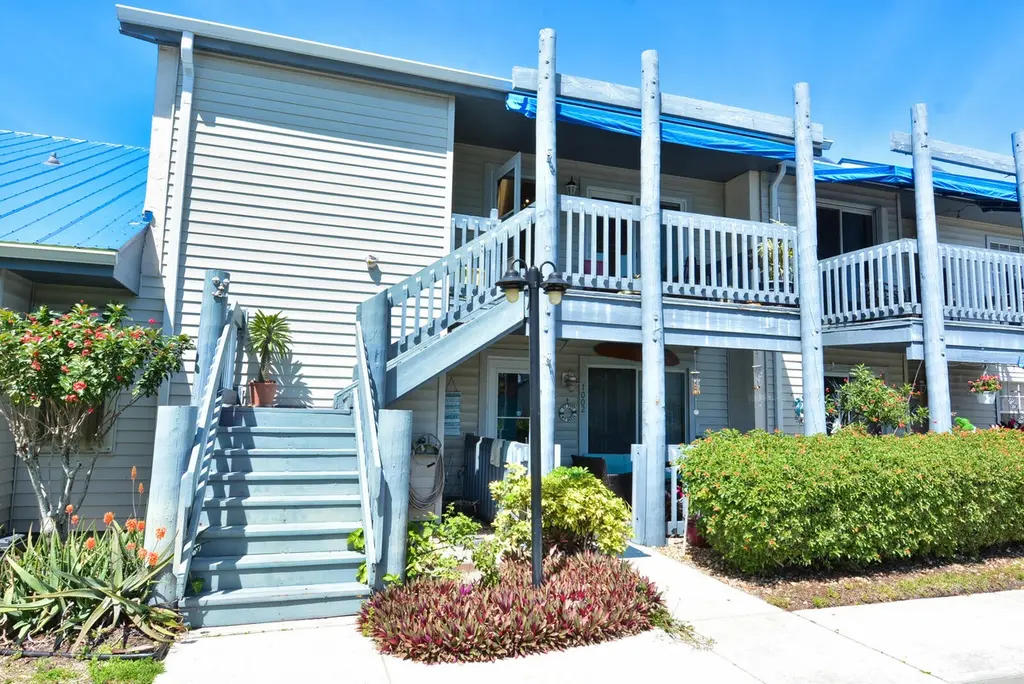
1555 NE Beacon Dr Apt 1006 · Jensen Beach, FL
Flood risk 4/10 · Minor
- FEMA flood zone
- X (unshaded)
- Chance of flooding over 30 yrs
- 0.22%
- Est. flood insurance / yr
- $507 – $1,088
Fire risk 1/10 · Minimal
- Est. fire insurance / yr
- $947 – $1,759
Heat risk 10/10 · Severe
- Hot days now (above 106°F)
- 7 days/yr
- Hot days in 30 yrs
- 24 days/yr
Wind risk 10/10 · Severe
- Chance of severe wind over 30 yrs
- 99.0%
Air-quality risk 2/10 · Minimal
- Unhealthy air days now
- 2 days/yr
- Unhealthy air days in 30 yrs
- 2 days/yr
Risk factors via First Street. Map © Google.
Why this score? — see what drove the D- grade
The composite is a weighted blend of 9 inputs, each scored 0–100. Each bar is that input's sub-score; the figure is the points it added to the 100-point composite (weight × sub-score).
- ARV discount +12.1/15.0
- Cash flow +6.9/30.0
- 1% rule +5.9/10.0
- Schools +4.5/10.0
- Livability +3.5/5.0
- Rent growth +2.8/5.0
- Condition / age +2.5/5.0
- DSCR +1.2/10.0
- Appreciation +0.0/10.0
$199,900
🖨 Deal sheet 📄 Offer letter ✓ Due diligence
Listing remarks MLS
DON'T WALK RUN!CORNER UNIT UPDATED AND FURNISHED! 2Bed/2Baths Split Plan with High Ceilings! White Kitchen update in 2019 with Granite and Stainless Appliances, Updated master Bath 2019 ,AC and HWH, Impact Glass Sliding Doors and Windows in 2020! Stove, Refrigerator 2023 and Washer 2026!2nd Bedroom Has Murphy Bed and Computer Desk Area! front and Back Porches! Covered Parking! All ages, 2 pets allowed, trucks allowed! Community offers 2 Pools, Tennis, Pickle Ball, Shuffleboard, Community Room with Kitchen and Billiard Tables, Meeting Room, Gazebo, Boating and RV Storage Available! EZ To SHOW &SELL!
Key facts
- $640 HOA
- Parking
- Community pool
Neighborhood map
What this means for you Summary
Snapshot
- This is a 2-bed/2.0-bath condo listed at $200k.
Deal economics
- At list price, monthly cash flow is $-298 ($-4k/yr) — negative.
- To cash-flow at today's rent, offer at most $147k (26.3% below list).
- Meets the 1% rule at list price ($2k rent vs $200k).
- Recommended offer: $147k (26.3% below list) — sets the bar for cash-flow.
Location & tenants
- Location reads 70/100 on livability (#432 in FL) — a middle-class / working-renter tenant base. Strengths: crime A+, housing A+, cost of living B+; Watch: amenities F, commute F, health & safety D-.
- Martin (suburban): math 52% / reading 53% proficiency, ranked #24 of 73 in FL (top 33%) — acceptable for families but not a draw, mixed tenant base, ~2y average lease.
- Market conditions: Rents rising (+1.0%/yr); 536 active listings in the ZIP; 23 comparable units currently listed for rent nearby; rentals at typical pace (median 24d on market — plan ~3-4 weeks tenant-placement turnaround); 737 units permitted in Martin County in 2024 (167 in 5+ unit buildings).
- This rent runs 37% of the median local income ($70k/yr) — at the standard rent-burdened threshold; future hikes will face affordability resistance.
Forward outlook
- Local home prices are declining (-3.0%/yr); year-one equity from $1k of loan paydown is wiped out by about $6k of value loss. Plan a longer hold.
- Martin County population projected at +19% by 2050 — long-run rental-demand tailwind backs the buy-and-hold thesis.
Negotiation context
- It's been on market 56 days — a 3% lower offer ($194k) is reasonable based on typical stale-listing flexibility.
- 11 sale attempts since 25y ago with the ask held roughly flat each time — persistent listings suggest the price (not the market) is what's stuck; bring a comps-based counter.
- Current owner paid $100k; list at $200k implies a 100% gain — meaningful room to come down on a strong offer.
Risks & watch-outs
- Watch-outs: HOA is 29% of rent.
- Climate carrying-cost: severe wind risk, 99% chance of damaging wind over 30y; extreme-heat days projected 7→24/yr by 2055 (HVAC capex compounding) — expect insurance premiums to compound above CPI over the hold.
Questions for the listing agent
- What do current leases actually rent for vs. the listed asking? Can we see a recent rent roll and the last 12 months of T-12 income?
- It's been on market 56 days. Have you received any prior offers? Is the seller open to a 26% concession, seller financing, or rate buy-down credit?
- What does the HOA fee cover, when was the last increase, and are there any pending special assessments or reserve-fund shortfalls?
- Any open or pending special assessments — roof, HVAC, plumbing, elevator, façade? What's the per-unit balance and payoff schedule, and is the seller paying it off at close or rolling it to the buyer?
- Is there a deadline driving the sale (1031 exchange, divorce, estate, relocation)? That informs how much negotiation room exists.
- Schools are B-rated — typically a magnet for longer-tenancy family renters. What's the average tenant stay here, and is there a school-zone premium baked into asking?
- The area grade is low — what's the realistic commute time and amenity access for the typical tenant pool here? Any planned neighborhood developments (good or bad) we should know about?
- What's the average days-on-market for RENTAL listings here right now (not sales)? A rising rental-DOM trend means longer vacancies and softer asking-rent achievability than the comps imply.
- What's the recent tenant-quality profile in this submarket — average credit score on applications, eviction rate, late-payment / NSF rate, and stable-employment percentage? A property-management company in the area should have these aggregated.
- How much new apartment / multifamily construction is in the pipeline within 1–3 miles? Heavy new supply (>2% of stock underway) typically softens rents 12–24 months out; light construction supports rent growth.
Investment metrics
- 1% rule
- 1.09% ✓
- Cap rate
- 4.51%
- Cash-on-cash
- -6.38%
- DSCR
- 0.72
- GRM
- 7.7
CMA / ARV
- ARV (median comp)
- $222,555
- List price
- $199,900
- Delta
- -10.18%
- Verdict
- UNDERPRICED
- Comps
- 20 within 1.0 mi
Projected returns pro-forma
-3.0% appreciation · 1.0% rent growth · sell at horizon
- IRR
- -30.6%
- Equity multiple
- 0.01×
- Total profit
- $-55,219
- Equity at exit
- $29,806
- IRR
- -52.5%
- Equity multiple
- -0.57×
- Total profit
- $-87,700
- Equity at exit
- $17,284
Cash invested: $55,972 (down + closing). Projections, not guarantees.
Landlord ↔ Tenant lean methodology
- Overall (STATE)
- 87 Strongly Landlord-Friendly
- State Florida
- 87 Strongly Landlord-Friendly · R+3
- County
- — inherits STATE
- City
- — inherits STATE
ZIP-level market 34957
- Rents YoY
- 1.0%
- Active inventory
- 536
- Price-to-rent
- 7.7×
Monthly cashflow live
- Estimated rent
- $2,177 high interval (Pro) →
- Mortgage (P&I)
- −$1,048
- Tax from tax record
- −$245 /mo · $2,946/yr
- Insurance
- −$83
- HOA
- −$640
- Vacancy / Maint / Mgmt
- −$457
- Net cashflow
- $-298
Break-even live
UW: 25.0% down · 7.5% · 30yr · 1.5% tax · 5.0% vac · 8.0% maint · 8.0% mgmt
Financing live
Cash to close
- Down payment
- $49,975
- Closing costs
- $5,997
- Reserves months
- —
- Total cash needed
- —
Loan-product check · same deal, 3 products live
Conventional
25% down · 7.5% · 30yr
- Down + closing
- —
- Monthly P&I
- —
- Monthly cashflow
- —
- DSCR
- —
- Eligible?
- —
Personal DTI + credit; lowest rate.
DSCR
20% down · 8.5% · 30yr
- Down + closing
- —
- Monthly P&I
- —
- Monthly cashflow
- —
- DSCR
- —
- Eligible?
- —
No personal income docs; deal must DSCR.
Hard money
10% down · 12.0% · 12mo
- Down + closing
- —
- Monthly P&I
- —
- Monthly cashflow
- —
- DSCR
- —
- Eligible?
- —
Short-term bridge; refi at stabilization.
Rent comps 23 comps
| Address | Beds | Baths | Sqft | Rent | $/sqft | DOM | Units | Dist |
|---|---|---|---|---|---|---|---|---|
| 1617 NE Nautical Pl Jensen Beach, FL | 2.0 | 2.0 | 961 | $1,850 | $1.93 | 14d | 1 | 0.03mi |
| 1585 NE Beacon Dr #1103 Jensen Beach, FL | 2.0 | 2.0 | 961 | $1,495 | $1.56 | 23d | 1 | 0.05mi |
| 1411 NE 14th Ct #13 Jensen Beach, FL | 2.0 | 2.0 | 1100 | $3,000 | $2.73 | 23d | 1 | 0.10mi |
| 1622 NE Maureen Ct Jensen Beach, FL | 2.0 | 1.0 | 780 | $1,800 | $2.31 | 14d | 1 | 0.13mi |
| 1600 NE Dixie Hwy Unit 10-203 Jensen Beach, FL | 2.0 | 2.0 | 1072 | $2,300 | $2.15 | 23d | 1 | 0.29mi |
| 1971 NE Collins Cir #20 Jensen Beach, FL | 2.0 | 2.0 | 1037 | $1,750 | $1.69 | 23d | 1 | 0.50mi |
| 2013 NE Collins Cir #50 Jensen Beach, FL | 2.0 | 2.0 | 903 | $1,800 | $1.99 | 14d | 1 | 0.50mi |
| 1999 NE Collins Cir Unit 3-80 Jensen Beach, FL | 2.0 | 2.0 | 1067 | $1,775 | $1.66 | 23d | 1 | 0.51mi |
| 1097 NE Kubin Ave Jensen Beach, FL | 2.0 | 1.5 | 952 | $2,450 | $2.57 | 23d | 1 | 0.71mi |
| 1001 NE Baker Rd Stuart, FL | 1.0–3.0 | 1.0–2.0 | 952 | $2,280 | $2.40 | 14d | 27 | 0.85mi |
| 2563 NE Palm Ave Jensen Beach, FL | 2.0 | 2.0 | 950 | $2,400 | $2.53 | 23d | 1 | 0.99mi |
| 2459 NE Hickory Ave Jensen Beach, FL | 1.0 | 1.0 | 736 | $1,700 | $2.31 | 23d | 1 | 0.99mi |
| 2506 NE Heron's Walk Jensen Beach, FL | 2.0 | 1.0 | 1000 | $2,400 | $2.40 | 23d | 1 | 1.08mi |
| 2646 NE Pelican Way Jensen Beach, FL | 1.0 | 1.0 | 1000 | $2,400 | $2.40 | 23d | 1 | 1.12mi |
| 2680 NE Indian River Dr Unit 9 Jensen Beach, FL | 2.0 | 1.0 | 800 | $2,100 | $2.62 | 14d | 1 | 1.12mi |
| 2632 NE Pelican Way Jensen Beach, FL | 2.0 | 1.0 | 1000 | $4,800 | $4.80 | 23d | 1 | 1.12mi |
| 2952 NE Savannah Rd Jensen Beach, FL | 3.0 | 2.0 | 1056 | $3,000 | $2.84 | 23d | 1 | 1.19mi |
| 25 NE 17th St Stuart, FL | 3.0 | 2.0 | 990 | $2,000 | $2.02 | 23d | 1 | 1.27mi |
| 3111 NE Savannah Rd Jensen Beach, FL | 2.0 | 1.0 | 1085 | $1,995 | $1.84 | 14d | 1 | 1.29mi |
| 3121 NE Savannah Rd Unit 3121 Jensen Beach, FL | 3.0 | 1.0 | 1085 | $2,095 | $1.93 | 23d | 1 | 1.31mi |
| 297 NE Coastal DR #297 Jensen Beach, FL | 2.0 | 2.0 | 1000 | $3,000 | $3.00 | 23d | 1 | 1.31mi |
| 3123 NE Savannah Rd Unit 3123 Jensen Beach, FL | 3.0 | 2.0 | 1100 | $2,195 | $2.00 | 23d | 1 | 1.31mi |
| 1398 NW Cavendish Ct Stuart, FL | 2.0–3.0 | 2.5 | 1242 | $2,393 | $1.93 | 21d | 11 | 1.38mi |
HOA detail condo
- Monthly dues
- $640 · $7,680/yr
- Likely covers
- pool
- Assessments
- None detected in remarks — confirm with the listing agent.
Listing history 36 events
-
2026-06-03status $199,900 Pending 56 DOM
-
2026-06-02days on market $199,900 Active Under Contract 56 DOM
-
2026-06-01days on market $199,900 Active Under Contract 55 DOM
-
2026-05-31days on market $199,900 Active Under Contract 54 DOM
-
2026-05-31days on market $199,900 Active Under Contract 53 DOM
-
2026-05-16historical Active Under Contract 609-char remark
Show marketing remark (609 chars)
DON'T WALK RUN!CORNER UNIT UPDATED AND FURNISHED! 2Bed/2Baths Split Plan with High Ceilings! White Kitchen update in 2019 with Granite and Stainless Appliances, Updated master Bath 2019 ,AC and HWH, Impact Glass Sliding Doors and Windows in 2020! Stove, Refrigerator 2023 and Washer 2026!2nd Bedroom Has Murphy Bed and Computer Desk Area! front and Back Porches! Covered Parking! All ages, 2 pets allowed, trucks allowed! Community offers 2 Pools, Tennis, Pickle Ball, Shuffleboard, Community Room with Kitchen and Billiard Tables, Meeting Room, Gazebo, Boating and RV Storage Available! EZ To SHOW &SELL!
-
2026-04-06$199,900 Active 609-char remark
Show marketing remark (609 chars)
DON'T WALK RUN!CORNER UNIT UPDATED AND FURNISHED! 2Bed/2Baths Split Plan with High Ceilings! White Kitchen update in 2019 with Granite and Stainless Appliances, Updated master Bath 2019 ,AC and HWH, Impact Glass Sliding Doors and Windows in 2020! Stove, Refrigerator 2023 and Washer 2026!2nd Bedroom Has Murphy Bed and Computer Desk Area! front and Back Porches! Covered Parking! All ages, 2 pets allowed, trucks allowed! Community offers 2 Pools, Tennis, Pickle Ball, Shuffleboard, Community Room with Kitchen and Billiard Tables, Meeting Room, Gazebo, Boating and RV Storage Available! EZ To SHOW &SELL!
-
2026-04-03historical
-
2026-01-30price $210,000
-
2026-01-07price $235,000
-
2025-04-13$265,000 Active
-
2016-06-26historical
-
2016-04-28price $100,000
-
2015-06-15soldstatus $100,000
-
2015-06-12soldstatus $100,000
-
2015-06-12price $109,999
-
2014-10-29$109,999
-
2014-10-20historical
-
2014-10-20historical
-
2014-06-20$114,999
-
2014-06-20$114,999
-
2011-08-25soldstatus $59,500
-
2011-05-04historical
-
2011-03-21$59,500
-
2005-11-11historical
-
2005-10-16$191,000
-
2005-10-16$191,000
-
2005-08-10soldstatus $175,000
-
2005-07-22price $189,900
-
2005-07-22soldstatus $175,000
-
2005-06-22historical
-
2005-05-02$175,000
-
2005-05-02$189,900
-
2001-08-14soldstatus $75,900
-
2001-08-10soldstatus $75,900
-
2001-06-25$75,900
ⓘ Source: listings_history table (triggers on properties + properties_extension) + one-shot
backfill from property_details.listing_events for pre-trigger history.
Tax reassessment forecast FL · Resets to sale price
- Current annual tax
- $2,946 · $245/mo
- Projected year-2 tax
- $2,946 · $245/mo
- Expected delta
- $0/yr ($0/mo · 0.0%)
ⓘ Screening estimate from a state-policy table — verify with the county assessor before closing.
Climate risk First Street
- Flood 4/10 Moderate FEMA zone X (unshaded) · 22% chance over 30 yrs
- Wildfire 1/10 Low
- Heat 10/10 Extreme 7 d/yr ≥106°F today · 24 d/yr by 30 yrs out
- Wind 10/10 Extreme 99% chance of damaging wind over 30 yrs
- Air quality 2/10 Low 2 unhealthy d/yr today · 2 by 30 yrs out
Nearby sold comps map
Loading sold comps map…
Walkable amenities ~0.75 mi
Loading nearby amenities…
Taxation est. · year 1
- Rental income
- $26,118
- − Mortgage interest
- −$11,198
- − Property taxes
- −$2,946
- − Insurance
- −$1,000
- − Repairs & maintenance
- −$2,089
- − Management
- −$2,089
- − HOA
- −$7,680
- − Depreciation
- −$5,815
- Taxable loss
- −$6,699
- Est. tax savings @ 24.0%
- +$1,608
- After-tax cash flow
- $-1,964/yr
For passive investors: Depreciation is non-cash, so a rental often shows a tax loss while cash-flowing — sheltering income. Rental losses are passive: they offset passive income freely, and up to $25,000/yr can offset ordinary (W-2) income if you actively participate and your MAGI is under $100k (phasing out to $0 by $150k); unused losses carry forward. On sale, claimed depreciation is recaptured at up to 25%, and gains may owe capital-gains tax (a 1031 exchange can defer both). Figures are a year-1 estimate at your 24.0% rate — not tax advice; consult a CPA.
Schools (NCES district)
- District
- Martin
- NCES district ID
- 1201290
- Math proficiency
- 52% ▼ -14.00%
- Reading proficiency
- 53% ▼ -4.00%
- Median HH income
- $52,482
- Composite
- 45.1/100
- National rank
- #2690
- State rank
- #24 of 73 in FL
Livability — Jensen Beach
- Score
- 70/100
- State rank
- #432
- US rank
- #7719
Category grades
Schools grade is shown separately in the Schools card above.
Census & demographics
- Census place
- Jensen Beach, FL
- County
- Martin County · 165,223 people
- City population
- 23,462
- Metro
- Port St. Lucie, FL
- Population (ZIP)
- 23,462
- Household income
- $70,403
- Rent vs Own
- Severe rent burden
- 946.0
Population outlook (Martin County) Hauer SSP2
- Today (2025)
- 172,383 people
- By 2030
- 180,192 · +4.5%
- By 2040
- 194,114 · +12.6%
- By 2050
- 204,992 · +18.9%
- By 2075
- 229,641 · +33.2%
- By 2100
- 232,146 · +34.7%
Race, ethnicity, and origin ACS 2023
- Neighborhood character
- Predominantly White (85%)
- Race & ethnicity
- White 85% Hispanic / Latino 7% Two or more races 6% Asian 2% Black 2%
- Hispanic origin (detail)
- Mexican 1% Puerto Rican 2% Cuban 1%
- Common ancestry
- Romanian 4% Slovak 3% Lithuanian 3%
- Foreign-born
- 10% · Canada, Jamaica
- Languages at home
- 90% English-only · Spanish 5% Other Indo-European 2% Tagalog/Filipino 1%
Political lean MEDSL · Martin
- 2024 margin
- Solid R (+31.1) · D 34.1% · R 65.2%
- 2008→2024 swing
- -17.5pp toward R · 2008: -13.6pp · 2024: -31.1pp
- All cycles
- 2024: R+31.1 2020: R+24.6 2016: R+26.9 2012: R+22.9 2008: R+13.6
Not yet ingested
- Civics
- —
Market trends
- HPI YoY
- ▼ -319.66%
- Current HPI
- 340.0172
- Rent YoY
- ▲ 1.00%
- Metro
- Port St. Lucie, FL
- State GDP YoY
- ▲ 3.28%
- F500 in state
- 36
Industry mix (Fortune 500 HQ in FL)
| Industry | F500 HQs | Revenue |
|---|---|---|
| Industrial Technology | 2 | $29B |
|
||
| Insurance | 2 | $17B |
|
||
| Retail | 1 | $60B |
|
||
| Technology Distribution | 1 | $58B |
|
||
| Homebuilding | 1 | $35B |
|
||
| Technology Manufacturing | 1 | $35B |
|
||
Price history
+163.4% since first listed31 events — show timeline
- 2026-05-16 Contingent — Beaches MLS
- 2026-04-06 Listed $199,900 Beaches MLS
- 2026-04-03 Listing Removed — MCRTC
- 2026-01-30 Price Changed $210,000 MCRTC
- 2026-01-07 Price Changed $235,000 MCRTC
- 2025-04-13 Listed $265,000 MCRTC
- 2016-06-26 Listing Removed — MCRTC
- 2016-04-28 Price Changed $100,000 MCRTC
- 2015-06-15 Sold (Public Records) $100,000 Public Records
- 2015-06-12 Price Changed $109,999 MCRTC
- 2015-06-12 Sold (MLS) $100,000 MCRTC
- 2014-10-29 Listed $109,999 MCRTC
- 2014-10-20 Listing Removed — Beaches MLS
- 2014-10-20 Listing Removed — MCRTC
- 2014-06-20 Listed $114,999 Beaches MLS
- 2014-06-20 Listed $114,999 MCRTC
- 2011-08-25 Sold (MLS) $59,500 Beaches MLS
- 2011-05-04 Listing Removed — Beaches MLS
- 2011-03-21 Listed $59,500 Beaches MLS
- 2005-11-11 Listing Removed — Beaches MLS
- 2005-10-16 Listed $191,000 Beaches MLS
- 2005-10-16 Listed $191,000 MCRTC
- 2005-08-10 Sold (Public Records) $175,000 Public Records
- 2005-07-22 Sold (MLS) $175,000 Beaches MLS
- 2005-07-22 Price Changed $189,900 MCRTC
- 2005-06-22 Listing Removed — Beaches MLS
- 2005-05-02 Listed $189,900 Beaches MLS
- 2005-05-02 Listed $175,000 MCRTC
- 2001-08-14 Sold (Public Records) $75,900 Public Records
- 2001-08-10 Sold (MLS) $75,900 MCRTC
- 2001-06-25 Listed $75,900 MCRTC
Property tax history
+11.1%/yrLatest (2025): $2,946 · -0.5% YoY. Source: county tax records.
Cash-flow waterfall
monthlySold comps — $/sqft
last 12 mo · ≤1 miLoading sold comps…