18034 Ridgewood Ave · Lansing, IL
Flood risk 1/10 · Minimal
- FEMA flood zone
- X (unshaded)
- Chance of flooding over 30 yrs
- 0.0%
- Est. flood insurance / yr
- $507 – $1,088
Fire risk 3/10 · Minor
- Est. fire insurance / yr
- $804 – $1,492
Heat risk 3/10 · Minor
- Hot days now (above 102°F)
- 7 days/yr
- Hot days in 30 yrs
- 15 days/yr
Wind risk 2/10 · Minimal
- Chance of severe wind over 30 yrs
- 0.0%
Air-quality risk 4/10 · Minor
- Unhealthy air days now
- 5 days/yr
- Unhealthy air days in 30 yrs
- 6 days/yr
Risk factors via First Street. Map © Google.
Why this score? — see what drove the D- grade
The composite is a weighted blend of 9 inputs, each scored 0–100. Each bar is that input's sub-score; the figure is the points it added to the 100-point composite (weight × sub-score).
- Cash flow +10.5/30.0
- ARV discount +7.7/15.0
- 1% rule +5.0/10.0
- Livability +3.7/5.0
- DSCR +3.0/10.0
- Rent growth +2.5/5.0
- Condition / age +2.5/5.0
- Schools +1.0/10.0
- Appreciation +0.0/10.0
$202,000
🖨 Deal sheet 📄 Offer letter ✓ Due diligence
Listing remarks
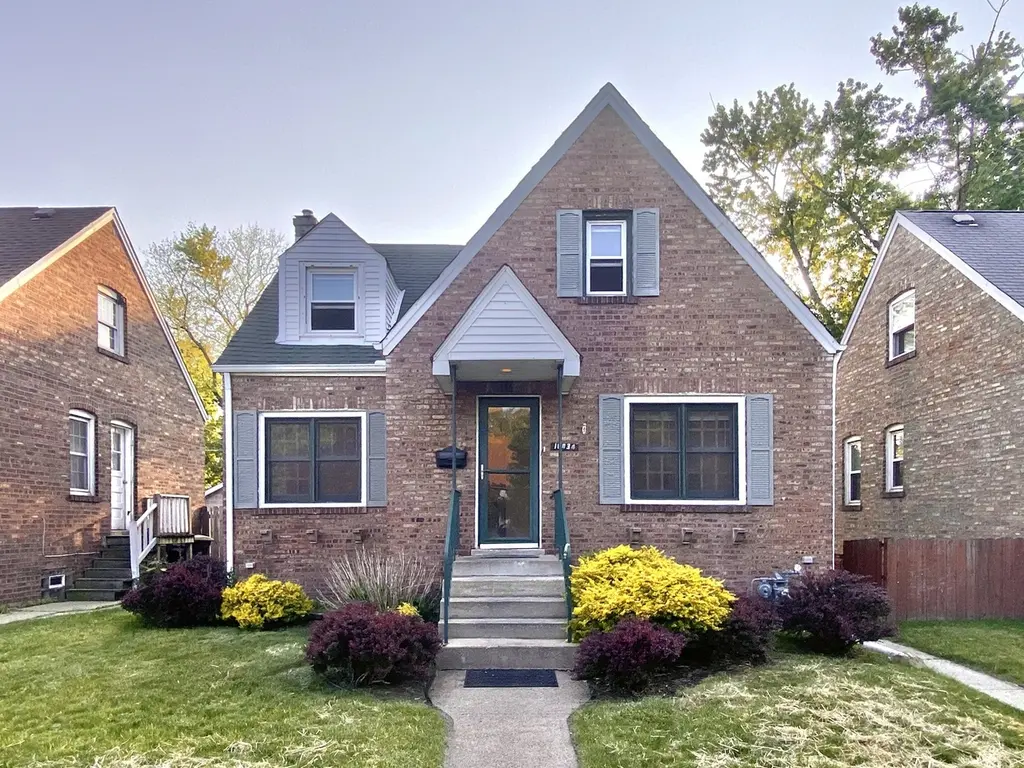
This impressive and sturdy brick home is sure to charm, offering an incredible amount of space and a welcoming atmosphere from the moment you arrive! You'll immediately appreciate the timeless appeal and solid construction. Inside, a wonderful layout awaits, featuring five generously sized bedrooms, including a notably spacious master, ensuring everyone has their own comfortable retreat. Picture delightful gatherings in the inviting living room, or imagine the possibilities in the full finished basement - a fantastic bonus area perfect for a recreation zone, home office, or media room. This home truly understands the need for both personal space and areas to come together! This gem is pe
Key facts
- Brick home
- 4,836 sq ft lot
- 2 garage spots
Tags
Property features AI
Finance
- HOA & community: No master association fee required
Exterior
- Parking: Detached garage with garage door opener (approximately 2.5 garage spaces / 2.5 total parking)
- Utilities: Public water; Public sewer; Electric service with circuit breakers
- Home design: Detached single-family home; Three stories
- Construction: Brick construction; Block foundation; Asphalt roof; Built approximately 81–90 years ago; Built before 1978
- Exterior features: Lot dimensions approximately 39 x 124; Lot smaller than 0.25 acre; Off-alley access
Interior
- Kitchen: Kitchen with eating area/table space; Kitchen/Dining combo
- Bedrooms: 4 bedrooms (plus 1 possible bedroom); One bedroom located in the basement; Master bedroom on the second floor
- Flooring: Hardwood floors in living room, master bedroom and several upstairs/main bedrooms; Vinyl flooring in kitchen and basement family room
- Bathrooms: 2 full bathrooms; Basement includes a bathroom
- Heating & cooling: Natural gas forced-air heating; Central air conditioning
- Interior features: Finished full basement; 9 total rooms
- Laundry & utility: Basement laundry room
Neighborhood map
What this means for you Summary
Snapshot
- This is a 3-bed/1.0-bath single-family listed at $202k.
Deal economics
- At list price, monthly cash flow is $-104 ($-1k/yr) — negative.
- To cash-flow at today's rent, offer at most $184k (9.1% below list).
- To meet the 1% rule (rent ≥ 1% of price), the offer needs to be $202k (0.2% below list).
- Recommended offer: $184k (9.1% below list) — sets the bar for cash-flow.
Location & tenants
- Location reads 73/100 on livability (#296 in IL) — a middle-class / working-renter tenant base. Strengths: commute A+, cost of living A+, housing A+; Watch: schools D+, crime D+, health & safety D+.
- Thornton Fractional Twp Hsd 215 (suburban): math 9% / reading 13% proficiency, ranked #563 of 620 in IL (top 91%) — low school quality limits family demand, transient renter base, plan for 1-2y turnover.
- Market conditions: 132 active listings in the ZIP; 18 comparable units currently listed for rent nearby; rentals leasing fast (median 11d on market — plan ~1-2 weeks tenant-placement turnaround); solid renter incomes; 6,272 units permitted in Cook County in 2024 (4,658 in 5+ unit buildings).
- This rent runs 32% of the median local income ($76k/yr) — at the standard rent-burdened threshold; future hikes will face affordability resistance.
Forward outlook
- Local home prices are declining (-3.0%/yr); year-one equity from $1k of loan paydown is wiped out by about $6k of value loss. Plan a longer hold.
Negotiation context
- Only 6 days on market — expect competitive offers; lowballing is unlikely to land.
- 4 sale attempts since 12y ago with the ask held roughly flat each time — persistent listings suggest the price (not the market) is what's stuck; bring a comps-based counter.
Risks & watch-outs
- Watch-outs: property tax is 3.3% of price; built in 1942 — expect roof / HVAC / electrical / plumbing capex.
Questions for the listing agent
- What do current leases actually rent for vs. the listed asking? Can we see a recent rent roll and the last 12 months of T-12 income?
- Built in 1942 — when were the roof, HVAC, electrical panel, plumbing, and water heater last replaced?
- Property tax is high relative to price — has the assessment been appealed recently, and will the sale trigger a re-assessment?
- Is there a deadline driving the sale (1031 exchange, divorce, estate, relocation)? That informs how much negotiation room exists.
- Schools are D-rated, which usually means shorter tenancies and higher turnover. Who's the typical renter profile here, and what's been the actual vacancy rate?
- Crime grade is D in this area — have there been break-ins, vandalism, or insurance claims at this property in the last 3 years? What carrier currently insures it and at what premium?
- The area grade is low — what's the realistic commute time and amenity access for the typical tenant pool here? Any planned neighborhood developments (good or bad) we should know about?
- What's the average days-on-market for RENTAL listings here right now (not sales)? A rising rental-DOM trend means longer vacancies and softer asking-rent achievability than the comps imply.
- What's the recent tenant-quality profile in this submarket — average credit score on applications, eviction rate, late-payment / NSF rate, and stable-employment percentage? A property-management company in the area should have these aggregated.
- How much new for-sale + rental construction is in the pipeline within 1–3 miles? Heavy new supply typically softens prices + rents 12–24 months out; constrained supply supports both.
Investment metrics
- 1% rule
- 1.00% ✗
- Cap rate
- 5.68%
- Cash-on-cash
- -2.20%
- DSCR
- 0.90
- GRM
- 8.4
CMA / ARV
- ARV (on-the-fly)
- $202,950
- Comps found
- 12
Show comp detail 12 sales within ~0.75 mi
| Address | Dist | Beds/Ba | Sqft | Sold | Price | $/sf | Match |
|---|---|---|---|---|---|---|---|
| 17913 Oakwood Ave | 0.17mi | 3/1.0 | 1,257 (-7%) | 2mo | $182,000 | $145 | 79 |
| 17908 Lorenz Ave | 0.26mi | 3/2.0 | 1,294 (-4%) | 1mo | $225,000 | $174 | 76 |
| 18032 Wildwood Ave | 0.13mi | 3/1.5 | 1,224 (-10%) | 1mo | $170,000 | $139 | 76 |
| 17714 Burnham Ave | 0.52mi | 3/1.5 | 1,303 (-4%) | 1mo | $164,494 | $126 | 67 |
| 18013 Park Ave | 0.16mi | 3/2.0 | 1,200 (-11%) | 3mo | $180,000 | $150 | 67 |
| 2621 Ridge Rd | 0.43mi | 4/2.0 (+1) | 1,323 (-2%) | 2mo | $216,000 | $163 | 66 |
| 17949 Escanaba Ave | 0.36mi | 3/1.0 | 1,188 (-12%) | 1mo | $149,000 | $125 | 62 |
| 2643 Ridge Rd | 0.39mi | 3/2.0 | 1,502 (+11%) | 2mo | $234,000 | $156 | 58 |
| 17821 Roy St | 0.54mi | 3/1.0 | 1,188 (-12%) | 1mo | $117,500 | $99 | 54 |
| 2745 179th St | 0.27mi | 4/3.0 (+1) | 1,200 (-11%) | 6mo | $190,000 | $158 | 51 |
| 3316 Ann St | 0.67mi | 3/2.5 | 1,264 (-7%) | 3mo | $260,000 | $206 | 49 |
| 3238 178th St | 0.53mi | 3/1.5 | 1,550 (+15%) | 2mo | $200,000 | $129 | 47 |
Match score weights: distance 35% · size 25% · config 20% · recency 20%. Top-matched comps best support the ARV.
Projected returns pro-forma
-3.0% appreciation · 3.0% rent growth · sell at horizon
- IRR
- -19.8%
- Equity multiple
- 0.31×
- Total profit
- $-39,118
- Equity at exit
- $30,119
- IRR
- -12.4%
- Equity multiple
- 0.26×
- Total profit
- $-41,690
- Equity at exit
- $17,465
Cash invested: $56,560 (down + closing). Projections, not guarantees.
Landlord ↔ Tenant lean methodology
- Overall (STATE)
- 43 Moderately Tenant-Leaning
- State Illinois
- 43 Moderately Tenant-Leaning · D+7
- County
- — inherits STATE
- City
- — inherits STATE
ZIP-level market 60438
- Active inventory
- 132
- Price-to-rent
- 8.4×
Monthly cashflow live
- Estimated rent
- $2,015 high interval (Pro) →
- Mortgage (P&I)
- −$1,059
- Tax from tax record
- −$552 /mo · $6,629/yr
- Insurance
- −$84
- HOA
- −$0
- Vacancy / Maint / Mgmt
- −$423
- Net cashflow
- $-104
Break-even live
UW: 25.0% down · 7.5% · 30yr · 1.5% tax · 5.0% vac · 8.0% maint · 8.0% mgmt
Financing live
Cash to close
- Down payment
- $50,500
- Closing costs
- $6,060
- Reserves months
- —
- Total cash needed
- —
Loan-product check · same deal, 3 products live
Conventional
25% down · 7.5% · 30yr
- Down + closing
- —
- Monthly P&I
- —
- Monthly cashflow
- —
- DSCR
- —
- Eligible?
- —
Personal DTI + credit; lowest rate.
DSCR
20% down · 8.5% · 30yr
- Down + closing
- —
- Monthly P&I
- —
- Monthly cashflow
- —
- DSCR
- —
- Eligible?
- —
No personal income docs; deal must DSCR.
Hard money
10% down · 12.0% · 12mo
- Down + closing
- —
- Monthly P&I
- —
- Monthly cashflow
- —
- DSCR
- —
- Eligible?
- —
Short-term bridge; refi at stabilization.
Rent comps 18 comps
| Address | Beds | Baths | Sqft | Rent | $/sqft | DOM | Units | Dist |
|---|---|---|---|---|---|---|---|---|
| 18343 Oakwood Ave Lansing, IL | 4.0 | 2.0 | 1700 | $2,700 | $1.59 | 1d | 1 | 0.37mi |
| 3020 178th St Apt C7 Lansing, IL | 2.0 | 1.0 | 900 | $1,550 | $1.72 | 24d | 1 | 0.39mi |
| 3020 178th St Unit C1 Lansing, IL | 2.0 | 1.0 | 900 | $1,550 | $1.72 | 1d | 1 | 0.39mi |
| 17723 Exchange Ave Unit 17723-1N Lansing, IL | 3.0 | 2.0 | 1100 | $1,800 | $1.64 | 1d | 1 | 0.50mi |
| 2824 186th St Lansing, IL | 3.0 | 2.0 | 1400 | $2,900 | $2.07 | 10d | 1 | 0.64mi |
| 18361 Glen Oak Ave Unit 1E Lansing, IL | 2.0 | 1.0 | 900 | $1,400 | $1.56 | 24d | 1 | 0.68mi |
| 18381 Torrence Ave Lansing, IL | 2.0 | 1.0 | 900 | $1,300 | $1.44 | 24d | 1 | 0.75mi |
| 18335 Sherman St Unit 3 Lansing, IL | 3.0 | 1.0 | 1000 | $1,700 | $1.70 | 1d | 1 | 0.81mi |
| 3341 S Schultz Dr Lansing, IL | 4.0 | 2.0 | 1452 | $2,250 | $1.55 | 10d | 1 | 0.83mi |
| 3023 Bernice Rd Apt 2S Lansing, IL | 3.0 | 1.0 | 1000 | $1,600 | $1.60 | 1d | 1 | 0.84mi |
| 3069 Bernice Rd Apt 2S Lansing, IL | 3.0 | 1.0 | 950 | $1,535 | $1.62 | 3d | 1 | 0.85mi |
| 3069 Bernice Rd Apt 2N Lansing, IL | 3.0 | 1.0 | 950 | $1,535 | $1.62 | 20d | 1 | 0.85mi |
| 18550 Torrence Ave #25 Lansing, IL | 2.0 | 1.0 | 1000 | $1,300 | $1.30 | 11d | 1 | 0.91mi |
| 17640 Rosewood Dr Unit 2A Lansing, IL | 2.0 | 1.0 | 950 | $1,475 | $1.55 | 17d | 1 | 1.20mi |
| 3649 173rd Ct Lansing, IL | 2.0 | 2.0 | 972 | $1,357 | $1.40 | 24d | 1 | 1.32mi |
| 232 Gregory Ave Munster, IN | 3.0 | 1.5 | 1600 | $2,450 | $1.53 | 1d | 1 | 1.36mi |
| 7611 Kinsley Pl Munster, IN | 3.0 | 2.0 | 1700 | $4,700 | $2.76 | 1d | 1 | 1.42mi |
| 7610 Manor Ave Munster, IN | 3.0 | 2.0 | 1700 | $4,750 | $2.79 | 1d | 1 | 1.45mi |
Listing history 33 events
-
2026-06-18days on market $202,000 Active 6 DOM
-
2026-06-17days on market $202,000 Active 5 DOM
-
2026-06-16days on market $202,000 Active 4 DOM
-
2026-06-15days on market $202,000 Active 3 DOM
-
2026-06-13statusdays on market $202,000 Active 1 DOM
-
2026-06-09days on market $202,000 Contingent - Continue to Show 146 DOM
-
2026-06-08days on market $202,000 Contingent - Continue to Show 145 DOM
-
2026-06-07days on market $202,000 Contingent - Continue to Show 144 DOM
-
2026-06-04days on market $202,000 Contingent - Continue to Show 141 DOM
-
2026-06-03days on market $202,000 Contingent - Continue to Show 140 DOM
-
2026-06-02days on market $202,000 Contingent - Continue to Show 139 DOM
-
2026-06-01days on market $202,000 Contingent - Continue to Show 138 DOM
-
2026-05-31days on market $202,000 Contingent - Continue to Show 137 DOM
-
2026-02-26historical Contingent - Continue to Show
-
2026-01-14$202,000 Active
-
2026-01-14historical
-
2026-01-09price
-
2025-12-05price
-
2025-10-10Active
-
2025-10-10historical
-
2025-10-03price
-
2025-08-29price
-
2025-08-18price
-
2025-08-01price
-
2025-07-18price
-
2025-07-02price
-
2025-06-18price
-
2025-06-05Active
-
2017-12-26soldstatus $1,173,000
-
2014-08-13soldstatus $105,000 Closed Sale
-
2014-07-03historical Contingent
-
2014-06-02$124,900 New
-
2000-10-27soldstatus $94,000
ⓘ Source: listings_history table (triggers on properties + properties_extension) + one-shot
backfill from property_details.listing_events for pre-trigger history.
Tax reassessment forecast IL · Partial reset (capped growth)
- Current annual tax
- $6,629 · $552/mo
- Projected year-2 tax
- $6,629 · $552/mo
- Expected delta
- $0/yr ($0/mo · 0.0%)
ⓘ Screening estimate from a state-policy table — verify with the county assessor before closing.
Climate risk First Street
- Flood 1/10 Low FEMA zone X (unshaded) · 0% chance over 30 yrs
- Wildfire 3/10 Moderate
- Heat 3/10 Moderate 7 d/yr ≥102°F today · 15 d/yr by 30 yrs out
- Wind 2/10 Low 0% chance of damaging wind over 30 yrs
- Air quality 4/10 Moderate 5 unhealthy d/yr today · 6 by 30 yrs out
Nearby sold comps map
Loading sold comps map…
Walkable amenities ~0.75 mi
Loading nearby amenities…
Taxation est. · year 1
- Rental income
- $24,186
- − Mortgage interest
- −$11,315
- − Property taxes
- −$6,629
- − Insurance
- −$1,010
- − Repairs & maintenance
- −$1,935
- − Management
- −$1,935
- − Depreciation
- −$5,876
- Taxable loss
- −$4,514
- Est. tax savings @ 24.0%
- +$1,083
- After-tax cash flow
- $-160/yr
For passive investors: Depreciation is non-cash, so a rental often shows a tax loss while cash-flowing — sheltering income. Rental losses are passive: they offset passive income freely, and up to $25,000/yr can offset ordinary (W-2) income if you actively participate and your MAGI is under $100k (phasing out to $0 by $150k); unused losses carry forward. On sale, claimed depreciation is recaptured at up to 25%, and gains may owe capital-gains tax (a 1031 exchange can defer both). Figures are a year-1 estimate at your 24.0% rate — not tax advice; consult a CPA.
Schools (NCES district)
- District
- Thornton Fractional Twp Hsd 215
- NCES district ID
- 1738940
- Math proficiency
- 9% ▼ -3.00%
- Reading proficiency
- 13% ▼ -3.00%
- Median HH income
- $48,207
- Composite
- 10.27/100
- National rank
- #9793
- State rank
- #563 of 620 in IL
Livability — Lansing
- Score
- 73/100
- State rank
- #296
- US rank
- #5698
Category grades
Schools grade is shown separately in the Schools card above.
Census & demographics
- Census place
- Lansing, IL
- County
- Cook County · 4,486,803 people
- City population
- 28,806
- Metro
- Chicago-Naperville-Elgin, IL-IN-WI
- Population (ZIP)
- 28,806
- Household income
- $75,681
- Rent vs Own
- Severe rent burden
- 830.0
Population outlook (Cook County) Hauer SSP2
- Today (2025)
- 5,347,519 people
- By 2030
- 5,357,703 · +0.2%
- By 2040
- 5,324,924 · -0.4%
- By 2050
- 5,230,762 · -2.2%
- By 2075
- 4,785,735 · -10.5%
- By 2100
- 4,188,836 · -21.7%
Race, ethnicity, and origin ACS 2023
- Neighborhood character
- Diverse neighborhood (Simpson 0.65)
- Race & ethnicity
- Black 51% White 25% Hispanic / Latino 18% Two or more races 7% Asian 2%
- Hispanic origin (detail)
- Mexican 15%
- Common ancestry
- Romanian 5% Iranian 3% Lithuanian 1%
- Foreign-born
- 10% · Canada
- Languages at home
- 83% English-only · Spanish 12% Vietnamese 1% French/Haitian/Cajun 1%
Political lean MEDSL · Cook
- 2024 margin
- Solid D (+42.0) · D 70.4% · R 28.4% · Other 1.2%
- 2008→2024 swing
- -11.4pp toward R · 2008: 53.4pp · 2024: 42.0pp
- All cycles
- 2024: D+42.0 2020: D+50.3 2016: D+53.0 2012: D+49.4 2008: D+53.4
Not yet ingested
- Civics
- —
Market trends
- HPI YoY
- ▼ -151.65%
- Current HPI
- 210.3398
- Rent YoY
- —
- Metro
- Chicago-Naperville-Elgin, IL-IN-WI
- State GDP YoY
- ▲ 1.59%
- F500 in state
- 60
Industry mix (Fortune 500 HQ in IL)
| Industry | F500 HQs | Revenue |
|---|---|---|
| Insurance | 4 | $201B |
|
||
| Consumer Goods | 4 | $87B |
|
||
| Industrial Machinery | 3 | $64B |
|
||
| Healthcare | 2 | $55B |
|
||
| Retail / Pharmacy | 1 | $148B |
|
||
| Agriculture / Food | 1 | $86B |
|
||
Price history
+114.9% since first listed20 events — show timeline
- 2026-02-26 Contingent — MRED as Distributed by MLS Grid
- 2026-01-14 Listing Removed — MRED as Distributed by MLS Grid
- 2026-01-14 Listed $202,000 MRED as Distributed by MLS Grid
- 2026-01-09 Price Changed — MRED as Distributed by MLS Grid
- 2025-12-05 Price Changed — MRED as Distributed by MLS Grid
- 2025-10-10 Listing Removed — MRED as Distributed by MLS Grid
- 2025-10-10 Listed — MRED as Distributed by MLS Grid
- 2025-10-03 Price Changed — MRED as Distributed by MLS Grid
- 2025-08-29 Price Changed — MRED as Distributed by MLS Grid
- 2025-08-18 Price Changed — MRED as Distributed by MLS Grid
- 2025-08-01 Price Changed — MRED as Distributed by MLS Grid
- 2025-07-18 Price Changed — MRED as Distributed by MLS Grid
- 2025-07-02 Price Changed — MRED as Distributed by MLS Grid
- 2025-06-18 Price Changed — MRED as Distributed by MLS Grid
- 2025-06-05 Listed — MRED as Distributed by MLS Grid
- 2017-12-26 Sold (Public Records) $1,173,000 Public Records
- 2014-08-13 Sold (MLS) $105,000 MRED as Distributed by MLS Grid
- 2014-07-03 Contingent — MRED as Distributed by MLS Grid
- 2014-06-02 Listed $124,900 MRED as Distributed by MLS Grid
- 2000-10-27 Sold (Public Records) $94,000 Public Records
Property tax history
+5.1%/yrLatest (2023): $6,629 · +11.9% YoY. Source: county tax records.
Cash-flow waterfall
monthlySold comps — $/sqft
last 12 mo · ≤1 miLoading sold comps…