1544 W Pear Ln · Greenville, MS
Flood risk 1/10 · Minimal
- FEMA flood zone
- X
- Chance of flooding over 30 yrs
- 0.0%
- Est. flood insurance / yr
- $507 – $1,088
Fire risk 1/10 · Minimal
- Est. fire insurance / yr
- $1,241 – $2,305
Heat risk 7/10 · Major
- Hot days now (above 110°F)
- 7 days/yr
- Hot days in 30 yrs
- 21 days/yr
Wind risk 6/10 · Moderate
- Chance of severe wind over 30 yrs
- 42.0%
Air-quality risk 1/10 · Minimal
- Unhealthy air days now
- 0 days/yr
- Unhealthy air days in 30 yrs
- 0 days/yr
Risk factors via First Street. Map © Google.
Why this score? — see what drove the D grade
The composite is a weighted blend of 9 inputs, each scored 0–100. Each bar is that input's sub-score; the figure is the points it added to the 100-point composite (weight × sub-score).
- Cash flow +16.2/30.0
- ARV discount +7.5/15.0
- DSCR +5.0/10.0
- 1% rule +3.5/10.0
- Livability +2.9/5.0
- Rent growth +2.5/5.0
- Condition / age +2.5/5.0
- Schools +0.5/10.0
- Appreciation +0.0/10.0
$140,000
🖨 Deal sheet 📄 Offer letter ✓ Due diligence
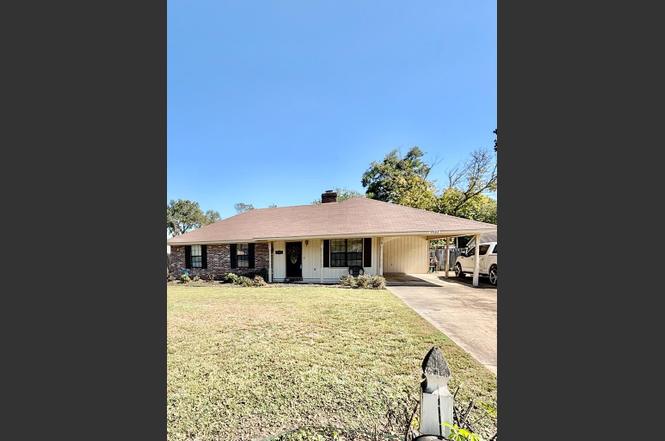
Listing remarks
Welcome to this cute and cozy corner-lot home featuring 3 bedrooms and 2 full baths. The spacious family room offers a vaulted ceiling and a beautiful fireplace, creating a warm and inviting atmosphere. Both bathrooms have been updated with modern ceramic finishes and stylish countertops, while the kitchen features white cabinetry with raised panel doors, giving it a bright and clean look. The laundry room provides plenty of space for storage and ironing convenience. Sitting on an oversized lot, this property is perfect for family gatherings and outdoor entertaining New carpet has been installed in the living room, hallway, and bedrooms. The detached storage building, equipped with electric
Key facts
- Stylish countertops
- Corner-lot home
- Vaulted ceiling
Tags
Neighborhood map
What this means for you Summary
Snapshot
- This is a 3-bed/1.0-bath other listed at $140k.
Deal economics
- At list price, monthly cash flow is $74 ($889/yr) — positive.
- The deal already cash-flows at list — no discount required.
- To meet the 1% rule (rent ≥ 1% of price), the offer needs to be $119k (14.8% below list).
- Recommended offer: $119k (14.8% below list) — sets the bar for 1% rule.
- Cap rate 6.9% vs local median 4.5% in Greenville — top-decile yield for the area; either an underpriced asset or a hidden risk that comps aren't pricing in. Stress-test before assuming the spread holds.
Location & tenants
- Location reads 57/100 on livability (#284 in MS) — a working-class tenant base; expect higher turnover. Strengths: cost of living A+, housing A; Watch: schools F, amenities F, commute F.
- Greenville Public Schools (town): math 4% / reading 11% proficiency, ranked #126 of 130 in MS (top 97%) — low school quality limits family demand, transient renter base, plan for 1-2y turnover; 93% free/reduced lunch — lower-income household profile, screen leases tightly.
- Market conditions: 128 active listings in the ZIP; 3 comparable units currently listed for rent nearby; rentals lingering (median 44d on market — plan ~5-8 weeks vacancy on turnover, expect pricing pressure); 100% of comp listings sitting > 30 days — soft ceiling on asking rent; 10 units permitted in Washington County in 2024 (0 in 5+ unit buildings).
Forward outlook
- Local home prices are declining (-3.0%/yr); year-one equity from $968 of loan paydown is wiped out by about $4k of value loss. Plan a longer hold.
- Washington County population projected at -36% by 2050 — secular population decline; favor cash flow + early exit over multi-decade hold.
Negotiation context
- It's been on market 96 days — a 9% lower offer ($127k) is reasonable based on typical stale-listing flexibility.
Risks & watch-outs
- Climate carrying-cost: major wind risk, 42% chance of damaging wind over 30y; extreme-heat days projected 7→21/yr by 2055 (HVAC capex compounding) — expect insurance premiums to compound above CPI over the hold.
Questions for the listing agent
- It's been on market 96 days. Have you received any prior offers? Is the seller open to a 15% concession, seller financing, or rate buy-down credit?
- Why hasn't it sold? Are there any deal-killer items the seller is aware of (foundation, flood, title, zoning, code violations)?
- Is there a deadline driving the sale (1031 exchange, divorce, estate, relocation)? That informs how much negotiation room exists.
- Schools are F-rated, which usually means shorter tenancies and higher turnover. Who's the typical renter profile here, and what's been the actual vacancy rate?
- The area grade is low — what's the realistic commute time and amenity access for the typical tenant pool here? Any planned neighborhood developments (good or bad) we should know about?
- What's the average days-on-market for RENTAL listings here right now (not sales)? A rising rental-DOM trend means longer vacancies and softer asking-rent achievability than the comps imply.
- What's the recent tenant-quality profile in this submarket — average credit score on applications, eviction rate, late-payment / NSF rate, and stable-employment percentage? A property-management company in the area should have these aggregated.
- How much new for-sale + rental construction is in the pipeline within 1–3 miles? Heavy new supply typically softens prices + rents 12–24 months out; constrained supply supports both.
Investment metrics
- 1% rule
- 0.85% ✗
- Cap rate
- 6.93%
- Cash-on-cash
- 2.27%
- DSCR
- 1.10
- GRM
- 9.8
CMA / ARV
No comps found within radius.
Projected returns pro-forma
-3.0% appreciation · 3.0% rent growth · sell at horizon
- IRR
- -12.7%
- Equity multiple
- 0.54×
- Total profit
- $-18,009
- Equity at exit
- $20,874
- IRR
- -3.8%
- Equity multiple
- 0.75×
- Total profit
- $-9,778
- Equity at exit
- $12,105
Cash invested: $39,200 (down + closing). Projections, not guarantees.
Landlord ↔ Tenant lean methodology
- Overall (STATE)
- 90 Strongly Landlord-Friendly
- State Mississippi
- 90 Strongly Landlord-Friendly · R+11
- County
- — inherits STATE
- City
- — inherits STATE
ZIP-level market 38701
- Active inventory
- 128
- Price-to-rent
- 9.8×
Monthly cashflow live
- Estimated rent
- $1,193 medium interval (Pro) →
- Mortgage (P&I)
- −$734
- Tax from tax record
- −$76 /mo · $910/yr
- Insurance
- −$58
- HOA
- −$0
- Vacancy / Maint / Mgmt
- −$251
- Net cashflow
- $74
Break-even live
UW: 25.0% down · 7.5% · 30yr · 1.5% tax · 5.0% vac · 8.0% maint · 8.0% mgmt
Financing live
Cash to close
- Down payment
- $35,000
- Closing costs
- $4,200
- Reserves months
- —
- Total cash needed
- —
Loan-product check · same deal, 3 products live
Conventional
25% down · 7.5% · 30yr
- Down + closing
- —
- Monthly P&I
- —
- Monthly cashflow
- —
- DSCR
- —
- Eligible?
- —
Personal DTI + credit; lowest rate.
DSCR
20% down · 8.5% · 30yr
- Down + closing
- —
- Monthly P&I
- —
- Monthly cashflow
- —
- DSCR
- —
- Eligible?
- —
No personal income docs; deal must DSCR.
Hard money
10% down · 12.0% · 12mo
- Down + closing
- —
- Monthly P&I
- —
- Monthly cashflow
- —
- DSCR
- —
- Eligible?
- —
Short-term bridge; refi at stabilization.
Rent comps 3 comps
| Address | Beds | Baths | Sqft | Rent | $/sqft | DOM | Units | Dist |
|---|---|---|---|---|---|---|---|---|
| 1462 S Colorado St Greenville, MS | 2.0–3.0 | 2.0 | 1150 | $1,358 | $1.18 | 43d | 4 | 0.46mi |
| 250 Cypress Ln Greenville, MS | 1.0–2.0 | 1.0–1.5 | 807 | $959 | $1.19 | 43d | 1 | 1.33mi |
| 614 Fairview Ave Unit 7 Greenville, MS | 2.0 | 1.0 | 950 | $799 | $0.84 | 43d | 1 | 1.37mi |
Listing history 2 events
-
2026-01-16status Pending
-
2025-10-11$140,000 Active
ⓘ Source: listings_history table (triggers on properties + properties_extension) + one-shot
backfill from property_details.listing_events for pre-trigger history.
Tax reassessment forecast MS · Resets to sale price
- Current annual tax
- $910 · $76/mo
- Projected year-2 tax
- $1,106 · $92/mo
- Expected delta
- +$196/yr (+$16/mo · 21.6%)
ⓘ Screening estimate from a state-policy table — verify with the county assessor before closing.
Climate risk First Street
- Flood 1/10 Low FEMA zone X · 0% chance over 30 yrs
- Wildfire 1/10 Low
- Heat 7/10 Severe 7 d/yr ≥110°F today · 21 d/yr by 30 yrs out
- Wind 6/10 Major 42% chance of damaging wind over 30 yrs
- Air quality 1/10 Low 0 unhealthy d/yr today · 0 by 30 yrs out
Nearby sold comps map
Loading sold comps map…
Walkable amenities ~0.75 mi
Loading nearby amenities…
Taxation est. · year 1
- Rental income
- $14,315
- − Mortgage interest
- −$7,842
- − Property taxes
- −$910
- − Insurance
- −$700
- − Repairs & maintenance
- −$1,145
- − Management
- −$1,145
- − Depreciation
- −$4,073
- Taxable loss
- −$1,500
- Est. tax savings @ 24.0%
- +$360
- After-tax cash flow
- $1,249/yr
For passive investors: Depreciation is non-cash, so a rental often shows a tax loss while cash-flowing — sheltering income. Rental losses are passive: they offset passive income freely, and up to $25,000/yr can offset ordinary (W-2) income if you actively participate and your MAGI is under $100k (phasing out to $0 by $150k); unused losses carry forward. On sale, claimed depreciation is recaptured at up to 25%, and gains may owe capital-gains tax (a 1031 exchange can defer both). Figures are a year-1 estimate at your 24.0% rate — not tax advice; consult a CPA.
Schools (NCES district)
- District
- Greenville Public Schools
- NCES district ID
- 2801620
- Math proficiency
- 4% ▼ -20.00%
- Reading proficiency
- 11% ▼ -12.00%
- Median HH income
- $26,432
- Composite
- 5.27/100
- National rank
- #10035
- State rank
- #126 of 130 in MS
Livability — Greenville
- Score
- 57/100
- State rank
- #284
- US rank
- #21778
Category grades
Schools grade is shown separately in the Schools card above.
Census & demographics
- Census place
- Greenville, MS
- Population (ZIP)
- 21,260
Population outlook (Washington County) Hauer SSP2
- Today (2025)
- 41,424 people
- By 2030
- 38,061 · -8.1%
- By 2040
- 31,752 · -23.3%
- By 2050
- 26,394 · -36.3%
- By 2075
- 17,180 · -58.5%
- By 2100
- 12,936 · -68.8%
Race, ethnicity, and origin ACS 2023
- Neighborhood character
- Predominantly Black (73%)
- Race & ethnicity
- Black 73% White 24% Asian 2%
- Common ancestry
- Lithuanian 1%
- Foreign-born
- 1%
- Languages at home
- 96% English-only · Spanish 1% Other Indo-European 1%
Political lean MEDSL · Washington
- 2024 margin
- Solid D (+35.0) · D 67.0% · R 32.0% · Other 1.1%
- 2008→2024 swing
- +0.2pp no change · 2008: 34.7pp · 2024: 35.0pp
- All cycles
- 2024: D+35.0 2020: D+40.0 2016: D+36.4 2012: D+42.7 2008: D+34.7
Not yet ingested
- Civics
- —
Market trends
- HPI YoY
- ▼ -102.75%
- Current HPI
- 52.6126
- Rent YoY
- —
- Metro
- —
- State GDP YoY
- —
- F500 in state
- 0
Price history
2 events — show timeline
- 2026-01-16 Pending — Greenville Area MLS
- 2025-10-11 Listed $140,000 Greenville Area MLS
Property tax history
+2.6%/yrLatest (2025): $910 · +5.3% YoY. Source: county tax records.
Cash-flow waterfall
monthlySold comps — $/sqft
last 12 mo · ≤1 miLoading sold comps…