48792 Sourdough Rd #29 · Ehrenberg, AZ
Flood risk 1/10 · Minimal
- FEMA flood zone
- X (unshaded)
- Chance of flooding over 30 yrs
- 0.0%
- Est. flood insurance / yr
- $507 – $1,088
Fire risk 4/10 · Minor
- Est. fire insurance / yr
- $610 – $1,132
Heat risk 10/10 · Severe
- Hot days now (above 116°F)
- 7 days/yr
- Hot days in 30 yrs
- 19 days/yr
Wind risk 1/10 · Minimal
- Chance of severe wind over 30 yrs
- —
Air-quality risk 2/10 · Minimal
- Unhealthy air days now
- 1 days/yr
- Unhealthy air days in 30 yrs
- 1 days/yr
Risk factors via First Street. Map © Google.
Why this score? — see what drove the B grade
The composite is a weighted blend of 9 inputs, each scored 0–100. Each bar is that input's sub-score; the figure is the points it added to the 100-point composite (weight × sub-score).
- Cash flow +30.0/30.0
- 1% rule +10.0/10.0
- DSCR +10.0/10.0
- ARV discount +7.5/15.0
- Appreciation +5.0/10.0
- Livability +3.2/5.0
- Rent growth +2.5/5.0
- Condition / age +2.5/5.0
- Schools +1.6/10.0
$26,000
🖨 Deal sheet 📄 Offer letter ✓ Due diligence
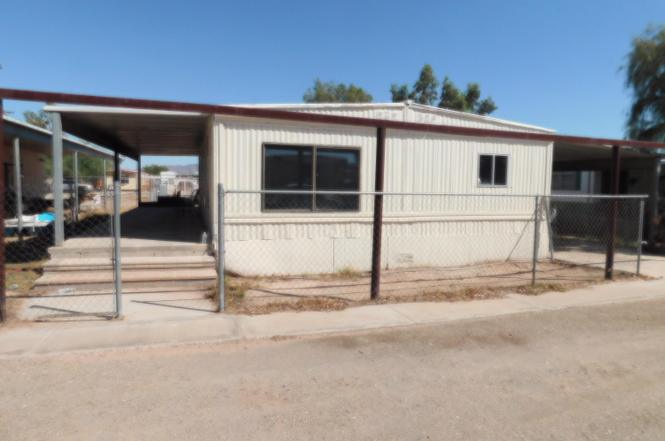
Listing remarks
Handyman Special! If you are a do-it-yourself person, here is a great project for you. The home can be refurbished to your liking. The Seller has continued to make improvement, but circumstances prevent him from completing the project and forces him to sell. The home would be great for anyone who wants to play on the river as it is about 1/2 mile away. The home has a covered carport that could easily fit a boat. On the other side sets another covered patio that could easily be converted to another carport. The property is centrally located; just a few minutes to Blythe, CA, and a few hours to LA. If one chooses to go towards Phoenix or Yuma, the trip is less than 3 hours. The home is in a m
Key facts
- 1,800 sq ft lot
- Built 1976
- Listed 264 days
Property features AI
Finance
- Other: Zoned P-MHP (Mobile/Manufactured Home Park)
- Financial info: Land is leased
Exterior
- Parking: No designated parking
- Utilities: Underground utilities; Septic tank
- Home design: Manufactured home (double wide); Residential property; Faces unspecified
- Construction: Frame construction; Metal roof; Built by Conestoga; Mobile home approximately 24' x 44'
- Exterior features: Patio; Deck; Fenced yard with front and back yard fencing; Chain link fencing; Level lot; Private maintained road
Interior
- Flooring: Laminate flooring
- Bathrooms: 1 full bathroom
- Heating & cooling: No heating; No cooling
- Interior features: Open floorplan
- Laundry & utility: Electric dryer hookup
Neighborhood map
What this means for you Summary
Snapshot
- This is a 2-bed/1.0-bath manufactured listed at $26k.
Deal economics
- At list price, monthly cash flow is $578 ($7k/yr) — positive.
- The deal already cash-flows at list — no discount required.
- Meets the 1% rule at list price ($959 rent vs $26k).
- Recommended offer: $23k (12.0% below list) — sets the bar for market timing.
Location & tenants
- Location reads 65/100 on livability (#82 in AZ) — a middle-class / working-renter tenant base. Strengths: cost of living A+, housing A+, crime A; Watch: health & safety C-, schools F, amenities F.
- Quartzsite Elementary District (4511) (rural): math 10% / reading 20% proficiency, ranked #405 of 501 in AZ (top 81%) — low school quality limits family demand, transient renter base, plan for 1-2y turnover; 82% free/reduced lunch — lower-income household profile, screen leases tightly.
- Market conditions: 24 active listings in the ZIP; 92 units permitted in La Paz County in 2024 (0 in 5+ unit buildings).
Forward outlook
- In year one you build about $960 of equity ($180 loan paydown + $780 appreciation (3.0% local appreciation)).
- La Paz County population projected at -11% by 2050 — secular population decline; favor cash flow + early exit over multi-decade hold.
- At projected returns (3.0% appreciation + 3.0% rent growth), your $7k cash investment doubles in ~1 year — after that, you're playing with house money.
Negotiation context
- It's been on market 265 days — a 12% lower offer ($23k) is reasonable based on typical stale-listing flexibility.
Risks & watch-outs
- Climate carrying-cost: extreme-heat days projected 7→19/yr by 2055 (HVAC capex compounding) — expect insurance premiums to compound above CPI over the hold.
Questions for the listing agent
- It's been on market 265 days. Have you received any prior offers? Is the seller open to a 12% concession, seller financing, or rate buy-down credit?
- Built in 1976 — when were the roof, HVAC, electrical panel, plumbing, and water heater last replaced?
- Why hasn't it sold? Are there any deal-killer items the seller is aware of (foundation, flood, title, zoning, code violations)?
- Is there a deadline driving the sale (1031 exchange, divorce, estate, relocation)? That informs how much negotiation room exists.
- Schools are F-rated, which usually means shorter tenancies and higher turnover. Who's the typical renter profile here, and what's been the actual vacancy rate?
- What's the average days-on-market for RENTAL listings here right now (not sales)? A rising rental-DOM trend means longer vacancies and softer asking-rent achievability than the comps imply.
- What's the recent tenant-quality profile in this submarket — average credit score on applications, eviction rate, late-payment / NSF rate, and stable-employment percentage? A property-management company in the area should have these aggregated.
- How much new for-sale + rental construction is in the pipeline within 1–3 miles? Heavy new supply typically softens prices + rents 12–24 months out; constrained supply supports both.
Investment metrics
- 1% rule
- 3.69% ✓
- Cap rate
- 32.98%
- Cash-on-cash
- 95.31%
- DSCR
- 5.24
- GRM
- 2.3
CMA / ARV
No comps found within radius.
Projected returns pro-forma
3.0% appreciation · 3.0% rent growth · sell at horizon
- IRR
- 99.5%
- Equity multiple
- 6.49×
- Total profit
- $39,972
- Equity at exit
- $11,691
- IRR
- 99.1%
- Equity multiple
- 13.46×
- Total profit
- $90,711
- Equity at exit
- $18,017
Cash invested: $7,280 (down + closing). Projections, not guarantees.
Landlord ↔ Tenant lean methodology
- Overall (STATE)
- 87 Strongly Landlord-Friendly
- State Arizona
- 87 Strongly Landlord-Friendly · R+3
- County
- — inherits STATE
- City
- — inherits STATE
ZIP-level market 85334
- Active inventory
- 24
- Price-to-rent
- 2.3×
Monthly cashflow live
- Estimated rent
- $959 medium interval (Pro) →
- Mortgage (P&I)
- −$136
- Tax est. 1.5%
- −$32 /mo · $390/yr
- Insurance
- −$11
- HOA
- −$0
- Vacancy / Maint / Mgmt
- −$201
- Net cashflow
- $578
Break-even live
UW: 25.0% down · 7.5% · 30yr · 1.5% tax · 5.0% vac · 8.0% maint · 8.0% mgmt
Financing live
Cash to close
- Down payment
- $6,500
- Closing costs
- $780
- Reserves months
- —
- Total cash needed
- —
Loan-product check · same deal, 3 products live
Conventional
25% down · 7.5% · 30yr
- Down + closing
- —
- Monthly P&I
- —
- Monthly cashflow
- —
- DSCR
- —
- Eligible?
- —
Personal DTI + credit; lowest rate.
DSCR
20% down · 8.5% · 30yr
- Down + closing
- —
- Monthly P&I
- —
- Monthly cashflow
- —
- DSCR
- —
- Eligible?
- —
No personal income docs; deal must DSCR.
Hard money
10% down · 12.0% · 12mo
- Down + closing
- —
- Monthly P&I
- —
- Monthly cashflow
- —
- DSCR
- —
- Eligible?
- —
Short-term bridge; refi at stabilization.
Listing history 18 events
-
2026-06-19days on market $26,000 Active 265 DOM
-
2026-06-18days on market $26,000 Active 264 DOM
-
2026-06-17days on market $26,000 Active 263 DOM
-
2026-06-16days on market $26,000 Active 262 DOM
-
2026-06-15days on market $26,000 Active 261 DOM
-
2026-06-14days on market $26,000 Active 259 DOM
-
2026-06-13days on market $26,000 Active 258 DOM
-
2026-06-10days on market $26,000 Active 256 DOM
-
2026-06-09days on market $26,000 Active 255 DOM
-
2026-06-08days on market $26,000 Active 254 DOM
-
2026-06-07days on market $26,000 Active 253 DOM
-
2026-06-03days on market $26,000 Active 249 DOM
-
2026-06-02days on market $26,000 Active 248 DOM
-
2026-06-01days on market $26,000 Active 247 DOM
-
2026-05-31days on market $26,000 Active 246 DOM
-
2026-05-30days on market $26,000 Active 245 DOM
-
2025-12-26price $26,000
-
2025-09-27$22,000 Active
ⓘ Source: listings_history table (triggers on properties + properties_extension) + one-shot
backfill from property_details.listing_events for pre-trigger history.
Climate risk First Street
- Flood 1/10 Low FEMA zone X (unshaded) · 0% chance over 30 yrs
- Wildfire 4/10 Moderate
- Heat 10/10 Extreme 7 d/yr ≥116°F today · 19 d/yr by 30 yrs out
- Wind 1/10 Low
- Air quality 2/10 Low 1 unhealthy d/yr today · 1 by 30 yrs out
Nearby sold comps map
Loading sold comps map…
Walkable amenities ~0.75 mi
Loading nearby amenities…
Taxation est. · year 1
- Rental income
- $11,512
- − Mortgage interest
- −$1,456
- − Property taxes
- −$390
- − Insurance
- −$130
- − Repairs & maintenance
- −$921
- − Management
- −$921
- − Depreciation
- −$756
- Taxable income
- $6,937
- Est. tax owed @ 24.0%
- −$1,665
- After-tax cash flow
- $5,273/yr
For passive investors: Depreciation is non-cash, so a rental often shows a tax loss while cash-flowing — sheltering income. Rental losses are passive: they offset passive income freely, and up to $25,000/yr can offset ordinary (W-2) income if you actively participate and your MAGI is under $100k (phasing out to $0 by $150k); unused losses carry forward. On sale, claimed depreciation is recaptured at up to 25%, and gains may owe capital-gains tax (a 1031 exchange can defer both). Figures are a year-1 estimate at your 24.0% rate — not tax advice; consult a CPA.
Schools (NCES district)
- District
- Quartzsite Elementary District (4511)
- NCES district ID
- 0406780
- Math proficiency
- 10% ▼ -10.00%
- Reading proficiency
- 20% ▼ -10.00%
- Median HH income
- $37,011
- Composite
- 15.96/100
- National rank
- #14309
- State rank
- #405 of 501 in AZ
Livability — Ehrenberg
- Score
- 65/100
- State rank
- #82
- US rank
- #13039
Category grades
Schools grade is shown separately in the Schools card above.
Census & demographics
- Census place
- Ehrenberg, AZ
- Population (ZIP)
- 946
Population outlook (La Paz County) Hauer SSP2
- Today (2025)
- 18,409 people
- By 2030
- 17,592 · -4.4%
- By 2040
- 16,600 · -9.8%
- By 2050
- 16,328 · -11.3%
- By 2075
- 17,075 · -7.2%
- By 2100
- 17,042 · -7.4%
Race, ethnicity, and origin ACS 2023
- Neighborhood character
- Predominantly White (69%)
- Race & ethnicity
- White 69% Hispanic / Latino 31% Two or more races 31%
- Hispanic origin (detail)
- Mexican 24%
- Common ancestry
- Scottish 5% Italian 3%
- Foreign-born
- 8% · Canada
- Languages at home
- 80% English-only · Spanish 20%
Political lean MEDSL · La Paz
- 2024 margin
- Solid R (+44.2) · D 27.6% · R 71.8%
- 2008→2024 swing
- -15.7pp toward R · 2008: -28.5pp · 2024: -44.2pp
- All cycles
- 2024: R+44.2 2020: R+38.8 2016: R+41.8 2012: R+32.2 2008: R+28.5
Not yet ingested
- Civics
- —
Market trends
- HPI YoY
- —
- Current HPI
- —
- Rent YoY
- —
- Metro
- —
- State GDP YoY
- ▲ 4.54%
- F500 in state
- 20
Industry mix (Fortune 500 HQ in AZ)
| Industry | F500 HQs | Revenue |
|---|---|---|
| Technology | 2 | $13B |
|
||
| Mining / Metals | 1 | $23B |
|
||
| Environmental Services | 1 | $16B |
|
||
| Metals / Steel | 1 | $14B |
|
||
| Technology Distribution | 1 | $9B |
|
||
| Homebuilding | 1 | $8B |
|
||
Price history
+18.2% since first listed2 events — show timeline
- 2025-12-26 Price Changed $26,000 LHAR
- 2025-09-27 Listed $22,000 LHAR
Cash-flow waterfall
monthlySold comps — $/sqft
last 12 mo · ≤1 miLoading sold comps…