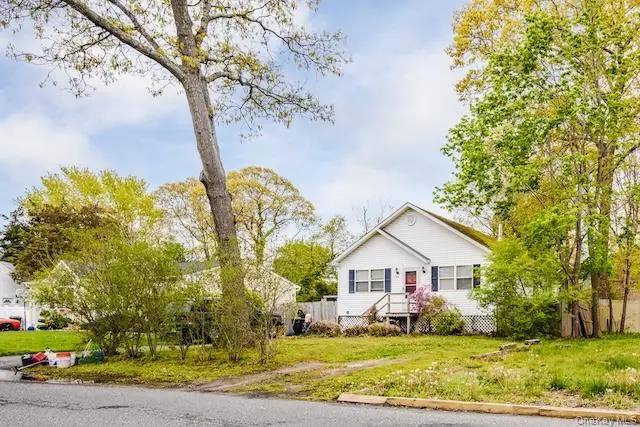
148 Wavecrest Dr · Mastic Beach, NY
Flood risk 1/10 · Minimal
- FEMA flood zone
- X (unshaded)
- Chance of flooding over 30 yrs
- 0.0%
- Est. flood insurance / yr
- $473 – $860
Fire risk 3/10 · Minor
- Est. fire insurance / yr
- $691 – $1,283
Heat risk 4/10 · Minor
- Hot days now (above 91°F)
- 7 days/yr
- Hot days in 30 yrs
- 19 days/yr
Wind risk 8/10 · Major
- Chance of severe wind over 30 yrs
- 80.0%
Air-quality risk 4/10 · Minor
- Unhealthy air days now
- 3 days/yr
- Unhealthy air days in 30 yrs
- 5 days/yr
Risk factors via First Street. Map © Google.
Why this score? — see what drove the C- grade
The composite is a weighted blend of 9 inputs, each scored 0–100. Each bar is that input's sub-score; the figure is the points it added to the 100-point composite (weight × sub-score).
- ARV discount +13.5/15.0
- Appreciation +10.0/10.0
- Cash flow +9.4/30.0
- Schools +4.7/10.0
- Livability +3.1/5.0
- 1% rule +3.0/10.0
- DSCR +2.6/10.0
- Rent growth +2.5/5.0
- Condition / age +2.5/5.0
$399,000
🖨 Deal sheet (PDF) 📄 Offer letter ✓ Due diligence
Listing remarks
This in-line ranch has three bedrooms and one bathroom. The big primary bedroom comes with a walk-in closet. You’ll love the wood floors all around and the newer appliances. The basement is partially finished, giving you a laundry area and some extra space to hang out. Plus, the fully fenced backyard is great for entertaining. It’s also super close to Osprey Park and Marina, making it a perfect spot to enjoy!
Key facts
- Wood floors
- Laundry area
- Walk-in closet
Tags
Property features AI
Exterior
- Parking: Driveway parking; On-street parking; Total parking for 2 vehicles
- Utilities: Electric service by PSEG; Cesspool sewer; Cable available; Electricity available; Water available
- Home design: Single family residence; Property condition listed as actual
- Construction: Vinyl siding construction
- Exterior features: Back yard; Vinyl siding; Not waterfront
Interior
- Kitchen: Dishwasher; Oven; Range; Refrigerator; Stainless steel appliances
- Bedrooms: Includes a bedroom on the first floor
- Flooring: Wood flooring
- Bathrooms: 1 full bathroom
- Heating & cooling: Baseboard heating; Hot water heating; Oil-fired heating; No central air conditioning
- Interior features: First-floor bedroom; Eat-in kitchen; Walk-in closet(s); Washer/dryer hookup; Dining area; Basement access with partially finished space and storage; Attic with pull-down stairs, storage, and unfinished areas
- Laundry & utility: Washer hookup; Electric dryer hookup; Washer/dryer hookup located in basement; Oil water heater
Neighborhood map
What this means for you Summary
Snapshot
- This is a 3-bed/1.0-bath single-family listed at $399k.
Deal economics
- At list price, monthly cash flow is $-284 ($-3k/yr) — negative.
- To cash-flow at today's rent, offer at most $349k (12.6% below list).
- To meet the 1% rule (rent ≥ 1% of price), the offer needs to be $319k (20.0% below list).
- Recommended offer: $319k (20.0% below list) — sets the bar for 1% rule.
Location & tenants
- Location reads 61/100 on livability (#936 in NY) — a middle-class / working-renter tenant base. Strengths: employment A+, housing A+; Watch: crime D, amenities F, commute F.
- William Floyd Union Free School District (suburban): math 48% / reading 57% proficiency, ranked #309 of 590 in NY (top 52%) — acceptable for families but not a draw, mixed tenant base, ~2y average lease.
- Zoned schools: Tangier Smith Elementary School (math 43% / reading 54%, grade D, #1,181 of 2,108 statewide, top 56%, 755 students, 61% FRL); William Paca Middle School (math 31% / reading 37%, grade F, #497 of 729 statewide, top 69%, 1,009 students, 59% FRL); William Floyd High School (math 65% / reading 87%, grade A-, #616 of 1,100 statewide, top 57%, 3,013 students, 54% FRL) — zoned schools average 58% FRL vs 43% district-wide (15 pts higher); higher-poverty schools than district average — tighter screening recommended.
- Market conditions: 137 active listings in the ZIP; 2 comparable units currently listed for rent nearby; 1,366 units permitted in Suffolk County in 2024 (216 in 5+ unit buildings).
Forward outlook
- In year one you build about $43k of equity ($3k loan paydown + $40k appreciation (10.0% local appreciation)).
- Suffolk County population projected to shrink 5% by 2050 — rents likely to lag national; underwrite the cash flow, not the appreciation.
- By year 2, paydown + projected appreciation supports a ~$69k cash-out refi (75% LTV) — recoverable capital for the next deal without selling this one.
Negotiation context
- It's been on market 40 days — a 3% lower offer ($387k) is reasonable based on typical stale-listing flexibility.
- Current owner paid $299k; 33% above their basis — modest negotiation headroom, anchor on the comps not their cost.
Risks & watch-outs
- Climate carrying-cost: severe wind risk, 80% chance of damaging wind over 30y — expect insurance premiums to compound above CPI over the hold.
Questions for the listing agent
- What do current leases actually rent for vs. the listed asking? Can we see a recent rent roll and the last 12 months of T-12 income?
- It's been on market 40 days. Have you received any prior offers? Is the seller open to a 20% concession, seller financing, or rate buy-down credit?
- Is there a deadline driving the sale (1031 exchange, divorce, estate, relocation)? That informs how much negotiation room exists.
- Schools are D-rated, which usually means shorter tenancies and higher turnover. Who's the typical renter profile here, and what's been the actual vacancy rate?
- Crime grade is D in this area — have there been break-ins, vandalism, or insurance claims at this property in the last 3 years? What carrier currently insures it and at what premium?
- What's the average days-on-market for RENTAL listings here right now (not sales)? A rising rental-DOM trend means longer vacancies and softer asking-rent achievability than the comps imply.
- What's the recent tenant-quality profile in this submarket — average credit score on applications, eviction rate, late-payment / NSF rate, and stable-employment percentage? A property-management company in the area should have these aggregated.
- How much new for-sale + rental construction is in the pipeline within 1–3 miles? Heavy new supply typically softens prices + rents 12–24 months out; constrained supply supports both.
Investment metrics
- 1% rule
- 0.80% ✗
- Cap rate
- 5.44%
- Cash-on-cash
- -3.05%
- DSCR
- 0.86
- GRM
- 10.4
CMA / ARV
- ARV (median comp)
- $460,339
- List price
- $399,000
- Delta
- -13.32%
- Verdict
- UNDERPRICED
- Comps
- 20 within 1.0 mi
Show comp detail 12 sales within ~0.75 mi
| Address | Dist | Beds/Ba | Sqft | Sold | Price | $/sf | Match |
|---|---|---|---|---|---|---|---|
| 77 Spar Dr | 0.21mi | 3/1.0 | 996 (+1%) | 4mo | $425,000 | $427 | 85 |
| 8 Lonscreek Pl | 0.15mi | 2/1.0 (-1) | 948 (-4%) | 13mo | $427,000 | $450 | 71 |
| 49 Shore Dr | 0.42mi | 3/2.0 | 969 (-2%) | 5mo | $389,000 | $401 | 70 |
| 70 Spar Dr | 0.26mi | 3/1.0 | 1,064 (+8%) | 6mo | $440,000 | $414 | 70 |
| 129 Lakeview Dr | 0.73mi | 3/1.0 | 954 (-3%) | 1mo | $515,000 | $540 | 60 |
| 44 Edgewater Dr | 0.42mi | 3/1.0 | 1,078 (+9%) | 8mo | $420,000 | $390 | 58 |
| 9 Claremont Dr | 0.39mi | 3/1.0 | 1,075 (+9%) | 11mo | $440,000 | $409 | 58 |
| 15 Shore Dr | 0.53mi | 3/2.0 | 1,050 (+6%) | 4mo | $507,500 | $483 | 57 |
| 57 Shore Dr | 0.37mi | 3/1.0 | 1,110 (+13%) | 7mo | $240,000 | $216 | 56 |
| 56 Stackyard Dr | 0.57mi | 2/1.0 (-1) | 920 (-7%) | 9mo | $325,000 | $353 | 49 |
| 8 Spar Dr | 0.55mi | 3/1.5 | 1,074 (+9%) | 13mo | $430,000 | $400 | 47 |
| 5 Vine Rd | 0.64mi | 3/1.0 | 840 (-15%) | 12mo | $383,000 | $456 | 35 |
Match score weights: distance 35% · size 25% · config 20% · recency 20%. Top-matched comps best support the ARV.
Projected returns pro-forma
10.0% appreciation · 3.0% rent growth · sell at horizon
- IRR
- 22.1%
- Equity multiple
- 2.78×
- Total profit
- $199,279
- Equity at exit
- $359,451
- IRR
- 19.9%
- Equity multiple
- 6.38×
- Total profit
- $601,234
- Equity at exit
- $775,169
Cash invested: $111,720 (down + closing). Projections, not guarantees.
Landlord ↔ Tenant lean methodology
- Overall (STATE)
- 15 Strongly Tenant-Friendly
- State New York
- 15 Strongly Tenant-Friendly · D+10
- County
- — inherits STATE
- City
- — inherits STATE
ZIP-level market 11951
- Home prices YoY
- 4.3%
- Active inventory
- 137
- Price-to-rent
- 10.4×
Monthly cashflow live
- Estimated rent
- $3,190 medium interval (Pro) →
- Mortgage (P&I)
- −$2,092
- Tax from tax record
- −$546 /mo · $6,551/yr
- Insurance
- −$166
- HOA
- −$0
- Vacancy / Maint / Mgmt
- −$670
- Net cashflow
- $-284
Break-even live
Sensitivity live
| Price | -10% $-58 | -5% $-171 | +0% $-284 | +5% $-397 | +10% $-510 |
|---|---|---|---|---|---|
| Rent | -10% $-536 | -5% $-410 | +0% $-284 | +5% $-158 | +10% $-32 |
| Rate | -1.0pp $-83 | -0.5pp $-183 | base $-284 | +0.5pp $-388 | +1.0pp $-493 |
UW: 25.0% down · 7.5% · 30yr · 1.5% tax · 5.0% vac · 8.0% maint · 8.0% mgmt
Financing live
Cash to close
- Down payment
- $99,750
- Closing costs
- $11,970
- Reserves months
- —
- Total cash needed
- —
Loan-product check · same deal, 3 products live
Conventional
25% down · 7.5% · 30yr
- Down + closing
- —
- Monthly P&I
- —
- Monthly cashflow
- —
- DSCR
- —
- Eligible?
- —
Personal DTI + credit; lowest rate.
DSCR
20% down · 8.5% · 30yr
- Down + closing
- —
- Monthly P&I
- —
- Monthly cashflow
- —
- DSCR
- —
- Eligible?
- —
No personal income docs; deal must DSCR.
Hard money
10% down · 12.0% · 12mo
- Down + closing
- —
- Monthly P&I
- —
- Monthly cashflow
- —
- DSCR
- —
- Eligible?
- —
Short-term bridge; refi at stabilization.
Rent comps 2 comps
| Address | Beds | Baths | Sqft | Rent | $/sqft | DOM | Units | Dist |
|---|---|---|---|---|---|---|---|---|
| 5 Cedar Rd E Mastic Beach, NY | 3.0 | 1.0 | 740 | $2,900 | $3.92 | 0d | 1 | 0.82mi |
| 48 Eleanor Ave Mastic, NY | 3.0 | 1.0 | 975 | $3,500 | $3.59 | 26d | 1 | 1.15mi |
Listing history 20 events
-
2026-06-22days on market $399,000 Active 40 DOM
-
2026-06-21days on market $399,000 Active 39 DOM
-
2026-06-18days on market $399,000 Active 36 DOM
-
2026-06-17days on market $399,000 Active 35 DOM
-
2026-06-16days on market $399,000 Active 34 DOM
-
2026-06-15days on market $399,000 Active 33 DOM
-
2026-06-13days on market $399,000 Active 31 DOM
-
2026-06-13days on market $399,000 Active 30 DOM
-
2026-06-09days on market $399,000 Active 27 DOM
-
2026-06-08days on market $399,000 Active 26 DOM
-
2026-06-07days on market $399,000 Active 25 DOM
-
2026-06-04days on market $399,000 Active 22 DOM
-
2026-06-03days on market $399,000 Active 21 DOM
-
2026-06-02days on market $399,000 Active 20 DOM
-
2026-06-01days on market $399,000 Active 19 DOM
-
2026-05-31days on market $399,000 Active 18 DOM
-
2026-04-28$399,000 Active 424-char remark
-
2005-08-01soldstatus $298,920
-
2004-04-02soldstatus $232,500
-
1995-12-19soldstatus $11,000
ⓘ Source: listings_history table (triggers on properties + properties_extension) + one-shot
backfill from property_details.listing_events for pre-trigger history.
Tax reassessment forecast NY · Partial reset (capped growth)
- Current annual tax
- $6,551 · $546/mo
- Projected year-2 tax
- $6,647 · $554/mo
- Expected delta
- +$96/yr (+$8/mo · 1.5%)
ⓘ Screening estimate from a state-policy table — verify with the county assessor before closing.
Climate risk First Street
- Flood 1/10 Low FEMA zone X (unshaded) · 0% chance over 30 yrs
- Wildfire 3/10 Moderate
- Heat 4/10 Moderate 7 d/yr ≥91°F today · 19 d/yr by 30 yrs out
- Wind 8/10 Severe 80% chance of damaging wind over 30 yrs
- Air quality 4/10 Moderate 3 unhealthy d/yr today · 5 by 30 yrs out
Nearby sold comps map
Loading sold comps map…
Walkable amenities ~0.75 mi
Loading nearby amenities…
Taxation est. · year 1
- Rental income
- $38,283
- − Mortgage interest
- −$22,350
- − Property taxes
- −$6,551
- − Insurance
- −$1,995
- − Repairs & maintenance
- −$3,063
- − Management
- −$3,063
- − Depreciation
- −$11,607
- Taxable loss
- −$10,346
- Est. tax savings @ 24.0%
- +$2,483
- After-tax cash flow
- $-928/yr
For passive investors: Depreciation is non-cash, so a rental often shows a tax loss while cash-flowing — sheltering income. Rental losses are passive: they offset passive income freely, and up to $25,000/yr can offset ordinary (W-2) income if you actively participate and your MAGI is under $100k (phasing out to $0 by $150k); unused losses carry forward. On sale, claimed depreciation is recaptured at up to 25%, and gains may owe capital-gains tax (a 1031 exchange can defer both). Figures are a year-1 estimate at your 24.0% rate — not tax advice; consult a CPA.
Schools (NCES district)
- District
- William Floyd Union Free School District
- NCES district ID
- 3618690
- Math proficiency
- 48% ▲ 3.00%
- Reading proficiency
- 57% ▲ 11.00%
- Median HH income
- $70,564
- Composite
- 46.79/100
- National rank
- #2383
- State rank
- #309 of 590 in NY
Livability — Mastic Beach
- Score
- 61/100
- State rank
- #936
- US rank
- #18216
Category grades
Schools grade is shown separately in the Schools card above.
Census & demographics
- Census place
- Mastic Beach, NY
- City population
- 15,830
- Population (ZIP)
- 15,830
Population outlook (Suffolk County) Hauer SSP2
- Today (2025)
- 1,505,262 people
- By 2030
- 1,498,318 · -0.5%
- By 2040
- 1,471,101 · -2.3%
- By 2050
- 1,424,848 · -5.3%
- By 2075
- 1,337,157 · -11.2%
- By 2100
- 1,217,720 · -19.1%
Race, ethnicity, and origin ACS 2023
- Neighborhood character
- Predominantly White (68%)
- Race & ethnicity
- White 68% Hispanic / Latino 17% Two or more races 9% Black 6% Asian 2%
- Hispanic origin (detail)
- Mexican 1% Puerto Rican 6% Cuban 2%
- Common ancestry
- Lithuanian 3% Romanian 2% Italian 2%
- Foreign-born
- 7% · Canada, Vietnam
- Languages at home
- 84% English-only · Spanish 10% Other Indo-European 3% Chinese 1%
Political lean MEDSL · Suffolk
- 2024 margin
- Lean R (+10.0) · D 45.0% · R 55.0%
- 2008→2024 swing
- -16.0pp toward R · 2008: 6.0pp · 2024: -10.0pp
- All cycles
- 2024: R+10.0 2020: R+0.0 2016: R+8.2 2012: D+2.9 2008: D+6.0
Not yet ingested
- Civics
- —
Market trends
- HPI YoY
- ▲ 34.46%
- Current HPI
- 829.86
- Rent YoY
- —
- Metro
- —
- State GDP YoY
- ▲ 2.60%
- F500 in state
- 92
Industry mix (Fortune 500 HQ in NY)
| Industry | F500 HQs | Revenue |
|---|---|---|
| Financial Services | 10 | $950B |
|
||
| Consumer Goods | 9 | $162B |
|
||
| Insurance | 4 | $225B |
|
||
| Telecommunications | 2 | $144B |
|
||
| Pharmaceuticals | 2 | $112B |
|
||
| Media / Entertainment | 2 | $69B |
|
||
Price history
+3527.3% since first listed4 events — show timeline
- 2026-04-28 Listed $399,000 OneKey® MLS as Distributed by MLS Grid
- 2005-08-01 Sold (Public Records) $298,920 Public Records
- 2004-04-02 Sold (Public Records) $232,500 Public Records
- 1995-12-19 Sold (Public Records) $11,000 Public Records
Property tax history
+0.9%/yrLatest (2025): $6,551 · +0.0% YoY. Source: county tax records.
Cash-flow waterfall
monthlySold comps — $/sqft
last 12 mo · ≤1 miLoading sold comps…