4515 W Bancroft St · Toledo, OH
Flood risk 1/10 · Minimal
- FEMA flood zone
- X (unshaded)
- Chance of flooding over 30 yrs
- 0.0%
- Est. flood insurance / yr
- $473 – $860
Fire risk 1/10 · Minimal
- Est. fire insurance / yr
- $713 – $1,323
Heat risk 3/10 · Minor
- Hot days now (above 100°F)
- 7 days/yr
- Hot days in 30 yrs
- 16 days/yr
Wind risk 2/10 · Minimal
- Chance of severe wind over 30 yrs
- —
Air-quality risk 2/10 · Minimal
- Unhealthy air days now
- 1 days/yr
- Unhealthy air days in 30 yrs
- 3 days/yr
Risk factors via First Street. Map © Google.
Why this score? — see what drove the D+ grade
The composite is a weighted blend of 9 inputs, each scored 0–100. Each bar is that input's sub-score; the figure is the points it added to the 100-point composite (weight × sub-score).
- Cash flow +19.8/30.0
- ARV discount +7.5/15.0
- DSCR +6.3/10.0
- 1% rule +5.3/10.0
- Livability +3.3/5.0
- Rent growth +3.1/5.0
- Condition / age +2.5/5.0
- Schools +1.6/10.0
- Appreciation +0.0/10.0
$124,900
🖨 Deal sheet (PDF) 📄 Offer letter ✓ Due diligence
Listing remarks MLS
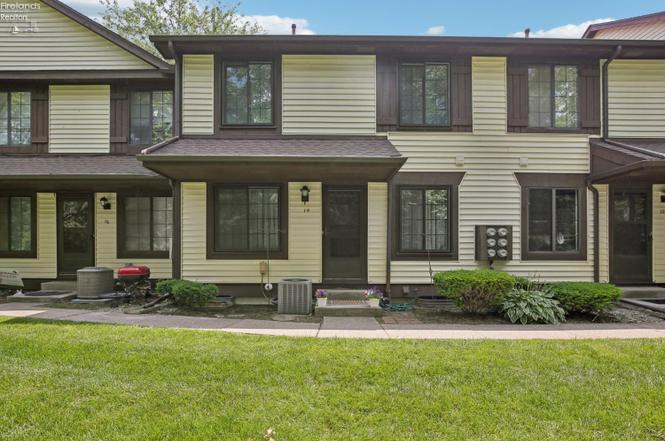
Welcome to this charming 2-bedroom, 1.5-bath condo in the sought-after Ottawa Woods Condominiums, just minutes from the University of Toledo. Boasting 880 sq ft of thoughtfully laid out living space with a finished basement. Recently renovated both bathrooms, new paint and flooring throughout! The home features central air, a private entrance, and covered parking with an assigned carport. Enjoy easy access to the community's sparkling in-ground pool, serene green spaces, and the University, Parks biking/walking trail. With lawn, exterior, pool, water/sewer and trash service all managed by the HOA, this condo delivers low-maintenance living, ideal for students, professionals, or anyone seeking convenience near shops, schools, and expressways. Whether you're starting out or looking to downsize, this condo blends comfort, community amenities, and a prime location. Don't miss your chance, schedule a showing today!
Key facts
- New furnace
- Bike trail
- Covered parking
Tags
Property features AI
Exterior
- Home design: Built in 1981
- Construction: 1981 construction
- Exterior features: Located in the Reynolds Corners subdivision
Neighborhood map
What this means for you Summary
Snapshot
- This is a 2-bed/2.0-bath condo listed at $125k.
Deal economics
- At list price, monthly cash flow is $149 ($2k/yr) — positive.
- The deal already cash-flows at list — no discount required.
- Meets the 1% rule at list price ($1k rent vs $125k).
Location & tenants
- Location reads 66/100 on livability (#645 in OH) — a middle-class / working-renter tenant base. Strengths: cost of living A+, housing A+, health & safety A+; Watch: amenities C-, crime F, commute F.
- Toledo City (urban): math 15% / reading 24% proficiency, ranked #634 of 656 in OH (top 97%) — low school quality limits family demand, transient renter base, plan for 1-2y turnover; 72% free/reduced lunch — lower-income household profile, screen leases tightly.
- Zoned schools: Grove Patterson Academy Elementary School (math 47% / reading 66%, grade C+, #761 of 1,584 statewide, top 48%, 403 students, 38% FRL); Rogers High School (math 8% / reading 27%, grade F, #689 of 781 statewide, top 90%, 721 students, 0% FRL) — zoned schools average 19% FRL vs 72% district-wide (53 pts lower); this property's tenant base skews higher-income than the district average.
- Zoned-school proficiency averages 37% at this address vs 20% district-wide (+17 pts) — the actual schools serving this property are materially stronger than the Toledo City average implies; a family-tenant draw the district grade alone would hide.
- Market conditions: Rents rising (+2.6%/yr); 115 active listings in the ZIP; 12 comparable units currently listed for rent nearby; rentals at typical pace (median 25d on market — plan ~3-4 weeks tenant-placement turnaround); 415 units permitted in Lucas County in 2024 (122 in 5+ unit buildings).
Forward outlook
- Local home prices are declining (-3.0%/yr); year-one equity from $864 of loan paydown is wiped out by about $4k of value loss. Plan a longer hold.
- Lucas County population projected at -16% by 2050 — secular population decline; favor cash flow + early exit over multi-decade hold.
Negotiation context
- Only 4 days on market — expect competitive offers; lowballing is unlikely to land.
- 4 sale attempts since 19y ago with the ask held roughly flat each time — persistent listings suggest the price (not the market) is what's stuck; bring a comps-based counter.
Questions for the listing agent
- Any open or pending special assessments — roof, HVAC, plumbing, elevator, façade? What's the per-unit balance and payoff schedule, and is the seller paying it off at close or rolling it to the buyer?
- Is there a deadline driving the sale (1031 exchange, divorce, estate, relocation)? That informs how much negotiation room exists.
- Schools are D-rated, which usually means shorter tenancies and higher turnover. Who's the typical renter profile here, and what's been the actual vacancy rate?
- Crime grade is F in this area — have there been break-ins, vandalism, or insurance claims at this property in the last 3 years? What carrier currently insures it and at what premium?
- The area grade is low — what's the realistic commute time and amenity access for the typical tenant pool here? Any planned neighborhood developments (good or bad) we should know about?
- What's the average days-on-market for RENTAL listings here right now (not sales)? A rising rental-DOM trend means longer vacancies and softer asking-rent achievability than the comps imply.
- What's the recent tenant-quality profile in this submarket — average credit score on applications, eviction rate, late-payment / NSF rate, and stable-employment percentage? A property-management company in the area should have these aggregated.
- How much new apartment / multifamily construction is in the pipeline within 1–3 miles? Heavy new supply (>2% of stock underway) typically softens rents 12–24 months out; light construction supports rent growth.
Investment metrics
- 1% rule
- 1.03% ✓
- Cap rate
- 7.72%
- Cash-on-cash
- 5.10%
- DSCR
- 1.23
- GRM
- 8.1
CMA / ARV
No comps found within radius.
Projected returns pro-forma
-3.0% appreciation · 2.59% rent growth · sell at horizon
- IRR
- -8.8%
- Equity multiple
- 0.68×
- Total profit
- $-11,284
- Equity at exit
- $18,623
- IRR
- 0.1%
- Equity multiple
- 1.01×
- Total profit
- $294
- Equity at exit
- $10,799
Cash invested: $34,972 (down + closing). Projections, not guarantees.
Landlord ↔ Tenant lean methodology
- Overall (STATE)
- 73 Landlord-Friendly
- State Ohio
- 73 Landlord-Friendly · R+6
- County
- — inherits STATE
- City
- — inherits STATE
ZIP-level market 43615
- Home prices YoY
- -31.9%
- Rents YoY
- 2.6%
- Active inventory
- 115
- Price-to-rent
- 8.1×
Monthly cashflow live
- Estimated rent
- $1,281 high interval (Pro) →
- Mortgage (P&I)
- −$655
- Tax est. 1.5%
- −$156 /mo · $1,874/yr
- Insurance
- −$52
- HOA
- −$0
- Vacancy / Maint / Mgmt
- −$269
- Net cashflow
- $149
Break-even live
Sensitivity live
| Price | -10% $235 | -5% $192 | +0% $149 | +5% $105 | +10% $62 |
|---|---|---|---|---|---|
| Rent | -10% $47 | -5% $98 | +0% $149 | +5% $199 | +10% $250 |
| Rate | -1.0pp $211 | -0.5pp $180 | base $149 | +0.5pp $116 | +1.0pp $83 |
UW: 25.0% down · 7.5% · 30yr · 1.5% tax · 5.0% vac · 8.0% maint · 8.0% mgmt
Financing live
Cash to close
- Down payment
- $31,225
- Closing costs
- $3,747
- Reserves months
- —
- Total cash needed
- —
Loan-product check · same deal, 3 products live
Conventional
25% down · 7.5% · 30yr
- Down + closing
- —
- Monthly P&I
- —
- Monthly cashflow
- —
- DSCR
- —
- Eligible?
- —
Personal DTI + credit; lowest rate.
DSCR
20% down · 8.5% · 30yr
- Down + closing
- —
- Monthly P&I
- —
- Monthly cashflow
- —
- DSCR
- —
- Eligible?
- —
No personal income docs; deal must DSCR.
Hard money
10% down · 12.0% · 12mo
- Down + closing
- —
- Monthly P&I
- —
- Monthly cashflow
- —
- DSCR
- —
- Eligible?
- —
Short-term bridge; refi at stabilization.
Rent comps 12 comps
| Address | Beds | Baths | Sqft | Rent | $/sqft | DOM | Units | Dist |
|---|---|---|---|---|---|---|---|---|
| 4515 W Bancroft St Toledo, OH | 3.0 | 2.0 | 1120 | $1,500 | $1.34 | 15d | 1 | 0.02mi |
| 4020 W Bancroft St Ottawa Hills, OH | 1.0 | 1.0 | 720 | $775 | $1.08 | 45d | 1 | 0.56mi |
| 4012 W Bancroft St Ottawa Hills, OH | 2.0 | 1.0 | 1008 | $972 | $0.96 | 25d | 1 | 0.57mi |
| 1599 Twin Oaks Dr Toledo, OH | 2.0 | 1.0 | 864 | $976 | $1.13 | 15d | 1 | 0.73mi |
| 1130 Pine Valley Ln Toledo, OH | 1.0–2.0 | 1.0–2.0 | 799 | $1,299 | $1.63 | 15d | 6 | 0.78mi |
| 1169 Shadow Ln Unit 103 Toledo, OH | 1.0 | 1.0 | 975 | $849 | $0.87 | 25d | 1 | 0.84mi |
| 1101 Linden Ln Toledo, OH | 1.0–2.0 | 1.0–2.0 | 975 | $1,345 | $1.38 | 45d | 4 | 0.87mi |
| 1318 Montain Rd Toledo, OH | 2.0 | 1.0 | 1050 | $1,195 | $1.14 | 22d | 1 | 0.94mi |
| 4239 Central Ave Ottawa Hills, OH | 2.0 | 2.0 | 1108 | $1,799 | $1.62 | 45d | 1 | 1.07mi |
| 2704 Westmar Ct Toledo, OH | 1.0–2.0 | 1.0–1.5 | 944 | $1,599 | $1.69 | 15d | 1 | 1.19mi |
| 5460 Dorr St Toledo, OH | 1.0–2.0 | 1.0 | 553 | $710 | $1.28 | 45d | 1 | 1.22mi |
| 3414 Dorr St Toledo, OH | 1.0–2.0 | 1.0–1.5 | 570 | $825 | $1.45 | 25d | 5 | 1.44mi |
HOA detail condo
- Monthly dues
- $0 · $0/yr
- Likely covers
- watersewertrashpool
- Assessments
- None detected in remarks — confirm with the listing agent.
Listing history 3 events
-
2026-06-21days on market $124,900 Active 4 DOM
-
2026-06-18remarks 699-char remark
-
2026-06-18$124,900 Active 1 DOM
ⓘ Source: listings_history table (triggers on properties + properties_extension) + one-shot
backfill from property_details.listing_events for pre-trigger history.
Climate risk First Street
- Flood 1/10 Low FEMA zone X (unshaded) · 0% chance over 30 yrs
- Wildfire 1/10 Low
- Heat 3/10 Moderate 7 d/yr ≥100°F today · 16 d/yr by 30 yrs out
- Wind 2/10 Low
- Air quality 2/10 Low 1 unhealthy d/yr today · 3 by 30 yrs out
Nearby sold comps map
Loading sold comps map…
Walkable amenities ~0.75 mi
Loading nearby amenities…
Taxation est. · year 1
- Rental income
- $15,368
- − Mortgage interest
- −$6,996
- − Property taxes
- −$1,874
- − Insurance
- −$624
- − Repairs & maintenance
- −$1,229
- − Management
- −$1,229
- − Depreciation
- −$3,633
- Taxable loss
- −$219
- Est. tax savings @ 24.0%
- +$53
- After-tax cash flow
- $1,835/yr
For passive investors: Depreciation is non-cash, so a rental often shows a tax loss while cash-flowing — sheltering income. Rental losses are passive: they offset passive income freely, and up to $25,000/yr can offset ordinary (W-2) income if you actively participate and your MAGI is under $100k (phasing out to $0 by $150k); unused losses carry forward. On sale, claimed depreciation is recaptured at up to 25%, and gains may owe capital-gains tax (a 1031 exchange can defer both). Figures are a year-1 estimate at your 24.0% rate — not tax advice; consult a CPA.
Schools (NCES district)
- District
- Toledo City
- NCES district ID
- 3904490
- Math proficiency
- 15% ▼ -16.00%
- Reading proficiency
- 24% ▼ -13.00%
- Median HH income
- $32,137
- Composite
- 15.76/100
- National rank
- #9276
- State rank
- #634 of 656 in OH
Livability — Toledo
- Score
- 66/100
- State rank
- #645
- US rank
- #11442
Category grades
Schools grade is shown separately in the Schools card above.
Census & demographics
- Census place
- Toledo, OH
- County
- Lucas County · 380,724 people
- City population
- 280,811
- Metro
- Toledo, OH
- Population (ZIP)
- 40,146
- Household income
- $57,713
- Rent vs Own
- Severe rent burden
- 1683.0
Population outlook (Lucas County) Hauer SSP2
- Today (2025)
- 420,751 people
- By 2030
- 410,187 · -2.5%
- By 2040
- 384,019 · -8.7%
- By 2050
- 355,125 · -15.6%
- By 2075
- 291,683 · -30.7%
- By 2100
- 233,670 · -44.5%
Race, ethnicity, and origin ACS 2023
- Neighborhood character
- Majority White (62%)
- Race & ethnicity
- White 62% Black 26% Two or more races 6% Hispanic / Latino 4% Asian 3%
- Common ancestry
- Romanian 7% Lithuanian 3% Slovak 2%
- Foreign-born
- 5% · China, Canada
- Languages at home
- 93% English-only · Arabic 2% Spanish 1% Chinese 1%
Political lean MEDSL · Lucas
- 2024 margin
- D (+12.6) · D 55.8% · R 43.2%
- 2008→2024 swing
- -18.9pp toward R · 2008: 31.4pp · 2024: 12.6pp
- All cycles
- 2024: D+12.6 2020: D+16.8 2016: D+17.4 2012: D+30.4 2008: D+31.4
Not yet ingested
- Civics
- —
Market trends
- HPI YoY
- ▼ -96.44%
- Current HPI
- 205.95
- Rent YoY
- ▲ 2.59%
- Metro
- Toledo, OH
- State GDP YoY
- ▲ 1.98%
- F500 in state
- 48
Industry mix (Fortune 500 HQ in OH)
| Industry | F500 HQs | Revenue |
|---|---|---|
| Insurance | 3 | $145B |
|
||
| Industrial Machinery | 3 | $49B |
|
||
| Financial Services | 3 | $24B |
|
||
| Consumer Goods | 2 | $93B |
|
||
| Aerospace / Defense | 2 | $47B |
|
||
| Utilities | 2 | $33B |
|
||
Price history
+52.3% since first listed9 events — show timeline
- 2026-06-18 Listed $124,900 FSBO.com
- 2026-03-08 Listed for Rent $1,500 RENTALBEAST
- 2025-07-13 Pending — FAOR
- 2025-07-11 Sold (MLS) $119,350 FAOR
- 2025-07-01 Contingent — FAOR
- 2025-06-28 Listed $115,000 FAOR
- 2025-06-24 Coming Soon $115,000 FAOR
- 2008-03-31 Listing Removed — NORIS
- 2007-09-28 Listed $82,000 NORIS
Cash-flow waterfall
monthlySold comps — $/sqft
last 12 mo · ≤1 miLoading sold comps…