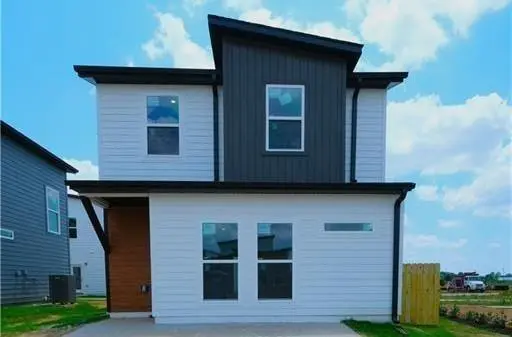
921 Ventnor Ave · Centerton, AR
Flood risk 1/10 · Minimal
- FEMA flood zone
- X (unshaded)
- Chance of flooding over 30 yrs
- 0.0%
- Est. flood insurance / yr
- $507 – $1,088
Fire risk 5/10 · Moderate
- Est. fire insurance / yr
- $1,499 – $2,785
Heat risk 5/10 · Moderate
- Hot days now (above 105°F)
- 7 days/yr
- Hot days in 30 yrs
- 18 days/yr
Wind risk 2/10 · Minimal
- Chance of severe wind over 30 yrs
- 4.0%
Air-quality risk 2/10 · Minimal
- Unhealthy air days now
- 0 days/yr
- Unhealthy air days in 30 yrs
- 1 days/yr
Risk factors via First Street. Map © Google.
Why this score? — see what drove the D grade
The composite is a weighted blend of 9 inputs, each scored 0–100. Each bar is that input's sub-score; the figure is the points it added to the 100-point composite (weight × sub-score).
- ARV discount +9.4/15.0
- Cash flow +8.0/30.0
- Schools +5.2/10.0
- Appreciation +4.6/10.0
- Livability +3.9/5.0
- Rent growth +2.7/5.0
- 1% rule +2.5/10.0
- Condition / age +2.5/5.0
- DSCR +2.1/10.0
$215,000
🖨 Deal sheet 📄 Offer letter ✓ Due diligence
Listing remarks MLS
Wonderful new subdivision in Bentonville School District. Less than 5 miles from Walmart Corporate office. Come enjoy simplified living in a modern environment. Future park and walking trails throughout neighborhood. Schedule a showing today!
Key facts
- 3,049 sq ft lot
- Built 2023
- Listed 28 days
Property features AI
Finance
- HOA & community: Monthly HOA/association fee
Exterior
- Parking: Concrete driveway
- Security: Smoke detectors
- Utilities: Electricity available; Public water; Sewer available
- Home design: Two-story residence; Resale property (built within last 25 years)
- Construction: Vinyl siding; Architectural shingle roof; Built on a slab foundation
- Exterior features: Concrete driveway; Located in a subdivision; Public road frontage
Interior
- Kitchen: Dishwasher; Electric oven and range; Microwave; Garbage disposal; Refrigerator; Plumbed for ice maker; Granite countertops
- Bedrooms: Bedrooms located on multiple levels
- Flooring: Carpet; Luxury vinyl plank
- Bathrooms: 2 full bathrooms; 1 half bathroom
- Heating & cooling: Central heating (electric); Central air conditioning (electric)
- Interior features: Ceiling fans; Granite counters; Walk-in closets; Window treatments and blinds
- Laundry & utility: Washer hookup; Dryer hookup; Electric water heater
Neighborhood map
What this means for you Summary
Snapshot
- This is a 2-bed/2.5-bath single-family listed at $215k.
Deal economics
- At list price, monthly cash flow is $-217 ($-3k/yr) — negative.
- To cash-flow at today's rent, offer at most $184k (14.6% below list).
- To meet the 1% rule (rent ≥ 1% of price), the offer needs to be $161k (25.3% below list).
- Recommended offer: $161k (25.3% below list) — sets the bar for 1% rule.
- Cap rate 5.1% vs local median 2.9% in Centerton — top-decile yield for the area; either an underpriced asset or a hidden risk that comps aren't pricing in. Stress-test before assuming the spread holds.
Location & tenants
- Location reads 77/100 on livability (#11 in AR, #3,194 nationally) — a middle-class / working-renter tenant base. Strengths: crime A+, employment A+, cost of living A+; Watch: amenities F, commute F.
- Bentonville School District (urban): math 59% / reading 59% proficiency, ranked #3 of 238 in AR (top 1%) — acceptable for families but not a draw, mixed tenant base, ~2y average lease.
- Market conditions: Rents flat; 458 active listings in the ZIP; 40 comparable units currently listed for rent nearby; rentals at typical pace (median 24d on market — plan ~3-4 weeks tenant-placement turnaround); high-income renter base; 4,359 units permitted in Benton County in 2024 (402 in 5+ unit buildings).
- This rent is only 17% of the median local income ($114k/yr) — well below the 30% rent-burden line; pricing power to push rent on renewal without tenant pushback.
Forward outlook
- Local home prices are declining (-0.9%/yr); year-one equity from $1k of loan paydown is wiped out by about $2k of value loss. Plan a longer hold.
- Benton County population projected at +56% by 2050 — long-run rental-demand tailwind backs the buy-and-hold thesis.
Negotiation context
- It's been on market 28 days — a 2% lower offer ($212k) is reasonable based on typical stale-listing flexibility.
- 5 sale attempts since 3y ago with the ask held roughly flat each time — persistent listings suggest the price (not the market) is what's stuck; bring a comps-based counter.
Risks & watch-outs
- Climate carrying-cost: moderate wildfire risk; extreme-heat days projected 7→18/yr by 2055 (HVAC capex compounding) — expect insurance premiums to compound above CPI over the hold.
Questions for the listing agent
- What do current leases actually rent for vs. the listed asking? Can we see a recent rent roll and the last 12 months of T-12 income?
- Is there a deadline driving the sale (1031 exchange, divorce, estate, relocation)? That informs how much negotiation room exists.
- Schools are B-rated — typically a magnet for longer-tenancy family renters. What's the average tenant stay here, and is there a school-zone premium baked into asking?
- The area grade is low — what's the realistic commute time and amenity access for the typical tenant pool here? Any planned neighborhood developments (good or bad) we should know about?
- What's the average days-on-market for RENTAL listings here right now (not sales)? A rising rental-DOM trend means longer vacancies and softer asking-rent achievability than the comps imply.
- What's the recent tenant-quality profile in this submarket — average credit score on applications, eviction rate, late-payment / NSF rate, and stable-employment percentage? A property-management company in the area should have these aggregated.
- How much new for-sale + rental construction is in the pipeline within 1–3 miles? Heavy new supply typically softens prices + rents 12–24 months out; constrained supply supports both.
Investment metrics
- 1% rule
- 0.75% ✗
- Cap rate
- 5.08%
- Cash-on-cash
- -4.32%
- DSCR
- 0.81
- GRM
- 11.2
CMA / ARV
- ARV (on-the-fly)
- $224,400
- Comps found
- 12
Show comp detail 12 sales within ~0.75 mi
| Address | Dist | Beds/Ba | Sqft | Sold | Price | $/sf | Match |
|---|---|---|---|---|---|---|---|
| 651 St Charles Pl | 0.11mi | 2/2.5 | 1,100 (0%) | 2mo | $229,700 | $209 | 93 |
| 651 Apollo Ave | 0.18mi | 2/2.5 | 1,100 (0%) | 1mo | $224,085 | $204 | 91 |
| 570 Solar St | 0.28mi | 2/2.5 | 1,100 (0%) | 0mo | $224,085 | $204 | 87 |
| 1090 Indiana Ave | 0.14mi | 3/2.0 (+1) | 1,100 (0%) | 2mo | $233,000 | $212 | 85 |
| 910 States Ave | 0.14mi | 3/2.0 (+1) | 1,100 (0%) | 3mo | $257,000 | $234 | 84 |
| 661 Apollo Ave | 0.17mi | 3/2.0 (+1) | 1,100 (0%) | 1mo | $222,170 | $202 | 84 |
| 580 Solar St | 0.27mi | 3/2.0 (+1) | 1,100 (0%) | 0mo | $225,426 | $205 | 80 |
| 501 Solar St | 0.34mi | 3/2.0 (+1) | 1,100 (0%) | 0mo | $222,170 | $202 | 77 |
| 850 States Ave | 0.15mi | 3/2.5 (+1) | 1,250 (+14%) | 2mo | $254,250 | $203 | 64 |
| 880 States Ave | 0.14mi | 3/2.5 (+1) | 1,250 (+14%) | 3mo | $259,000 | $207 | 63 |
| 581 Solar St | 0.27mi | 3/2.5 (+1) | 1,250 (+14%) | 1mo | $246,142 | $197 | 59 |
| 511 Solar St | 0.32mi | 3/2.5 (+1) | 1,250 (+14%) | 0mo | $246,142 | $197 | 57 |
Match score weights: distance 35% · size 25% · config 20% · recency 20%. Top-matched comps best support the ARV.
Projected returns pro-forma
-0.87% appreciation · 0.64% rent growth · sell at horizon
- IRR
- -12.6%
- Equity multiple
- 0.46×
- Total profit
- $-32,432
- Equity at exit
- $53,242
- IRR
- -8.0%
- Equity multiple
- 0.31×
- Total profit
- $-41,681
- Equity at exit
- $57,062
Cash invested: $60,200 (down + closing). Projections, not guarantees.
Landlord ↔ Tenant lean methodology
- Overall (STATE)
- 92 Strongly Landlord-Friendly
- State Arkansas
- 92 Strongly Landlord-Friendly · R+14
- County
- — inherits STATE
- City
- — inherits STATE
ZIP-level market 72719
- Home prices YoY
- -0.3%
- Rents YoY
- 0.6%
- Active inventory
- 458
- Price-to-rent
- 11.2×
Monthly cashflow live
- Estimated rent
- $1,606 high interval (Pro) →
- Mortgage (P&I)
- −$1,127
- Tax est. 1.5%
- −$269 /mo · $3,225/yr
- Insurance
- −$90
- HOA
- −$0
- Vacancy / Maint / Mgmt
- −$337
- Net cashflow
- $-217
Break-even live
UW: 25.0% down · 7.5% · 30yr · 1.5% tax · 5.0% vac · 8.0% maint · 8.0% mgmt
Financing live
Cash to close
- Down payment
- $53,750
- Closing costs
- $6,450
- Reserves months
- —
- Total cash needed
- —
Loan-product check · same deal, 3 products live
Conventional
25% down · 7.5% · 30yr
- Down + closing
- —
- Monthly P&I
- —
- Monthly cashflow
- —
- DSCR
- —
- Eligible?
- —
Personal DTI + credit; lowest rate.
DSCR
20% down · 8.5% · 30yr
- Down + closing
- —
- Monthly P&I
- —
- Monthly cashflow
- —
- DSCR
- —
- Eligible?
- —
No personal income docs; deal must DSCR.
Hard money
10% down · 12.0% · 12mo
- Down + closing
- —
- Monthly P&I
- —
- Monthly cashflow
- —
- DSCR
- —
- Eligible?
- —
Short-term bridge; refi at stabilization.
Rent comps 40 comps
| Address | Beds | Baths | Sqft | Rent | $/sqft | DOM | Units | Dist |
|---|---|---|---|---|---|---|---|---|
| 960 Ventnor Ave Centerton, AR | 3.0 | 2.5 | 1250 | $1,750 | $1.40 | 23d | 1 | 0.02mi |
| 1071 Ventnor Ave Centerton, AR | 3.0 | 2.0 | 1100 | $1,400 | $1.27 | 23d | 1 | 0.07mi |
| 881 Ventnor Ave Centerton, AR | 3.0 | 2.5 | 1250 | $1,550 | $1.24 | 23d | 1 | 0.07mi |
| 861 Ventnor Ave Bentonville, AR | 2.0 | 2.5 | 1100 | $1,350 | $1.23 | 23d | 1 | 0.08mi |
| 1031 Kentucky Ave Bentonville, AR | 3.0 | 2.0 | 1100 | $1,700 | $1.55 | 23d | 1 | 0.09mi |
| 860 Ventnor Ave Bentonville, AR | 2.0 | 2.5 | 1100 | $1,350 | $1.23 | 23d | 1 | 0.09mi |
| 890 Tennessee Ave Bentonville, AR | 3.0 | 2.5 | 1250 | $1,595 | $1.28 | 21d | 1 | 0.09mi |
| 1061 Kentucky Ave Bentonville, AR | 3.0 | 2.5 | 1250 | $1,550 | $1.24 | 23d | 1 | 0.10mi |
| 1040 Indiana Ave Bentonville, AR | 3.0 | 2.0 | 1100 | $1,624 | $1.48 | 23d | 1 | 0.10mi |
| 1050 Indiana Ave Bentonville, AR | 3.0 | 2.0 | 1100 | $1,624 | $1.48 | 23d | 1 | 0.10mi |
| 831 Ventnor Ave Bentonville, AR | 3.0 | 2.0 | 1100 | $1,525 | $1.39 | 23d | 1 | 0.10mi |
| 830 Ventnor Ave Bentonville, AR | 2.0 | 2.5 | 1100 | $1,350 | $1.23 | 21d | 1 | 0.11mi |
| 840 Boardwalk Ave Bentonville, AR | 2.0 | 2.5 | 1100 | $1,465 | $1.33 | 23d | 1 | 0.11mi |
| 1080 Indiana Ave Bentonville, AR | 3.0 | 2.0 | 1100 | $1,624 | $1.48 | 23d | 1 | 0.11mi |
| 821 Arctic Ave Bentonville, AR | 2.0 | 2.0 | 1250 | $1,726 | $1.38 | 23d | 1 | 0.12mi |
| 1061 Indiana Ave Bentonville, AR | 3.0 | 2.0 | 1100 | $1,624 | $1.48 | 23d | 1 | 0.12mi |
| 820 Boardwalk Ave Bentonville, AR | 3.0 | 2.0 | 1100 | $1,450 | $1.32 | 23d | 1 | 0.12mi |
| 1020 States Ave Bentonville, AR | 3.0 | 2.0 | 1100 | $1,624 | $1.48 | 23d | 1 | 0.13mi |
| 841 Tennessee Ave Bentonville, AR | 2.0 | 2.5 | 1250 | $1,640 | $1.31 | 23d | 1 | 0.13mi |
| 1091 Indiana Ave Bentonville, AR | 2.0 | 2.0 | 1250 | $1,718 | $1.37 | 23d | 1 | 0.13mi |
| 1060 States Ave Bentonville, AR | 3.0 | 2.0 | 1100 | $1,624 | $1.48 | 23d | 1 | 0.14mi |
| 830 Massachusetts Ave Bentonville, AR | 2.0 | 2.0 | 1250 | $1,718 | $1.37 | 23d | 1 | 0.14mi |
| 1021 States Ave Bentonville, AR | 2.0 | 2.5 | 1250 | $1,850 | $1.48 | 14d | 1 | 0.14mi |
| 1090 States Ave Bentonville, AR | 2.0 | 2.0 | 1250 | $1,718 | $1.37 | 23d | 1 | 0.14mi |
| 931 States Ave Bentonville, AR | 2.0 | 2.0 | 1250 | $1,718 | $1.37 | 23d | 1 | 0.15mi |
| 860 States Ave Bentonville, AR | 2.0 | 2.0 | 1250 | $1,718 | $1.37 | 23d | 1 | 0.15mi |
| 891 States Ave Bentonville, AR | 2.0 | 2.0 | 1250 | $1,718 | $1.37 | 23d | 1 | 0.16mi |
| 831 Massachusetts Ave Bentonville, AR | 2.0 | 2.0 | 1250 | $1,718 | $1.37 | 23d | 1 | 0.16mi |
| 840 States Ave Bentonville, AR | 3.0 | 2.0 | 1100 | $1,624 | $1.48 | 23d | 1 | 0.16mi |
| 410 Coconut Ln Centerton, AR | 3.0 | 2.0 | 1393 | $1,850 | $1.33 | 23d | 1 | 0.34mi |
| 811 Meadowlands Dr Centerton, AR | 3.0 | 2.0 | 1474 | $1,225 | $0.83 | 23d | 1 | 0.43mi |
| 130 cedar St Centerton, AR | 1.0–2.0 | 1.0–1.5 | 897 | $1,395 | $1.55 | 14d | 12 | 0.60mi |
| 240 Sage St Centerton, AR | 3.0 | 2.0 | 1250 | $1,400 | $1.12 | 23d | 1 | 0.61mi |
| 533 Vee St Centerton, AR | 3.0 | 2.0 | 1250 | $1,550 | $1.24 | 14d | 1 | 0.63mi |
| 156 Copper Oaks Dr Centerton, AR | 2.0 | 2.0 | 1140 | $1,550 | $1.36 | 23d | 1 | 0.64mi |
| 501 E Centerton Blvd Centerton, AR | 1.0–2.0 | 1.0–2.0 | 835 | $1,292 | $1.55 | 14d | 25 | 0.66mi |
| 422 Red Robin St Unit 422 Centerton, AR | 3.0 | 2.0 | 1290 | $1,550 | $1.20 | 14d | 1 | 0.66mi |
| 112 Sage St Centerton, AR | 3.0 | 2.0 | 1200 | $1,425 | $1.19 | 14d | 1 | 0.72mi |
| 621-623 Cosmos St Centerton, AR | 3.0 | 2.0 | 1475 | $1,795 | $1.22 | 14d | 1 | 0.73mi |
| 261 Copper Oaks Dr Centerton, AR | 3.0 | 2.0 | 1336 | $1,425 | $1.07 | 23d | 1 | 0.80mi |
Listing history 26 events
-
2026-06-18days on market $215,000 Active 28 DOM
-
2026-06-17days on market $215,000 Active 27 DOM
-
2026-06-16days on market $215,000 Active 26 DOM
-
2026-06-15days on market $215,000 Active 25 DOM
-
2026-06-14days on market $215,000 Active 23 DOM
-
2026-06-10days on market $215,000 Active 20 DOM
-
2026-06-09days on market $215,000 Active 19 DOM
-
2026-06-08days on market $215,000 Active 18 DOM
-
2026-06-07days on market $215,000 Active 17 DOM
-
2026-06-05days on market $215,000 Active 14 DOM
-
2026-06-03days on market $215,000 Active 13 DOM
-
2026-06-02days on market $215,000 Active 12 DOM
-
2026-06-01days on market $215,000 Active 11 DOM
-
2026-05-31days on market $215,000 Active 10 DOM
-
2026-05-31days on market $215,000 Active 9 DOM
-
2026-05-21$215,000 Active
-
2024-02-27historical $1,350
-
2024-01-11$1,350
-
2023-12-19historical $1,350
-
2023-12-06price $1,350
-
2023-11-15$1,500
-
2023-11-15historical $1,550
-
2023-11-02$1,550
-
2023-08-30soldstatus $234,900 Closed 242-char remark
Show marketing remark (242 chars)
Wonderful new subdivision in Bentonville School District. Less than 5 miles from Walmart Corporate office. Come enjoy simplified living in a modern environment. Future park and walking trails throughout neighborhood. Schedule a showing today!
-
2023-07-15status Pending 242-char remark
Show marketing remark (242 chars)
Wonderful new subdivision in Bentonville School District. Less than 5 miles from Walmart Corporate office. Come enjoy simplified living in a modern environment. Future park and walking trails throughout neighborhood. Schedule a showing today!
-
2023-07-07$234,900 Active 242-char remark
Show marketing remark (242 chars)
Wonderful new subdivision in Bentonville School District. Less than 5 miles from Walmart Corporate office. Come enjoy simplified living in a modern environment. Future park and walking trails throughout neighborhood. Schedule a showing today!
ⓘ Source: listings_history table (triggers on properties + properties_extension) + one-shot
backfill from property_details.listing_events for pre-trigger history.
Climate risk First Street
- Flood 1/10 Low FEMA zone X (unshaded) · 0% chance over 30 yrs
- Wildfire 5/10 Major
- Heat 5/10 Major 7 d/yr ≥105°F today · 18 d/yr by 30 yrs out
- Wind 2/10 Low 4% chance of damaging wind over 30 yrs
- Air quality 2/10 Low 0 unhealthy d/yr today · 1 by 30 yrs out
Nearby sold comps map
Loading sold comps map…
Walkable amenities ~0.75 mi
Loading nearby amenities…
Taxation est. · year 1
- Rental income
- $19,277
- − Mortgage interest
- −$12,043
- − Property taxes
- −$3,225
- − Insurance
- −$1,075
- − Repairs & maintenance
- −$1,542
- − Management
- −$1,542
- − Depreciation
- −$6,255
- Taxable loss
- −$6,405
- Est. tax savings @ 24.0%
- +$1,537
- After-tax cash flow
- $-1,064/yr
For passive investors: Depreciation is non-cash, so a rental often shows a tax loss while cash-flowing — sheltering income. Rental losses are passive: they offset passive income freely, and up to $25,000/yr can offset ordinary (W-2) income if you actively participate and your MAGI is under $100k (phasing out to $0 by $150k); unused losses carry forward. On sale, claimed depreciation is recaptured at up to 25%, and gains may owe capital-gains tax (a 1031 exchange can defer both). Figures are a year-1 estimate at your 24.0% rate — not tax advice; consult a CPA.
Schools (NCES district)
- District
- Bentonville School District
- NCES district ID
- 0503060
- Math proficiency
- 59% ▼ -8.00%
- Reading proficiency
- 59% ▼ -6.00%
- Median HH income
- $66,721
- Composite
- 51.85/100
- National rank
- #1661
- State rank
- #3 of 238 in AR
Livability — Centerton
- Score
- 77/100
- State rank
- #11
- US rank
- #3194
Category grades
Schools grade is shown separately in the Schools card above.
Census & demographics
- Census place
- Centerton, AR
- County
- Benton County · 259,241 people
- City population
- 19,701
- Metro
- Fayetteville-Springdale-Rogers, AR
- Population (ZIP)
- 19,701
- Household income
- $113,542
- Rent vs Own
- Severe rent burden
- 374.0
Population outlook (Benton County) Hauer SSP2
- Today (2025)
- 318,683 people
- By 2030
- 353,481 · +10.9%
- By 2040
- 425,280 · +33.4%
- By 2050
- 497,239 · +56.0%
- By 2075
- 662,114 · +107.8%
- By 2100
- 776,431 · +143.6%
Race, ethnicity, and origin ACS 2023
- Neighborhood character
- Diverse neighborhood (Simpson 0.64)
- Race & ethnicity
- White 58% Two or more races 25% Hispanic / Latino 14% Black 6% Asian 5%
- Hispanic origin (detail)
- Mexican 8% Cuban 2%
- Common ancestry
- Slovak 2% Italian 1% Lithuanian 1%
- Foreign-born
- 10% · Canada, Vietnam
- Languages at home
- 89% English-only · Spanish 9% Vietnamese 1% Other Asian/Pacific 1%
Political lean MEDSL · Benton
- 2024 margin
- Strong R (+27.0) · D 35.2% · R 62.1% · Other 2.7%
- 2008→2024 swing
- +9.6pp toward D · 2008: -36.5pp · 2024: -27.0pp
- All cycles
- 2024: R+27.0 2020: R+26.4 2016: R+34.9 2012: R+40.4 2008: R+36.5
Not yet ingested
- Civics
- —
Market trends
- HPI YoY
- ▼ -0.87%
- Current HPI
- 320.376
- Rent YoY
- ▲ 0.64%
- Metro
- Fayetteville-Springdale-Rogers, AR
- State GDP YoY
- ▲ 3.80%
- F500 in state
- 10
Industry mix (Fortune 500 HQ in AR)
| Industry | F500 HQs | Revenue |
|---|---|---|
| Retail | 1 | $681B |
|
||
| Food / Agriculture | 1 | $53B |
|
||
| Retail / Energy | 1 | $22B |
|
||
| Transportation / Logistics | 1 | $12B |
|
||
| Energy | 1 | $4B |
|
||
Price history
-8.5% since first listed11 events — show timeline
- 2026-05-21 Listed $215,000 NWARMLS
- 2024-02-27 Rental Removed $1,350 NWARMLS
- 2024-01-11 Listed for Rent $1,350 NWARMLS
- 2023-12-19 Rental Removed $1,350 NWARMLS
- 2023-12-06 Price Changed $1,350 NWARMLS
- 2023-11-15 Listed for Rent $1,500 NWARMLS
- 2023-11-15 Rental Removed $1,550 NWARMLS
- 2023-11-02 Listed for Rent $1,550 NWARMLS
- 2023-08-30 Sold (MLS) $234,900 NWARMLS
- 2023-07-15 Pending — NWARMLS
- 2023-07-07 Listed $234,900 NWARMLS
Cash-flow waterfall
monthlySold comps — $/sqft
last 12 mo · ≤1 miLoading sold comps…