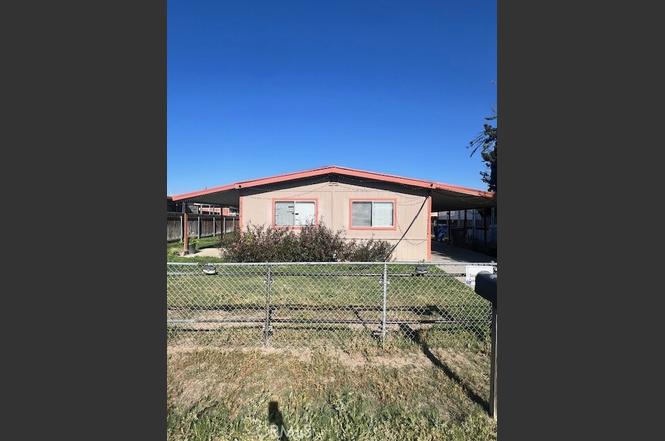
6204 Dennen St · Bakersfield, CA
Flood risk 1/10 · Minimal
- FEMA flood zone
- X (unshaded)
- Chance of flooding over 30 yrs
- 0.0%
- Est. flood insurance / yr
- $507 – $1,088
Fire risk 1/10 · Minimal
- Est. fire insurance / yr
- $659 – $1,223
Heat risk 8/10 · Major
- Hot days now (above 105°F)
- 7 days/yr
- Hot days in 30 yrs
- 18 days/yr
Wind risk 1/10 · Minimal
- Chance of severe wind over 30 yrs
- —
Air-quality risk 10/10 · Severe
- Unhealthy air days now
- 33 days/yr
- Unhealthy air days in 30 yrs
- 37 days/yr
Risk factors via First Street. Map © Google.
Why this score? — see what drove the C grade
The composite is a weighted blend of 9 inputs, each scored 0–100. Each bar is that input's sub-score; the figure is the points it added to the 100-point composite (weight × sub-score).
- Cash flow +21.2/30.0
- ARV discount +13.3/15.0
- DSCR +6.8/10.0
- 1% rule +4.6/10.0
- Schools +3.4/10.0
- Rent growth +3.0/5.0
- Livability +2.9/5.0
- Condition / age +2.5/5.0
- Appreciation +0.0/10.0
$230,999
🖨 Deal sheet (PDF) 📄 Offer letter ✓ Due diligence
Listing remarks MLS
Welcome to Southwest Bakersfield! This charming manufactured home sits on its own land and offers a fantastic opportunity for homeownership. Featuring 3 bedrooms and 2 bathrooms, this property is full of potential and ready for your personal touch. Whether you're a first-time buyer or looking to invest, you won't want to miss this one.
Key facts
- 6,098 sq ft lot
- Built 1977
- Listed 38 days
Neighborhood map
What this means for you Summary
Snapshot
- This is a 3-bed/2.0-bath manufactured listed at $231k.
Deal economics
- At list price, monthly cash flow is $333 ($4k/yr) — positive.
- The deal already cash-flows at list — no discount required.
- To meet the 1% rule (rent ≥ 1% of price), the offer needs to be $222k (3.9% below list).
- Recommended offer: $222k (3.9% below list) — sets the bar for 1% rule.
- Cap rate 8.0% vs local median 3.6% in Bakersfield — top-decile yield for the area; either an underpriced asset or a hidden risk that comps aren't pricing in. Stress-test before assuming the spread holds.
Location & tenants
- Location reads 58/100 on livability (#716 in CA) — a working-class tenant base; expect higher turnover. Strengths: housing A+; Watch: health & safety D, schools D-, crime F.
- Kern High (urban): math 21% / reading 51% proficiency, ranked #860 of 1,400 in CA (top 61%) — families likely to look elsewhere, expect single-tenant / working-renter base with shorter leases.
- Market conditions: Rents rising (+2.1%/yr); 271 active listings in the ZIP; 25 comparable units currently listed for rent nearby; rentals leasing fast (median 4d on market — plan ~1-2 weeks tenant-placement turnaround); solid renter incomes; 3,244 units permitted in Kern County in 2024 (73 in 5+ unit buildings).
Forward outlook
- Local home prices are declining (-3.0%/yr); year-one equity from $2k of loan paydown is wiped out by about $7k of value loss. Plan a longer hold.
- Kern County population projected at +17% by 2050 — long-run rental-demand tailwind backs the buy-and-hold thesis.
Negotiation context
- It's been on market 38 days — a 3% lower offer ($224k) is reasonable based on typical stale-listing flexibility.
- 7 sale attempts since 31y ago with the ask held roughly flat each time — persistent listings suggest the price (not the market) is what's stuck; bring a comps-based counter.
Risks & watch-outs
- Climate carrying-cost: extreme-heat days projected 7→18/yr by 2055 (HVAC capex compounding) — expect insurance premiums to compound above CPI over the hold.
Questions for the listing agent
- It's been on market 38 days. Have you received any prior offers? Is the seller open to a 4% concession, seller financing, or rate buy-down credit?
- Built in 1977 — when were the roof, HVAC, electrical panel, plumbing, and water heater last replaced?
- Is there a deadline driving the sale (1031 exchange, divorce, estate, relocation)? That informs how much negotiation room exists.
- Schools are D-rated, which usually means shorter tenancies and higher turnover. Who's the typical renter profile here, and what's been the actual vacancy rate?
- Crime grade is F in this area — have there been break-ins, vandalism, or insurance claims at this property in the last 3 years? What carrier currently insures it and at what premium?
- What's the average days-on-market for RENTAL listings here right now (not sales)? A rising rental-DOM trend means longer vacancies and softer asking-rent achievability than the comps imply.
- What's the recent tenant-quality profile in this submarket — average credit score on applications, eviction rate, late-payment / NSF rate, and stable-employment percentage? A property-management company in the area should have these aggregated.
- How much new for-sale + rental construction is in the pipeline within 1–3 miles? Heavy new supply typically softens prices + rents 12–24 months out; constrained supply supports both.
Investment metrics
- 1% rule
- 0.96% ✗
- Cap rate
- 8.02%
- Cash-on-cash
- 6.18%
- DSCR
- 1.28
- GRM
- 8.7
CMA / ARV
- ARV (on-the-fly)
- $264,960
- Comps found
- 4
Show comp detail 4 sales within ~0.75 mi
| Address | Dist | Beds/Ba | Sqft | Sold | Price | $/sf | Match |
|---|---|---|---|---|---|---|---|
| 6309 Dennen St | 0.08mi | 3/2.0 | 1,521 (+6%) | 1mo | $280,000 | $184 | 86 |
| 6216 Dennen St | 0.03mi | 3/2.0 | 1,440 (0%) | 21mo | $150,000 | $104 | 81 |
| 2812 Wheatland Ave | 0.12mi | 3/2.0 | 1,536 (+7%) | 21mo | $255,000 | $166 | 66 |
| 2505 Carlita Ct | 0.36mi | 2/2.0 (-1) | 1,272 (-12%) | 8mo | $250,000 | $197 | 52 |
Match score weights: distance 35% · size 25% · config 20% · recency 20%. Top-matched comps best support the ARV.
Projected returns pro-forma
-3.0% appreciation · 2.12% rent growth · sell at horizon
- IRR
- -7.7%
- Equity multiple
- 0.72×
- Total profit
- $-18,228
- Equity at exit
- $34,443
- IRR
- 0.8%
- Equity multiple
- 1.05×
- Total profit
- $3,300
- Equity at exit
- $19,973
Cash invested: $64,680 (down + closing). Projections, not guarantees.
Landlord ↔ Tenant lean methodology
- Overall (STATE)
- 18 Strongly Tenant-Friendly
- State California
- 18 Strongly Tenant-Friendly · D+13
- County
- — inherits STATE
- City
- — inherits STATE
ZIP-level market 93313
- Home prices YoY
- -20.4%
- Rents YoY
- 2.1%
- Active inventory
- 271
- Price-to-rent
- 8.7×
Monthly cashflow live
- Estimated rent
- $2,221 high interval (Pro) →
- Mortgage (P&I)
- −$1,211
- Tax from tax record
- −$114 /mo · $1,363/yr
- Insurance
- −$96
- HOA
- −$0
- Vacancy / Maint / Mgmt
- −$466
- Net cashflow
- $333
Break-even live
Sensitivity live
| Price | -10% $464 | -5% $399 | +0% $333 | +5% $268 | +10% $203 |
|---|---|---|---|---|---|
| Rent | -10% $158 | -5% $246 | +0% $333 | +5% $421 | +10% $509 |
| Rate | -1.0pp $450 | -0.5pp $392 | base $333 | +0.5pp $273 | +1.0pp $213 |
UW: 25.0% down · 7.5% · 30yr · 1.5% tax · 5.0% vac · 8.0% maint · 8.0% mgmt
Financing live
Cash to close
- Down payment
- $57,750
- Closing costs
- $6,930
- Reserves months
- —
- Total cash needed
- —
Loan-product check · same deal, 3 products live
Conventional
25% down · 7.5% · 30yr
- Down + closing
- —
- Monthly P&I
- —
- Monthly cashflow
- —
- DSCR
- —
- Eligible?
- —
Personal DTI + credit; lowest rate.
DSCR
20% down · 8.5% · 30yr
- Down + closing
- —
- Monthly P&I
- —
- Monthly cashflow
- —
- DSCR
- —
- Eligible?
- —
No personal income docs; deal must DSCR.
Hard money
10% down · 12.0% · 12mo
- Down + closing
- —
- Monthly P&I
- —
- Monthly cashflow
- —
- DSCR
- —
- Eligible?
- —
Short-term bridge; refi at stabilization.
Rent comps 25 comps
| Address | Beds | Baths | Sqft | Rent | $/sqft | DOM | Units | Dist |
|---|---|---|---|---|---|---|---|---|
| 3316 Fiesta Ave Bakersfield, CA | 3.0 | 3.0 | 1700 | $2,300 | $1.35 | 44d | 1 | 0.47mi |
| 6304 Castleford St Unit 4 Bakersfield, CA | 3.0 | 2.0 | 1144 | $1,500 | $1.31 | 44d | 1 | 0.55mi |
| 6302 Castleford St Unit 4 Bakersfield, CA | 3.0 | 2.0 | 1144 | $1,500 | $1.31 | 3d | 1 | 0.55mi |
| 2625 Miria Dr Bakersfield, CA | 3.0 | 1.0 | 1308 | $1,850 | $1.41 | 24d | 1 | 0.57mi |
| 6401 Castleford St Unit C Bakersfield, CA | 3.0 | 2.0 | 1125 | $1,500 | $1.33 | 20d | 1 | 0.59mi |
| 6513 Pine View Dr Bakersfield, CA | 3.0 | 2.5 | 1600 | $1,950 | $1.22 | 3d | 1 | 0.62mi |
| 2308 Kelso Peak Ave Bakersfield, CA | 3.0 | 2.5 | 1752 | $3,900 | $2.23 | 4d | 1 | 0.86mi |
| 3921 White Sands Dr Bakersfield, CA | 4.0 | 2.0 | 1798 | $2,550 | $1.42 | 3d | 1 | 0.95mi |
| 5516 Dustin St Bakersfield, CA | 4.0 | 2.0 | 1507 | $2,450 | $1.63 | 44d | 1 | 1.00mi |
| 4605 Mount Everest Way Bakersfield, CA | 3.0 | 2.0 | 1465 | $2,250 | $1.54 | 3d | 1 | 1.00mi |
| 4212 Cyclone Dr Bakersfield, CA | 4.0 | 2.0 | 1471 | $2,275 | $1.55 | 3d | 1 | 1.06mi |
| 4012 Island Mist Ct Bakersfield, CA | 3.0 | 2.0 | 1436 | $2,300 | $1.60 | 3d | 1 | 1.07mi |
| 1318 Evadonna Rd Bakersfield, CA | 3.0 | 2.0 | 1012 | $2,200 | $2.17 | 11d | 1 | 1.17mi |
| 4508 Blossom Valley Ln Bakersfield, CA | 3.0 | 2.0 | 1107 | $1,850 | $1.67 | 22d | 1 | 1.18mi |
| 1305 Quartz Hill Rd Bakersfield, CA | 3.0 | 2.0 | 1351 | $2,250 | $1.67 | 3d | 1 | 1.25mi |
| 8203 Libby Ct Bakersfield, CA | 4.0 | 2.0 | 1715 | $2,400 | $1.40 | 22d | 1 | 1.33mi |
| 1000 Pacheco Rd Unit 131 Bakersfield, CA | 3.0 | 1.0 | 1095 | $1,650 | $1.51 | 3d | 1 | 1.35mi |
| 4309 Rosewall St Bakersfield, CA | 3.0 | 2.0 | 1356 | $2,200 | $1.62 | 3d | 1 | 1.36mi |
| 6208 Stine Rd Apt B Bakersfield, CA | 2.0 | 1.0 | 904 | $1,495 | $1.65 | 11d | 1 | 1.38mi |
| 3605 Biltmore Ln Bakersfield, CA | 2.0 | 2.0 | 1450 | $1,650 | $1.14 | 3d | 1 | 1.38mi |
| 4140 Teal St Apt 10 Bakersfield, CA | 2.0 | 1.0 | 950 | $1,295 | $1.36 | 24d | 1 | 1.46mi |
| 4140 Teal St Unit 12A Bakersfield, CA | 2.0 | 1.0 | 950 | $1,525 | $1.61 | 11d | 1 | 1.46mi |
| 4140 Teal St Bakersfield, CA | 2.0 | 1.0 | 950 | $1,525 | $1.61 | 3d | 1 | 1.46mi |
| 4215 Teal St Bakersfield, CA | 2.0 | 1.5 | 960 | $1,395 | $1.45 | 3d | 3 | 1.49mi |
| 5012 Greenville Ct Bakersfield, CA | 3.0 | 2.0 | 1500 | $2,200 | $1.47 | 44d | 1 | 1.50mi |
Listing history 33 events
-
2026-03-20status Pending Sale 337-char remark
Show marketing remark (337 chars)
Welcome to Southwest Bakersfield! This charming manufactured home sits on its own land and offers a fantastic opportunity for homeownership. Featuring 3 bedrooms and 2 bathrooms, this property is full of potential and ready for your personal touch. Whether you're a first-time buyer or looking to invest, you won't want to miss this one.
-
2026-03-17soldstatus $235,000 Closed Sale 337-char remark
Show marketing remark (337 chars)
Welcome to Southwest Bakersfield! This charming manufactured home sits on its own land and offers a fantastic opportunity for homeownership. Featuring 3 bedrooms and 2 bathrooms, this property is full of potential and ready for your personal touch. Whether you're a first-time buyer or looking to invest, you won't want to miss this one.
-
2026-03-17soldstatus $235,000
Show marketing remark (337 chars)
Welcome to Southwest Bakersfield! This charming manufactured home sits on its own land and offers a fantastic opportunity for homeownership. Featuring 3 bedrooms and 2 bathrooms, this property is full of potential and ready for your personal touch. Whether you're a first-time buyer or looking to invest, you won't want to miss this one.
-
2026-02-06status Pending
-
2026-01-27status Active 337-char remark
Show marketing remark (337 chars)
Welcome to Southwest Bakersfield! This charming manufactured home sits on its own land and offers a fantastic opportunity for homeownership. Featuring 3 bedrooms and 2 bathrooms, this property is full of potential and ready for your personal touch. Whether you're a first-time buyer or looking to invest, you won't want to miss this one.
-
2026-01-27price $230,999 337-char remark
Show marketing remark (337 chars)
Welcome to Southwest Bakersfield! This charming manufactured home sits on its own land and offers a fantastic opportunity for homeownership. Featuring 3 bedrooms and 2 bathrooms, this property is full of potential and ready for your personal touch. Whether you're a first-time buyer or looking to invest, you won't want to miss this one.
-
2026-01-27price $230,999
Show marketing remark (337 chars)
Welcome to Southwest Bakersfield! This charming manufactured home sits on its own land and offers a fantastic opportunity for homeownership. Featuring 3 bedrooms and 2 bathrooms, this property is full of potential and ready for your personal touch. Whether you're a first-time buyer or looking to invest, you won't want to miss this one.
-
2026-01-14price $235,999
-
2025-12-29$242,999 Active
-
2025-11-24historical Active Under Contract 337-char remark
Show marketing remark (337 chars)
Welcome to Southwest Bakersfield! This charming manufactured home sits on its own land and offers a fantastic opportunity for homeownership. Featuring 3 bedrooms and 2 bathrooms, this property is full of potential and ready for your personal touch. Whether you're a first-time buyer or looking to invest, you won't want to miss this one.
-
2025-11-24historical Active - Contingent
Show marketing remark (337 chars)
Welcome to Southwest Bakersfield! This charming manufactured home sits on its own land and offers a fantastic opportunity for homeownership. Featuring 3 bedrooms and 2 bathrooms, this property is full of potential and ready for your personal touch. Whether you're a first-time buyer or looking to invest, you won't want to miss this one.
-
2025-11-22price $229,999
-
2025-10-17price $239,999
-
2025-10-07price $245,000
-
2025-08-13price $249,999
-
2025-06-02price $254,999
-
2025-04-11$264,999 Active 337-char remark
Show marketing remark (337 chars)
Welcome to Southwest Bakersfield! This charming manufactured home sits on its own land and offers a fantastic opportunity for homeownership. Featuring 3 bedrooms and 2 bathrooms, this property is full of potential and ready for your personal touch. Whether you're a first-time buyer or looking to invest, you won't want to miss this one.
-
2025-04-11$264,999 Active
Show marketing remark (337 chars)
Welcome to Southwest Bakersfield! This charming manufactured home sits on its own land and offers a fantastic opportunity for homeownership. Featuring 3 bedrooms and 2 bathrooms, this property is full of potential and ready for your personal touch. Whether you're a first-time buyer or looking to invest, you won't want to miss this one.
-
2018-07-10price $122,000
-
2013-08-12price $57,950
-
2013-07-31soldstatus $60,000
-
2013-07-24historical
-
2013-06-24$60,000
-
1996-02-02soldstatus $51,000
-
1996-02-02soldstatus $51,000
-
1996-02-02soldstatus $51,000
-
1995-12-21price $55,000
-
1995-12-21historical
-
1995-12-21historical
-
1995-12-21price $55,000
-
1995-11-18$51,000
-
1995-11-18$51,000
-
1990-12-11soldstatus $28,000
ⓘ Source: listings_history table (triggers on properties + properties_extension) + one-shot
backfill from property_details.listing_events for pre-trigger history.
Tax reassessment forecast CA · Resets to sale price
- Current annual tax
- $1,363 · $114/mo
- Projected year-2 tax
- $1,756 · $146/mo
- Expected delta
- +$393/yr (+$33/mo · 28.8%)
ⓘ Screening estimate from a state-policy table — verify with the county assessor before closing.
Climate risk First Street
- Flood 1/10 Low FEMA zone X (unshaded) · 0% chance over 30 yrs
- Wildfire 1/10 Low
- Heat 8/10 Severe 7 d/yr ≥105°F today · 18 d/yr by 30 yrs out
- Wind 1/10 Low
- Air quality 10/10 Extreme 33 unhealthy d/yr today · 37 by 30 yrs out
Nearby sold comps map
Loading sold comps map…
Walkable amenities ~0.75 mi
Loading nearby amenities…
Taxation est. · year 1
- Rental income
- $26,650
- − Mortgage interest
- −$12,940
- − Property taxes
- −$1,363
- − Insurance
- −$1,155
- − Repairs & maintenance
- −$2,132
- − Management
- −$2,132
- − Depreciation
- −$6,720
- Taxable income
- $209
- Est. tax owed @ 24.0%
- −$50
- After-tax cash flow
- $3,949/yr
For passive investors: Depreciation is non-cash, so a rental often shows a tax loss while cash-flowing — sheltering income. Rental losses are passive: they offset passive income freely, and up to $25,000/yr can offset ordinary (W-2) income if you actively participate and your MAGI is under $100k (phasing out to $0 by $150k); unused losses carry forward. On sale, claimed depreciation is recaptured at up to 25%, and gains may owe capital-gains tax (a 1031 exchange can defer both). Figures are a year-1 estimate at your 24.0% rate — not tax advice; consult a CPA.
Schools (NCES district)
- District
- Kern High
- NCES district ID
- 0619540
- Math proficiency
- 21% ▬ 0.00%
- Reading proficiency
- 51% ▲ 2.00%
- Median HH income
- $49,686
- Composite
- 33.68/100
- National rank
- #10443
- State rank
- #860 of 1400 in CA
Livability — Bakersfield
- Score
- 58/100
- State rank
- #716
- US rank
- #21355
Category grades
Schools grade is shown separately in the Schools card above.
Census & demographics
- Census place
- Bakersfield, CA
- County
- Kern County · 710,371 people
- City population
- 499,124
- Metro
- Bakersfield, CA
- Population (ZIP)
- 61,843
- Household income
- $91,943
- Rent vs Own
- Severe rent burden
- 1177.0
Population outlook (Kern County) Hauer SSP2
- Today (2025)
- 947,286 people
- By 2030
- 978,984 · +3.3%
- By 2040
- 1,045,018 · +10.3%
- By 2050
- 1,105,232 · +16.7%
- By 2075
- 1,229,538 · +29.8%
- By 2100
- 1,238,059 · +30.7%
Race, ethnicity, and origin ACS 2023
- Neighborhood character
- Diverse neighborhood (Simpson 0.61)
- Race & ethnicity
- Hispanic / Latino 57% Two or more races 28% White 22% Asian 13% Black 6%
- Hispanic origin (detail)
- Mexican 52%
- Common ancestry
- British 1% Romanian 1%
- Foreign-born
- 25% · Canada, Vietnam, China
- Languages at home
- 45% English-only · Spanish 40% Other Indo-European 8% Other Asian/Pacific 2%
Political lean MEDSL · Kern
- 2024 margin
- Strong R (+21.1) · D 38.2% · R 59.3% · Other 2.5%
- 2008→2024 swing
- -3.3pp toward R · 2008: -17.8pp · 2024: -21.1pp
- All cycles
- 2024: R+21.1 2020: R+10.2 2016: R+15.0 2012: R+20.9 2008: R+17.8
Not yet ingested
- Civics
- —
Market trends
- HPI YoY
- ▼ -85.95%
- Current HPI
- 335.9445
- Rent YoY
- ▲ 2.12%
- Metro
- Bakersfield, CA
- State GDP YoY
- ▲ 3.21%
- F500 in state
- 116
Industry mix (Fortune 500 HQ in CA)
| Industry | F500 HQs | Revenue |
|---|---|---|
| Technology | 27 | $1,492B |
|
||
| Financial Services | 3 | $174B |
|
||
| Retail | 3 | $44B |
|
||
| Insurance | 3 | $26B |
|
||
| Media / Entertainment | 2 | $115B |
|
||
| Pharmaceuticals / Biotech | 2 | $62B |
|
||
Price history
+739.3% since first listed33 events — show timeline
- 2026-03-20 Pending — CRMLS
- 2026-03-17 Sold (Public Records) $235,000 Public Records
- 2026-03-17 Sold (MLS) $235,000 CRMLS
- 2026-02-06 Pending — GEMLS
- 2026-01-27 Relisted — CRMLS
- 2026-01-27 Price Changed $230,999 CRMLS
- 2026-01-27 Price Changed $230,999 GEMLS
- 2026-01-14 Price Changed $235,999 GEMLS
- 2025-12-29 Listed $242,999 GEMLS
- 2025-11-24 Contingent — CRMLS
- 2025-11-24 Contingent — GEMLS
- 2025-11-22 Price Changed $229,999 GEMLS
- 2025-10-17 Price Changed $239,999 GEMLS
- 2025-10-07 Price Changed $245,000 GEMLS
- 2025-08-13 Price Changed $249,999 GEMLS
- 2025-06-02 Price Changed $254,999 GEMLS
- 2025-04-11 Listed $264,999 GEMLS
- 2025-04-11 Listed $264,999 CRMLS
- 2018-07-10 Price Changed $122,000 GEMLS
- 2013-08-12 Price Changed $57,950 GEMLS
- 2013-07-31 Sold (MLS) $60,000 GEMLS
- 2013-07-24 Delisted — GEMLS
- 2013-06-24 Listed $60,000 GEMLS
- 1996-02-02 Sold (Public Records) $51,000 Public Records
- 1996-02-02 Sold (MLS) $51,000 GEMLS
- 1996-02-02 Sold (MLS) $51,000 GEMLS
- 1995-12-21 Price Changed $55,000 GEMLS
- 1995-12-21 Delisted — GEMLS
- 1995-12-21 Delisted — GEMLS
- 1995-12-21 Price Changed $55,000 GEMLS
- 1995-11-18 Listed $51,000 GEMLS
- 1995-11-18 Listed $51,000 GEMLS
- 1990-12-11 Sold (Public Records) $28,000 Public Records
Property tax history
+2.5%/yrLatest (2025): $1,363 · +2.0% YoY. Source: county tax records.
Cash-flow waterfall
monthlySold comps — $/sqft
last 12 mo · ≤1 miLoading sold comps…