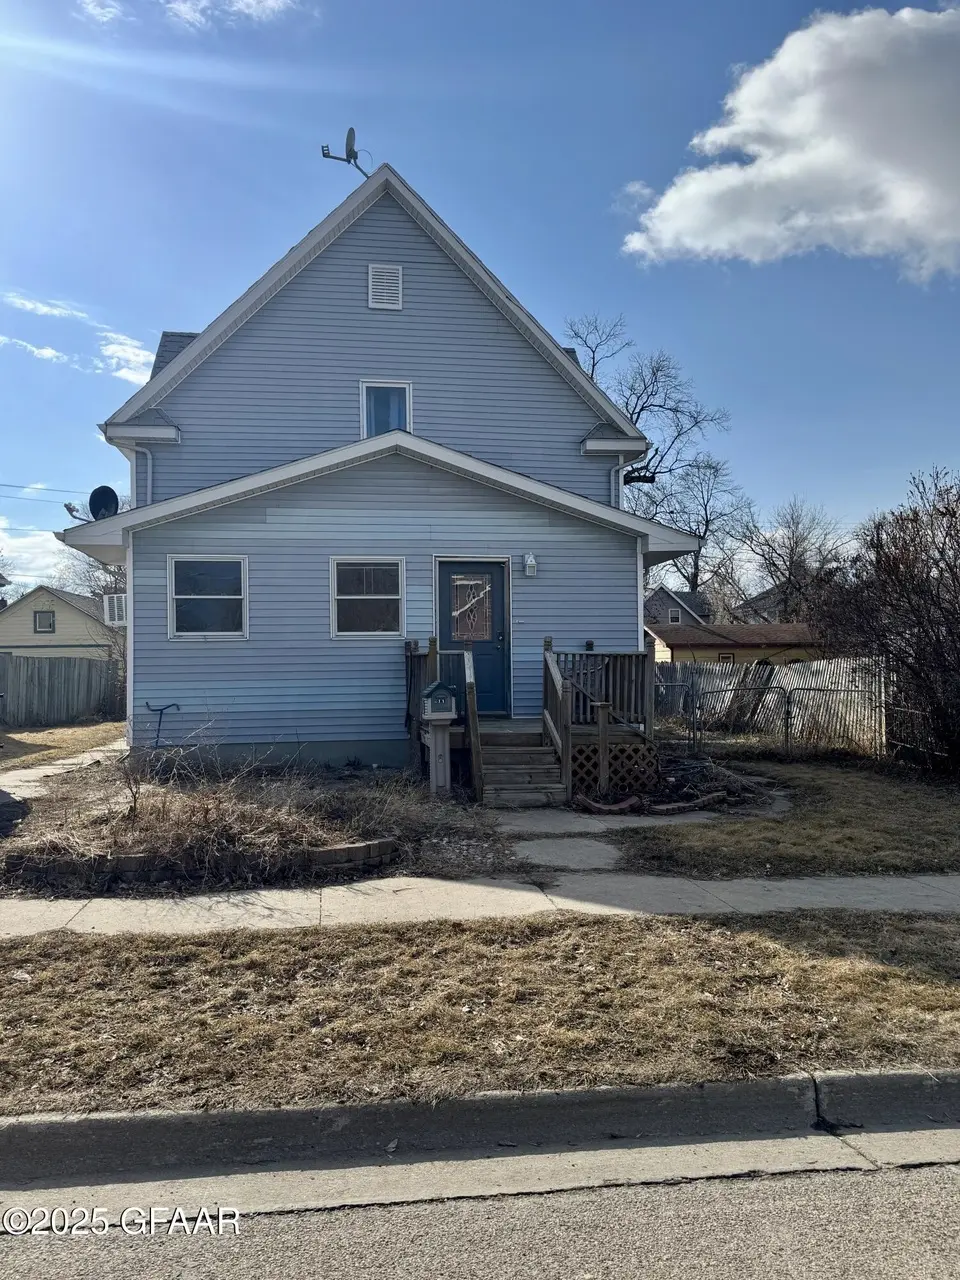
811 4th Ave NE · Devils Lake, ND
Flood risk 1/10 · Minimal
- FEMA flood zone
- X
- Chance of flooding over 30 yrs
- 0.0%
- Est. flood insurance / yr
- $473 – $860
Fire risk 7/10 · Major
- Est. fire insurance / yr
- $1,289 – $2,393
Heat risk 2/10 · Minimal
- Hot days now (above 94°F)
- 7 days/yr
- Hot days in 30 yrs
- 11 days/yr
Wind risk 1/10 · Minimal
- Chance of severe wind over 30 yrs
- —
Air-quality risk 3/10 · Minor
- Unhealthy air days now
- 2 days/yr
- Unhealthy air days in 30 yrs
- 2 days/yr
Risk factors via First Street. Map © Google.
Why this score? — see what drove the B- grade
The composite is a weighted blend of 9 inputs, each scored 0–100. Each bar is that input's sub-score; the figure is the points it added to the 100-point composite (weight × sub-score).
- Cash flow +29.3/30.0
- DSCR +10.0/10.0
- 1% rule +8.8/10.0
- ARV discount +7.5/15.0
- Livability +3.5/5.0
- Schools +3.0/10.0
- Rent growth +2.5/5.0
- Condition / age +2.5/5.0
- Appreciation +0.0/10.0
$90,000
🖨 Deal sheet 📄 Offer letter ✓ Due diligence
Key facts
- Large dining room
- Kitchen
- Laundry room
Tags
Property features AI
Exterior
- Utilities: Public water; Natural gas available
- Home design: Single-family residence; One and one-half story
- Construction: Vinyl siding; Block foundation
- Exterior features: Deck
Interior
- Bathrooms: 1 full bathroom; 1 three-quarter bathroom
- Heating & cooling: Forced air heating (natural gas); Cooling present
- Interior features: Partial basement; Basement present
Neighborhood map
What this means for you Summary
Snapshot
- This is a 3-bed/2.0-bath other listed at $90k.
Deal economics
- At list price, monthly cash flow is $315 ($4k/yr) — positive.
- The deal already cash-flows at list — no discount required.
- Meets the 1% rule at list price ($1k rent vs $90k).
- Recommended offer: $87k (3.0% below list) — sets the bar for market timing.
Location & tenants
- Location reads 69/100 on livability (#97 in ND) — a middle-class / working-renter tenant base. Strengths: cost of living A+, housing A+; Watch: employment D+, amenities F, commute F.
- Devils Lake 1 (town): math 34% / reading 35% proficiency, ranked #35 of 53 in ND (top 66%) — families likely to look elsewhere, expect single-tenant / working-renter base with shorter leases.
- Zoned schools: Devils Lake High School (math 22% / reading 22%, grade F, #128 of 144 statewide, top 90%, 500 students, 36% FRL) — zoned schools at 36% FRL track the district average.
- Zoned-school proficiency averages 22% at this address vs 34% district-wide (-12 pts) — the specific schools serving this property underperform the Devils Lake 1 average; the district grade overstates school quality for this exact location.
- Market conditions: 44 active listings in the ZIP; 6 units permitted in Ramsey County in 2024 (5 in 5+ unit buildings).
Forward outlook
- Local home prices are declining (-3.0%/yr); year-one equity from $622 of loan paydown is wiped out by about $3k of value loss. Plan a longer hold.
- Ramsey County population projected at +10% by 2050 — modest demand growth; plan on rents tracking national, not racing it.
- At projected returns (-3.0% appreciation + 3.0% rent growth), your $25k cash investment doubles in ~8 years — after that, you're playing with house money.
Negotiation context
- It's been on market 45 days — a 3% lower offer ($87k) is reasonable based on typical stale-listing flexibility.
- 2 sale attempts with the ask held roughly flat each time — persistent listings suggest the price (not the market) is what's stuck; bring a comps-based counter.
Risks & watch-outs
- Watch-outs: built in 1920 — expect roof / HVAC / electrical / plumbing capex.
- Climate carrying-cost: major wildfire risk — expect insurance premiums to compound above CPI over the hold.
Questions for the listing agent
- It's been on market 45 days. Have you received any prior offers? Is the seller open to a 3% concession, seller financing, or rate buy-down credit?
- Built in 1920 — when were the roof, HVAC, electrical panel, plumbing, and water heater last replaced?
- Is there a deadline driving the sale (1031 exchange, divorce, estate, relocation)? That informs how much negotiation room exists.
- What's the average days-on-market for RENTAL listings here right now (not sales)? A rising rental-DOM trend means longer vacancies and softer asking-rent achievability than the comps imply.
- What's the recent tenant-quality profile in this submarket — average credit score on applications, eviction rate, late-payment / NSF rate, and stable-employment percentage? A property-management company in the area should have these aggregated.
- How much new for-sale + rental construction is in the pipeline within 1–3 miles? Heavy new supply typically softens prices + rents 12–24 months out; constrained supply supports both.
Investment metrics
- 1% rule
- 1.38% ✓
- Cap rate
- 10.49%
- Cash-on-cash
- 15.00%
- DSCR
- 1.67
- GRM
- 6.0
CMA / ARV
No comps found within radius.
Projected returns pro-forma
-3.0% appreciation · 3.0% rent growth · sell at horizon
- IRR
- 5.6%
- Equity multiple
- 1.22×
- Total profit
- $5,528
- Equity at exit
- $13,419
- IRR
- 15.1%
- Equity multiple
- 2.22×
- Total profit
- $30,838
- Equity at exit
- $7,782
Cash invested: $25,200 (down + closing). Projections, not guarantees.
Landlord ↔ Tenant lean methodology
- Overall (STATE)
- 82 Strongly Landlord-Friendly
- State North Dakota
- 82 Strongly Landlord-Friendly · R+20
- County
- — inherits STATE
- City
- — inherits STATE
ZIP-level market 58301
- Home prices YoY
- -28.9%
- Active inventory
- 44
- Price-to-rent
- 6.0×
Monthly cashflow live
- Estimated rent
- $1,242 medium interval (Pro) →
- Mortgage (P&I)
- −$472
- Tax from tax record
- −$157 /mo · $1,880/yr
- Insurance
- −$38
- HOA
- −$0
- Vacancy / Maint / Mgmt
- −$261
- Net cashflow
- $315
Break-even live
UW: 25.0% down · 7.5% · 30yr · 1.5% tax · 5.0% vac · 8.0% maint · 8.0% mgmt
Financing live
Cash to close
- Down payment
- $22,500
- Closing costs
- $2,700
- Reserves months
- —
- Total cash needed
- —
Loan-product check · same deal, 3 products live
Conventional
25% down · 7.5% · 30yr
- Down + closing
- —
- Monthly P&I
- —
- Monthly cashflow
- —
- DSCR
- —
- Eligible?
- —
Personal DTI + credit; lowest rate.
DSCR
20% down · 8.5% · 30yr
- Down + closing
- —
- Monthly P&I
- —
- Monthly cashflow
- —
- DSCR
- —
- Eligible?
- —
No personal income docs; deal must DSCR.
Hard money
10% down · 12.0% · 12mo
- Down + closing
- —
- Monthly P&I
- —
- Monthly cashflow
- —
- DSCR
- —
- Eligible?
- —
Short-term bridge; refi at stabilization.
Listing history 18 events
-
2026-06-18days on market $90,000 Active 45 DOM
-
2026-06-17days on market $90,000 Active 44 DOM
-
2026-06-16days on market $90,000 Active 43 DOM
-
2026-06-15days on market $90,000 Active 42 DOM
-
2026-06-13days on market $90,000 Active 40 DOM
-
2026-06-12days on market $90,000 Active 39 DOM
-
2026-06-09days on market $90,000 Active 36 DOM
-
2026-06-08days on market $90,000 Active 35 DOM
-
2026-06-07days on market $90,000 Active 34 DOM
-
2026-06-05days on market $90,000 Active 32 DOM
-
2026-06-04days on market $90,000 Active 30 DOM
-
2026-06-02days on market $90,000 Active 29 DOM
-
2026-06-01days on market $90,000 Active 28 DOM
-
2026-05-31days on market $90,000 Active 27 DOM
-
2026-04-30$90,000 Active
-
2025-08-06price $100,000
-
2025-07-10price $125,000
-
2025-04-15$130,000 Active
ⓘ Source: listings_history table (triggers on properties + properties_extension) + one-shot
backfill from property_details.listing_events for pre-trigger history.
Tax reassessment forecast ND · Resets to sale price
- Current annual tax
- $1,880 · $157/mo
- Projected year-2 tax
- $1,880 · $157/mo
- Expected delta
- $0/yr ($0/mo · 0.0%)
ⓘ Screening estimate from a state-policy table — verify with the county assessor before closing.
Climate risk First Street
- Flood 1/10 Low FEMA zone X · 0% chance over 30 yrs
- Wildfire 7/10 Severe
- Heat 2/10 Low 7 d/yr ≥94°F today · 11 d/yr by 30 yrs out
- Wind 1/10 Low
- Air quality 3/10 Moderate 2 unhealthy d/yr today · 2 by 30 yrs out
Nearby sold comps map
Loading sold comps map…
Walkable amenities ~0.75 mi
Loading nearby amenities…
Taxation est. · year 1
- Rental income
- $14,904
- − Mortgage interest
- −$5,041
- − Property taxes
- −$1,880
- − Insurance
- −$450
- − Repairs & maintenance
- −$1,192
- − Management
- −$1,192
- − Depreciation
- −$2,618
- Taxable income
- $2,530
- Est. tax owed @ 24.0%
- −$607
- After-tax cash flow
- $3,173/yr
For passive investors: Depreciation is non-cash, so a rental often shows a tax loss while cash-flowing — sheltering income. Rental losses are passive: they offset passive income freely, and up to $25,000/yr can offset ordinary (W-2) income if you actively participate and your MAGI is under $100k (phasing out to $0 by $150k); unused losses carry forward. On sale, claimed depreciation is recaptured at up to 25%, and gains may owe capital-gains tax (a 1031 exchange can defer both). Figures are a year-1 estimate at your 24.0% rate — not tax advice; consult a CPA.
Schools (NCES district)
- District
- Devils Lake 1
- NCES district ID
- 3805040
- Math proficiency
- 34% ▼ -12.00%
- Reading proficiency
- 35% ▼ -12.00%
- Median HH income
- $47,687
- Composite
- 29.72/100
- National rank
- #6448
- State rank
- #35 of 53 in ND
Livability — Devils Lake
- Score
- 69/100
- State rank
- #97
- US rank
- #8421
Category grades
Schools grade is shown separately in the Schools card above.
Census & demographics
- Census place
- Devils Lake, ND
- Population (ZIP)
- 10,046
Population outlook (Ramsey County) Hauer SSP2
- Today (2025)
- 11,910 people
- By 2030
- 12,089 · +1.5%
- By 2040
- 12,568 · +5.5%
- By 2050
- 13,136 · +10.3%
- By 2075
- 16,531 · +38.8%
- By 2100
- 20,500 · +72.1%
Race, ethnicity, and origin ACS 2023
- Neighborhood character
- Predominantly White (80%)
- Race & ethnicity
- White 80% Native American 11% Two or more races 6% Hispanic / Latino 3%
- Common ancestry
- Portuguese 30% Lithuanian 3% Scottish 2%
- Foreign-born
- 2%
- Languages at home
- 96% English-only · Tagalog/Filipino 1% German/W. Germanic 1%
Political lean MEDSL · Ramsey
- 2024 margin
- Solid R (+40.3) · D 29.1% · R 69.3% · Other 1.6%
- 2008→2024 swing
- -39.3pp toward R · 2008: -1.0pp · 2024: -40.3pp
- All cycles
- 2024: R+40.3 2020: R+36.1 2016: R+32.8 2012: R+10.0 2008: R+1.0
Not yet ingested
- Civics
- —
Market trends
- HPI YoY
- ▼ -89.81%
- Current HPI
- 220.5598
- Rent YoY
- —
- Metro
- —
- State GDP YoY
- ▲ 2.09%
- F500 in state
- 2
Industry mix (Fortune 500 HQ in ND)
| Industry | F500 HQs | Revenue |
|---|---|---|
| Utilities / Construction | 1 | $6B |
|
||
Price history
-30.8% since first listed4 events — show timeline
- 2026-04-30 Listed $90,000 GFAAR
- 2025-08-06 Price Changed $100,000 GFAAR
- 2025-07-10 Price Changed $125,000 GFAAR
- 2025-04-15 Listed $130,000 GFAAR
Property tax history
+8.0%/yrLatest (2025): $1,880 · +35.5% YoY. Source: county tax records.
Cash-flow waterfall
monthlySold comps — $/sqft
last 12 mo · ≤1 miLoading sold comps…