 Multi-family
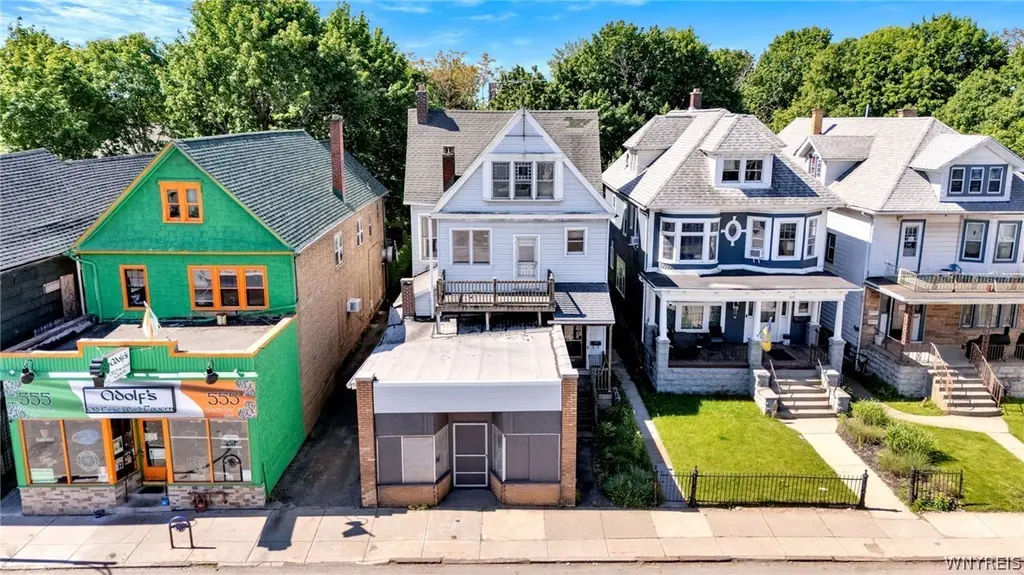
553 S Park Ave · Buffalo, NY
Flood risk 6/10 · Moderate
- FEMA flood zone
- X (unshaded)
- Chance of flooding over 30 yrs
- 0.74%
- Est. flood insurance / yr
- $473 – $860
Fire risk 1/10 · Minimal
- Est. fire insurance / yr
- $691 – $1,283
Heat risk 3/10 · Minor
- Hot days now (above 91°F)
- 7 days/yr
- Hot days in 30 yrs
- 15 days/yr
Wind risk 1/10 · Minimal
- Chance of severe wind over 30 yrs
- —
Air-quality risk 4/10 · Minor
- Unhealthy air days now
- 4 days/yr
- Unhealthy air days in 30 yrs
- 9 days/yr
Risk factors via First Street. Map © Google.
Why this score? — see what drove the B grade
The composite is a weighted blend of 9 inputs, each scored 0–100. Each bar is that input's sub-score; the figure is the points it added to the 100-point composite (weight × sub-score).
- Cash flow +30.0/30.0
- 1% rule +10.0/10.0
- DSCR +10.0/10.0
- ARV discount +7.5/15.0
- Rent growth +3.9/5.0
- Livability +3.9/5.0
- Appreciation +3.3/10.0
- Schools +3.3/10.0
- Condition / age +2.2/5.0
$199,900
🖨 Deal sheet 📄 Offer letter ✓ Due diligence
Multi-family units
County records classify this as Multi-Family (2-4 Unit). Listing-text estimate: 1 unit. estimate disagrees with records
Listing remarks
Welcome to 553 South Park Avenue, a remarkable piece of Buffalo history originally commissioned in 1894 by a prominent sea merchant and ideally located along the South Park corridor in the heart of the revitalizing First Ward. Offering over 4,000 square feet, this unique two-unit property blends historic character, flexible mixed-use potential, and exceptional storage. Each apartment features 3 bedrooms, formal living and dining rooms, a full bath, and abundant original charm. Historic details include six original pocket doors, soaring 10-foot first-floor ceilings, quarter-sawn oak woodwork, ornate fireplace surrounds, and preserved period craftsmanship throughout. The first-floor apartment
Key facts
- Exceptional storage
- 6,480 sq ft lot
- 3 garage spots
Tags
Property features AI
Finance
- Financial info: Multi-unit (2 total units); Owner pays trash collection and water for rentals; Operating expenses include trash and water/sewer (see remarks)
Exterior
- Parking: 3-car garage; Additional parking available; Two or more spaces
- Utilities: Electricity connected (circuit breakers and fuses); Public water connected; Sewer connected; Cable available
- Home design: 3-story building; Existing/resale property; Commercial zoning
- Construction: Brick and vinyl siding construction; Copper plumbing; Stone foundation; Roof: asphalt, shingle, rubber/membrane, flat and pitched elements
- Exterior features: Partial fencing; Near public transit; Rectangular lot; Main thoroughfare frontage
Interior
- Kitchen: Gas water heater listed (appliance); No specific kitchen appliance list provided
- Bedrooms: Two-unit property (unit-level bedroom counts not provided)
- Flooring: Carpet; Hardwood; Vinyl; Varies
- Bathrooms: 2 full bathrooms (total)
- Heating & cooling: Gas heating; Zoned heating and cooling; Baseboard heating; Hot water heating
- Interior features: Attic; Ceiling fan(s); Full basement with sump pump; 4 fireplaces
- Laundry & utility: Separate gas meters for each unit; Separate electric meters for each unit
Neighborhood map
What this means for you Summary
Snapshot
- This is a 6-bed/2.0-bath multifamily listed at $200k. Condition is rated fair.
Deal economics
- At list price, monthly cash flow is $2k ($28k/yr) — positive.
- The deal already cash-flows at list — no discount required.
- Meets the 1% rule at list price ($5k rent vs $200k).
- Recommended offer: $197k (1.5% below list) — sets the bar for market timing.
- Cap rate 20.1% vs local median 8.0% in Buffalo — top-decile yield for the area; either an underpriced asset or a hidden risk that comps aren't pricing in. Stress-test before assuming the spread holds.
Location & tenants
- Location reads 77/100 on livability (#195 in NY, #3,011 nationally) — a middle-class / working-renter tenant base. Strengths: commute A+, housing A+, health & safety A+; Watch: crime F, employment D-.
- Buffalo City School District (urban): math 41% / reading 40% proficiency, ranked #535 of 590 in NY (top 91%) — families likely to look elsewhere, expect single-tenant / working-renter base with shorter leases; 75% free/reduced lunch — lower-income household profile, screen leases tightly.
- Market conditions: Rents rising fast (+5.5%/yr); 33 active listings in the ZIP; lower-income renter base — watch delinquency; 1,244 units permitted in Erie County in 2024 (563 in 5+ unit buildings).
- At $4,669/mo this rent would consume 199% of the median local household income ($28k/yr) (locally 945% of renters already pay >50% of income on rent) — very limited rent-growth headroom before tenants either downsize or default.
Forward outlook
- Local home prices are declining (-3.0%/yr); year-one equity from $1k of loan paydown is wiped out by about $6k of value loss. Plan a longer hold.
- At projected returns (-3.0% appreciation + 5.5% rent growth), your $56k cash investment doubles in ~3 years — after that, you're playing with house money.
Negotiation context
- It's been on market 15 days — a 2% lower offer ($197k) is reasonable based on typical stale-listing flexibility.
Risks & watch-outs
- Watch-outs: built in 1900 — expect roof / HVAC / electrical / plumbing capex.
- Climate carrying-cost: major flood risk — expect insurance premiums to compound above CPI over the hold.
Questions for the listing agent
- Have any recent inspections been done? Can we get a copy of the seller's disclosures and any deferred-maintenance estimates?
- Built in 1900 — when were the roof, HVAC, electrical panel, plumbing, and water heater last replaced?
- Is there a deadline driving the sale (1031 exchange, divorce, estate, relocation)? That informs how much negotiation room exists.
- Crime grade is F in this area — have there been break-ins, vandalism, or insurance claims at this property in the last 3 years? What carrier currently insures it and at what premium?
- What's the average days-on-market for RENTAL listings here right now (not sales)? A rising rental-DOM trend means longer vacancies and softer asking-rent achievability than the comps imply.
- What's the recent tenant-quality profile in this submarket — average credit score on applications, eviction rate, late-payment / NSF rate, and stable-employment percentage? A property-management company in the area should have these aggregated.
- How much new apartment / multifamily construction is in the pipeline within 1–3 miles? Heavy new supply (>2% of stock underway) typically softens rents 12–24 months out; light construction supports rent growth.
Investment metrics
- 1% rule
- 2.34% ✓
- Cap rate
- 20.14%
- Cash-on-cash
- 49.46%
- DSCR
- 3.20
- GRM
- 3.6
CMA / ARV
- ARV (on-the-fly)
- $131,942
- Comps found
- 1
Show comp detail 1 sale within ~0.75 mi
| Address | Dist | Beds/Ba | Sqft | Sold | Price | $/sf | Match |
|---|---|---|---|---|---|---|---|
| 157 Mackinaw St | 0.26mi | 6/2.0 | 3,074 (-14%) | 14mo | $115,000 | $37 | 53 |
Match score weights: distance 35% · size 25% · config 20% · recency 20%. Top-matched comps best support the ARV.
Projected returns pro-forma
-3.0% appreciation · 5.48% rent growth · sell at horizon
- IRR
- 49.9%
- Equity multiple
- 3.26×
- Total profit
- $126,554
- Equity at exit
- $29,806
- IRR
- 56.4%
- Equity multiple
- 7.28×
- Total profit
- $351,237
- Equity at exit
- $17,284
Cash invested: $55,972 (down + closing). Projections, not guarantees.
Landlord ↔ Tenant lean methodology
- Overall (STATE)
- 15 Strongly Tenant-Friendly
- State New York
- 15 Strongly Tenant-Friendly · D+10
- County
- — inherits STATE
- City
- — inherits STATE
ZIP-level market 14204
- Home prices YoY
- -1.1%
- Rents YoY
- 5.5%
- Active inventory
- 33
- Price-to-rent
- 7.1×
Monthly cashflow live
- Estimated rent
- $4,669 high interval (Pro) →
- Mortgage (P&I)
- −$1,048
- Tax est. 1.5%
- −$250 /mo · $2,998/yr
- Insurance
- −$83
- HOA
- −$0
- Vacancy / Maint / Mgmt
- −$980
- Net cashflow
- $2,307
Break-even live
2-unit breakdown (identical units grouped — click to expand)
| Units | Beds | Baths | Est. rent |
|---|---|---|---|
| 2× units | 3 | 1.5 | $4,668 |
| #1 | 3 | 1.5 | $2,334 |
| #2 | 3 | 1.5 | $2,334 |
| Total (2 units) | $4,669 | ||
UW: 25.0% down · 7.5% · 30yr · 1.5% tax · 5.0% vac · 8.0% maint · 8.0% mgmt
Financing live
Cash to close
- Down payment
- $49,975
- Closing costs
- $5,997
- Reserves months
- —
- Total cash needed
- —
Loan-product check · same deal, 3 products live
Conventional
25% down · 7.5% · 30yr
- Down + closing
- —
- Monthly P&I
- —
- Monthly cashflow
- —
- DSCR
- —
- Eligible?
- —
Personal DTI + credit; lowest rate.
DSCR
20% down · 8.5% · 30yr
- Down + closing
- —
- Monthly P&I
- —
- Monthly cashflow
- —
- DSCR
- —
- Eligible?
- —
No personal income docs; deal must DSCR.
Hard money
10% down · 12.0% · 12mo
- Down + closing
- —
- Monthly P&I
- —
- Monthly cashflow
- —
- DSCR
- —
- Eligible?
- —
Short-term bridge; refi at stabilization.
Listing history 11 events
-
2026-06-18days on market $199,900 Active 15 DOM
-
2026-06-17days on market $199,900 Active 14 DOM
-
2026-06-16days on market $199,900 Active 13 DOM
-
2026-06-15days on market $199,900 Active 12 DOM
-
2026-06-13days on market $199,900 Active 10 DOM
-
2026-06-13days on market $199,900 Active 9 DOM
-
2026-06-10days on market $199,900 Active 7 DOM
-
2026-06-09days on market $199,900 Active 6 DOM
-
2026-06-08days on market $199,900 Active 5 DOM
-
2026-06-07remarks 699-char remark
-
2026-06-07$199,900 Active 4 DOM
ⓘ Source: listings_history table (triggers on properties + properties_extension) + one-shot
backfill from property_details.listing_events for pre-trigger history.
Climate risk First Street
- Flood 6/10 Major FEMA zone X (unshaded) · 74% chance over 30 yrs
- Wildfire 1/10 Low
- Heat 3/10 Moderate 7 d/yr ≥91°F today · 15 d/yr by 30 yrs out
- Wind 1/10 Low
- Air quality 4/10 Moderate 4 unhealthy d/yr today · 9 by 30 yrs out
Nearby sold comps map
Loading sold comps map…
Walkable amenities ~0.75 mi
Loading nearby amenities…
Taxation est. · year 1
- Rental income
- $56,028
- − Mortgage interest
- −$11,198
- − Property taxes
- −$2,998
- − Insurance
- −$1,000
- − Repairs & maintenance
- −$4,482
- − Management
- −$4,482
- − Depreciation
- −$5,815
- Taxable income
- $26,053
- Est. tax owed @ 24.0%
- −$6,253
- After-tax cash flow
- $21,432/yr
For passive investors: Depreciation is non-cash, so a rental often shows a tax loss while cash-flowing — sheltering income. Rental losses are passive: they offset passive income freely, and up to $25,000/yr can offset ordinary (W-2) income if you actively participate and your MAGI is under $100k (phasing out to $0 by $150k); unused losses carry forward. On sale, claimed depreciation is recaptured at up to 25%, and gains may owe capital-gains tax (a 1031 exchange can defer both). Figures are a year-1 estimate at your 24.0% rate — not tax advice; consult a CPA.
Condition & rehab AI · 14 photos
This multi-family home requires moderate renovations to update the kitchen and bathrooms, paint the exterior and interior, and replace worn flooring and cabinets. These updates will significantly increase its resale and rental value.
Repairs flagged
- Major Kitchen cabinets — Severe wear and tear, likely requiring replacement.
- Major Bathroom fixtures — Outdated and worn, likely requiring replacement.
- Major Flooring — Worn and outdated, likely requiring replacement.
- Major Paint — Worn and outdated, likely requiring repainting.
Value-add opportunities
- Both Updating the kitchen and bathrooms — Both updates will significantly increase the home's appeal and value for both resale and rental.
- Both Painting the exterior and interior — Fresh paint will improve curb appeal and interior aesthetics, enhancing both resale and rental value.
Renovation cost estimate screening
| Repair item | Severity | Est. cost |
|---|---|---|
| Kitchen cabinets · Severe wear and tear, likely requiring replacement. | Major | $15,000–50,000 |
| Bathroom fixtures · Outdated and worn, likely requiring replacement. | Major | $15,000–50,000 |
| Flooring · Worn and outdated, likely requiring replacement. | Major | $15,000–50,000 |
| Paint · Worn and outdated, likely requiring repainting. | Major | $15,000–50,000 |
| Total estimated repair cost · 4 items | $60,000–200,000 |
Value-add ROI direction
- Both Updating the kitchen and bathrooms — Both updates will significantly increase the home's appeal and value for both resale and rental. ↑
- Both Painting the exterior and interior — Fresh paint will improve curb appeal and interior aesthetics, enhancing both resale and rental value. ↑
ⓘ Cost ranges are severity-bucket heuristics (US national rule-of-thumb). Get contractor quotes + a written scope before underwriting a rehab budget.
Schools (NCES district)
- District
- Buffalo City School District
- NCES district ID
- 3605850
- Math proficiency
- 41% ▲ 11.00%
- Reading proficiency
- 40% ▲ 7.00%
- Median HH income
- $31,665
- Composite
- 33.17/100
- National rank
- #5544
- State rank
- #535 of 590 in NY
Livability — Buffalo
- Score
- 77/100
- State rank
- #195
- US rank
- #3011
Category grades
Schools grade is shown separately in the Schools card above.
Census & demographics
- Census place
- Buffalo, NY
- County
- Erie County · 714,559 people
- City population
- 440,021
- Metro
- Buffalo-Cheektowaga, NY
- Population (ZIP)
- 7,932
- Household income
- $28,182
- Rent vs Own
- Severe rent burden
- 945.0
Population outlook (Erie County) Hauer SSP2
- Today (2025)
- 933,037 people
- By 2030
- 935,181 · +0.2%
- By 2040
- 928,531 · -0.5%
- By 2050
- 905,725 · -2.9%
- By 2075
- 834,037 · -10.6%
- By 2100
- 708,033 · -24.1%
Race, ethnicity, and origin ACS 2023
- Neighborhood character
- Diverse neighborhood (Simpson 0.60)
- Race & ethnicity
- Black 58% White 19% Hispanic / Latino 18% Two or more races 4%
- Hispanic origin (detail)
- Puerto Rican 14% Dominican 1%
- Common ancestry
- Romanian 2% Subsaharan African 1%
- Foreign-born
- 6% · Canada
- Languages at home
- 81% English-only · Spanish 14% French/Haitian/Cajun 2% Russian/Polish/Slavic 1%
Political lean MEDSL · Erie
- 2024 margin
- Lean D (+9.7) · D 54.8% · R 45.2%
- 2008→2024 swing
- -7.9pp toward R · 2008: 17.5pp · 2024: 9.7pp
- All cycles
- 2024: D+9.7 2020: D+14.7 2016: D+4.8 2012: D+15.6 2008: D+17.5
Not yet ingested
- Civics
- —
Market trends
- HPI YoY
- ▼ -3.36%
- Current HPI
- 312.6232
- Rent YoY
- ▲ 5.48%
- Metro
- Buffalo-Cheektowaga, NY
- State GDP YoY
- ▲ 2.60%
- F500 in state
- 92
Industry mix (Fortune 500 HQ in NY)
| Industry | F500 HQs | Revenue |
|---|---|---|
| Financial Services | 10 | $950B |
|
||
| Consumer Goods | 9 | $162B |
|
||
| Insurance | 4 | $225B |
|
||
| Telecommunications | 2 | $144B |
|
||
| Pharmaceuticals | 2 | $112B |
|
||
| Media / Entertainment | 2 | $69B |
|
||
Price history
1 event — show timeline
- 2026-06-03 Listed $199,900 WNYREIS
Cash-flow waterfall
monthlySold comps — $/sqft
last 12 mo · ≤1 miLoading sold comps…