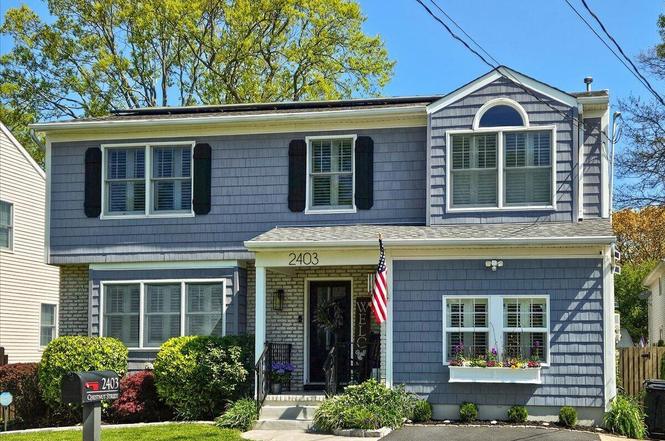
2403 Chestnut St · Point Pleasant, NJ
Flood risk 1/10 · Minimal
- FEMA flood zone
- X (unshaded)
- Chance of flooding over 30 yrs
- 0.0%
- Est. flood insurance / yr
- $507 – $1,088
Fire risk 1/10 · Minimal
- Est. fire insurance / yr
- $526 – $976
Heat risk 8/10 · Major
- Hot days now (above 97°F)
- 7 days/yr
- Hot days in 30 yrs
- 15 days/yr
Wind risk 8/10 · Major
- Chance of severe wind over 30 yrs
- 80.0%
Air-quality risk 3/10 · Minor
- Unhealthy air days now
- 3 days/yr
- Unhealthy air days in 30 yrs
- 5 days/yr
Risk factors via First Street. Map © Google.
Why this score? — see what drove the F grade
The composite is a weighted blend of 9 inputs, each scored 0–100. Each bar is that input's sub-score; the figure is the points it added to the 100-point composite (weight × sub-score).
- Cash flow +6.4/30.0
- Rent growth +5.0/5.0
- Schools +4.5/10.0
- Livability +3.8/5.0
- Condition / age +2.5/5.0
- 1% rule +0.9/10.0
- DSCR +0.7/10.0
- ARV discount +0.0/15.0
- Appreciation +0.0/10.0
$869,000
🖨 Deal sheet 📄 Offer letter ✓ Due diligence
Listing remarks MLS
Immaculate 4 Bedroom / 2.5 Bathroom home in POINT PLEASANT BORO!! Steps to the Middle and High School as well as the Ball Fields. Beautiful Corian Kitchen with Stainless Steel Appliances. New Custom Plantation Shutters in the Living Room. Natural Hardwood Floors throughout the entire home except the Bedrooms where there is W/W Berber Carpet. ALL 3 Bathrooms Updated. Laundry on Second Floor. The Backyard is Perfect for Entertaining. In Ground... Heated... Salt Water Pool. Brand NEW Liner. THIS IS A MUST SEE!
Key facts
- 4,791 sq ft lot
- Garage
- Pool
Neighborhood map
What this means for you Summary
Snapshot
- This is a 4-bed/3.0-bath single-family listed at $869k.
Deal economics
- At list price, monthly cash flow is $-2k ($-18k/yr) — negative.
- To cash-flow at today's rent, offer at most $600k (31.0% below list).
- To meet the 1% rule (rent ≥ 1% of price), the offer needs to be $514k (40.8% below list).
- Recommended offer: $514k (40.8% below list) — sets the bar for 1% rule.
- Cap rate 4.2% vs local median 2.8% in Point Pleasant — top-decile yield for the area; either an underpriced asset or a hidden risk that comps aren't pricing in. Stress-test before assuming the spread holds.
Location & tenants
- Location reads 76/100 on livability (#136 in NJ, #3,574 nationally) — a middle-class / working-renter tenant base. Strengths: crime A+, employment A+, housing A+; Watch: amenities F, commute F, cost of living F.
- Point Pleasant Borough School District (suburban): math 44% / reading 55% proficiency, ranked #132 of 472 in NJ (top 28%) — families likely to look elsewhere, expect single-tenant / working-renter base with shorter leases; only 10% free/reduced lunch — higher-income household profile.
- Market conditions: Rents rising fast (+11.7%/yr); 163 active listings in the ZIP; 13 comparable units currently listed for rent nearby; rentals leasing fast (median 5d on market — plan ~1-2 weeks tenant-placement turnaround); high-income renter base; 4,434 units permitted in Ocean County in 2024 (868 in 5+ unit buildings).
- At $5,142/mo this rent would consume 50% of the median local household income ($123k/yr) (locally 388% of renters already pay >50% of income on rent) — very limited rent-growth headroom before tenants either downsize or default.
Forward outlook
- Local home prices are declining (-3.0%/yr); year-one equity from $6k of loan paydown is wiped out by about $26k of value loss. Plan a longer hold.
- Ocean County population projected to shrink 8% by 2050 — rents likely to lag national; underwrite the cash flow, not the appreciation.
Negotiation context
- Only 5 days on market — expect competitive offers; lowballing is unlikely to land.
- 2 sale attempts since 7y ago with the ask held roughly flat each time — persistent listings suggest the price (not the market) is what's stuck; bring a comps-based counter.
- Current owner paid $550k; list at $869k implies a 58% gain — meaningful room to come down on a strong offer.
Risks & watch-outs
- Climate carrying-cost: severe wind risk, 80% chance of damaging wind over 30y; extreme-heat days projected 7→15/yr by 2055 (HVAC capex compounding) — expect insurance premiums to compound above CPI over the hold.
Questions for the listing agent
- What do current leases actually rent for vs. the listed asking? Can we see a recent rent roll and the last 12 months of T-12 income?
- Is there a deadline driving the sale (1031 exchange, divorce, estate, relocation)? That informs how much negotiation room exists.
- Schools are A-rated — typically a magnet for longer-tenancy family renters. What's the average tenant stay here, and is there a school-zone premium baked into asking?
- The area grade is low — what's the realistic commute time and amenity access for the typical tenant pool here? Any planned neighborhood developments (good or bad) we should know about?
- What's the average days-on-market for RENTAL listings here right now (not sales)? A rising rental-DOM trend means longer vacancies and softer asking-rent achievability than the comps imply.
- What's the recent tenant-quality profile in this submarket — average credit score on applications, eviction rate, late-payment / NSF rate, and stable-employment percentage? A property-management company in the area should have these aggregated.
- How much new for-sale + rental construction is in the pipeline within 1–3 miles? Heavy new supply typically softens prices + rents 12–24 months out; constrained supply supports both.
Investment metrics
- 1% rule
- 0.59% ✗
- Cap rate
- 4.19%
- Cash-on-cash
- -7.52%
- DSCR
- 0.67
- GRM
- 14.1
CMA / ARV
- ARV (on-the-fly)
- $735,462
- Comps found
- 12
Show comp detail 12 sales within ~0.75 mi
| Address | Dist | Beds/Ba | Sqft | Sold | Price | $/sf | Match |
|---|---|---|---|---|---|---|---|
| 2403 Chestnut St | 0.00mi | 4/2.5 | 1,803 (+10%) | 1mo | $935,000 | $519 | 81 |
| 1219 Barton Ave | 0.34mi | 4/2.0 | 1,547 (-6%) | 6mo | $653,000 | $422 | 66 |
| 1213 Sunset Ave | 0.40mi | 4/2.5 | 1,785 (+9%) | 1mo | $670,000 | $375 | 63 |
| 2213 Kilkare Pkwy | 0.37mi | 4/2.0 | 1,768 (+8%) | 4mo | $650,000 | $368 | 62 |
| 1204 Treeneedle Rd | 0.54mi | 3/2.0 (-1) | 1,600 (-2%) | 6mo | $600,000 | $375 | 57 |
| 1129 Roe Ave | 0.73mi | 3/2.0 (-1) | 1,636 (-0%) | 1mo | $650,000 | $397 | 56 |
| 2213 Rogers Rd | 0.38mi | 3/2.0 (-1) | 1,474 (-10%) | 1mo | $670,000 | $455 | 56 |
| 805 Hastings Ln | 0.38mi | 3/2.0 (-1) | 1,814 (+11%) | 3mo | $725,000 | $400 | 53 |
| 1107 Hollywood Blvd | 0.62mi | 4/3.0 | 1,770 (+8%) | 6mo | $795,000 | $449 | 53 |
| 3105 Cambridge Dr | 0.58mi | 4/2.0 | 1,450 (-12%) | 4mo | $675,000 | $466 | 47 |
| 915 Brooks Rd | 0.53mi | 3/2.5 (-1) | 1,470 (-10%) | 7mo | $731,000 | $497 | 45 |
| 1412 Chicopee Ave | 0.72mi | 4/2.5 | 1,840 (+12%) | 4mo | $850,000 | $462 | 41 |
Match score weights: distance 35% · size 25% · config 20% · recency 20%. Top-matched comps best support the ARV.
Projected returns pro-forma
-3.0% appreciation · 8.0% rent growth · sell at horizon
- IRR
- -24.6%
- Equity multiple
- 0.13×
- Total profit
- $-210,938
- Equity at exit
- $129,571
- IRR
- -10.6%
- Equity multiple
- 0.24×
- Total profit
- $-185,775
- Equity at exit
- $75,135
Cash invested: $243,320 (down + closing). Projections, not guarantees.
Landlord ↔ Tenant lean methodology
- Overall (STATE)
- 21 Tenant-Leaning
- State New Jersey
- 21 Tenant-Leaning · D+6
- County
- — inherits STATE
- City
- — inherits STATE
ZIP-level market 08742
- Rents YoY
- 11.7%
- Active inventory
- 163
- Price-to-rent
- 14.1×
Monthly cashflow live
- Estimated rent
- $5,142 high interval (Pro) →
- Mortgage (P&I)
- −$4,557
- Tax from tax record
- −$668 /mo · $8,019/yr
- Insurance
- −$362
- HOA
- −$0
- Vacancy / Maint / Mgmt
- −$1,080
- Net cashflow
- $-1,525
Break-even live
UW: 25.0% down · 7.5% · 30yr · 1.5% tax · 5.0% vac · 8.0% maint · 8.0% mgmt
Financing live
Cash to close
- Down payment
- $217,250
- Closing costs
- $26,070
- Reserves months
- —
- Total cash needed
- —
Loan-product check · same deal, 3 products live
Conventional
25% down · 7.5% · 30yr
- Down + closing
- —
- Monthly P&I
- —
- Monthly cashflow
- —
- DSCR
- —
- Eligible?
- —
Personal DTI + credit; lowest rate.
DSCR
20% down · 8.5% · 30yr
- Down + closing
- —
- Monthly P&I
- —
- Monthly cashflow
- —
- DSCR
- —
- Eligible?
- —
No personal income docs; deal must DSCR.
Hard money
10% down · 12.0% · 12mo
- Down + closing
- —
- Monthly P&I
- —
- Monthly cashflow
- —
- DSCR
- —
- Eligible?
- —
Short-term bridge; refi at stabilization.
Rent comps 13 comps
| Address | Beds | Baths | Sqft | Rent | $/sqft | DOM | Units | Dist |
|---|---|---|---|---|---|---|---|---|
| 1414 Treeneedle Rd Point Pleasant Boro, NJ | 3.0 | 2.0 | 1640 | $3,000 | $1.83 | 24d | 1 | 0.68mi |
| 900 Ocean Ave Unit 108 Point Pleasant Beach, NJ | 3.0 | 2.0 | 1900 | $20,000 | $10.53 | 1d | 1 | 0.88mi |
| 900 Ocean Ave Unit 108 Point Pleasant Beach, NJ | 3.0 | 2.0 | 1900 | $20,000 | $10.53 | 10d | 1 | 0.88mi |
| 900 Ocean Ave Point Pleasant Beach, NJ | 3.0 | 3.5 | 1716 | $14,250 | $8.30 | 18d | 2 | 0.88mi |
| 706 South St Point Pleasant Boro, NJ | 3.0 | 1.0 | 1500 | $2,750 | $1.83 | 4d | 1 | 0.99mi |
| 1632 Center St Unit 1545886P Point Pleasant, NJ | 3.0 | 1.0 | 1496 | $4,167 | $2.79 | 13d | 1 | 1.02mi |
| 711 Mount Pl Point Pleasant Boro, NJ | 5.0 | 3.0 | 2240 | $30,000 | $13.39 | 1d | 1 | 1.13mi |
| 258 Osborne Ave Bay Head, NJ | 4.0 | 2.0 | 1902 | $7,000 | $3.68 | 1d | 1 | 1.15mi |
| 242 Osborne Ave Bay Head, NJ | 4.0 | 3.0 | 1739 | $10,000 | $5.75 | 1d | 1 | 1.19mi |
| 818 Trenton Ave Point Pleasant Beach, NJ | 4.0 | 1.5 | 1970 | $5,500 | $2.79 | 1d | 1 | 1.20mi |
| 218 Bridge Ave Bay Head, NJ | 3.0 | 2.0 | 1556 | $4,750 | $3.05 | 43d | 1 | 1.21mi |
| 214 Howe St Point Pleasant Boro, NJ | 3.0 | 1.5 | 1260 | $4,500 | $3.57 | 5d | 1 | 1.22mi |
| 203 Bridge Ave Point Pleasant Boro, NJ | 3.0 | 2.0 | 1832 | $3,100 | $1.69 | 24d | 1 | 1.24mi |
Listing history 10 events
-
2026-03-14status Pending
-
2026-03-09$869,000 Active
-
2026-03-03historical $869,000
-
2019-08-27soldstatus $550,000
-
2019-08-22soldstatus $550,000 Sold 522-char remark
Show marketing remark (522 chars)
Immaculate 4 Bedroom / 2.5 Bathroom home in POINT PLEASANT BORO!! Steps to the Middle and High School as well as the Ball Fields. Beautiful Corian Kitchen with Stainless Steel Appliances. New Custom Plantation Shutters in the Living Room. Natural Hardwood Floors throughout the entire home except the Bedrooms where there is W/W Berber Carpet. ALL 3 Bathrooms Updated. Laundry on Second Floor. The Backyard is Perfect for Entertaining. In Ground... Heated... Salt Water Pool. Brand NEW Liner. THIS IS A MUST SEE!
-
2019-07-12status Pending 522-char remark
Show marketing remark (522 chars)
Immaculate 4 Bedroom / 2.5 Bathroom home in POINT PLEASANT BORO!! Steps to the Middle and High School as well as the Ball Fields. Beautiful Corian Kitchen with Stainless Steel Appliances. New Custom Plantation Shutters in the Living Room. Natural Hardwood Floors throughout the entire home except the Bedrooms where there is W/W Berber Carpet. ALL 3 Bathrooms Updated. Laundry on Second Floor. The Backyard is Perfect for Entertaining. In Ground... Heated... Salt Water Pool. Brand NEW Liner. THIS IS A MUST SEE!
-
2019-07-07$549,000 Active 522-char remark
Show marketing remark (522 chars)
Immaculate 4 Bedroom / 2.5 Bathroom home in POINT PLEASANT BORO!! Steps to the Middle and High School as well as the Ball Fields. Beautiful Corian Kitchen with Stainless Steel Appliances. New Custom Plantation Shutters in the Living Room. Natural Hardwood Floors throughout the entire home except the Bedrooms where there is W/W Berber Carpet. ALL 3 Bathrooms Updated. Laundry on Second Floor. The Backyard is Perfect for Entertaining. In Ground... Heated... Salt Water Pool. Brand NEW Liner. THIS IS A MUST SEE!
-
1985-10-01soldstatus $95,000
-
1983-06-01soldstatus $15,000
-
1981-10-01soldstatus $10,000
ⓘ Source: listings_history table (triggers on properties + properties_extension) + one-shot
backfill from property_details.listing_events for pre-trigger history.
Tax reassessment forecast NJ · Partial reset (capped growth)
- Current annual tax
- $8,019 · $668/mo
- Projected year-2 tax
- $14,828 · $1,236/mo
- Expected delta
- +$6,810/yr (+$567/mo · 84.9%)
ⓘ Screening estimate from a state-policy table — verify with the county assessor before closing.
Climate risk First Street
- Flood 1/10 Low FEMA zone X (unshaded) · 0% chance over 30 yrs
- Wildfire 1/10 Low
- Heat 8/10 Severe 7 d/yr ≥97°F today · 15 d/yr by 30 yrs out
- Wind 8/10 Severe 80% chance of damaging wind over 30 yrs
- Air quality 3/10 Moderate 3 unhealthy d/yr today · 5 by 30 yrs out
Nearby sold comps map
Loading sold comps map…
Walkable amenities ~0.75 mi
Loading nearby amenities…
Taxation est. · year 1
- Rental income
- $61,710
- − Mortgage interest
- −$48,678
- − Property taxes
- −$8,019
- − Insurance
- −$4,345
- − Repairs & maintenance
- −$4,937
- − Management
- −$4,937
- − Depreciation
- −$25,280
- Taxable loss
- −$34,485
- Est. tax savings @ 24.0%
- +$8,276
- After-tax cash flow
- $-10,022/yr
For passive investors: Depreciation is non-cash, so a rental often shows a tax loss while cash-flowing — sheltering income. Rental losses are passive: they offset passive income freely, and up to $25,000/yr can offset ordinary (W-2) income if you actively participate and your MAGI is under $100k (phasing out to $0 by $150k); unused losses carry forward. On sale, claimed depreciation is recaptured at up to 25%, and gains may owe capital-gains tax (a 1031 exchange can defer both). Figures are a year-1 estimate at your 24.0% rate — not tax advice; consult a CPA.
Schools (NCES district)
- District
- Point Pleasant Borough School District
- NCES district ID
- 3413290
- Math proficiency
- 44% ▼ -15.00%
- Reading proficiency
- 55% ▼ -11.00%
- Median HH income
- $82,536
- Composite
- 45.44/100
- National rank
- #2619
- State rank
- #132 of 472 in NJ
Livability — Point Pleasant
- Score
- 76/100
- State rank
- #136
- US rank
- #3574
Category grades
Schools grade is shown separately in the Schools card above.
Census & demographics
- Census place
- Point Pleasant, NJ
- County
- Ocean County · 439,426 people
- City population
- 25,732
- Metro
- New York-Newark-Jersey City, NY-NJ-PA
- Population (ZIP)
- 25,732
- Household income
- $123,152
- Rent vs Own
- Severe rent burden
- 388.0
Population outlook (Ocean County) Hauer SSP2
- Today (2025)
- 586,991 people
- By 2030
- 581,403 · -1.0%
- By 2040
- 564,913 · -3.8%
- By 2050
- 538,149 · -8.3%
- By 2075
- 468,845 · -20.1%
- By 2100
- 350,297 · -40.3%
Race, ethnicity, and origin ACS 2023
- Neighborhood character
- Predominantly White (86%)
- Race & ethnicity
- White 86% Hispanic / Latino 10% Two or more races 5% Native American 1%
- Hispanic origin (detail)
- Mexican 4% Puerto Rican 2%
- Common ancestry
- Romanian 6% Slovak 2% Iranian 1%
- Foreign-born
- 8% · Canada, Jamaica
- Languages at home
- 89% English-only · Spanish 8% Russian/Polish/Slavic 1% Other Indo-European 1%
Political lean MEDSL · Ocean
- 2024 margin
- Solid R (+36.0) · D 31.4% · R 67.4% · Other 1.2%
- 2008→2024 swing
- -17.6pp toward R · 2008: -18.4pp · 2024: -36.0pp
- All cycles
- 2024: R+36.0 2020: R+28.7 2016: R+34.0 2012: R+17.7 2008: R+18.4
Not yet ingested
- Civics
- —
Market trends
- HPI YoY
- ▼ -467.19%
- Current HPI
- 389.4401
- Rent YoY
- ▲ 11.65%
- Metro
- New York-Newark-Jersey City, NY-NJ-PA
- State GDP YoY
- ▲ 2.05%
- F500 in state
- 34
Industry mix (Fortune 500 HQ in NJ)
| Industry | F500 HQs | Revenue |
|---|---|---|
| Consumer Goods | 3 | $31B |
|
||
| Pharmaceuticals | 2 | $153B |
|
||
| Technology | 2 | $21B |
|
||
| Insurance | 2 | $20B |
|
||
| Healthcare | 2 | $19B |
|
||
| Financial Services | 1 | $70B |
|
||
Price history
+8590.0% since first listed10 events — show timeline
- 2026-03-14 Pending — MOMLS
- 2026-03-09 Listed $869,000 MOMLS
- 2026-03-03 Coming Soon $869,000 MOMLS
- 2019-08-27 Sold (Public Records) $550,000 Public Records
- 2019-08-22 Sold (MLS) $550,000 MOMLS
- 2019-07-12 Pending — MOMLS
- 2019-07-07 Listed $549,000 MOMLS
- 1985-10-01 Sold (Public Records) $95,000 Public Records
- 1983-06-01 Sold (Public Records) $15,000 Public Records
- 1981-10-01 Sold (Public Records) $10,000 Public Records
Property tax history
+2.6%/yrLatest (2025): $8,019 · +6.0% YoY. Source: county tax records.
Cash-flow waterfall
monthlySold comps — $/sqft
last 12 mo · ≤1 miLoading sold comps…