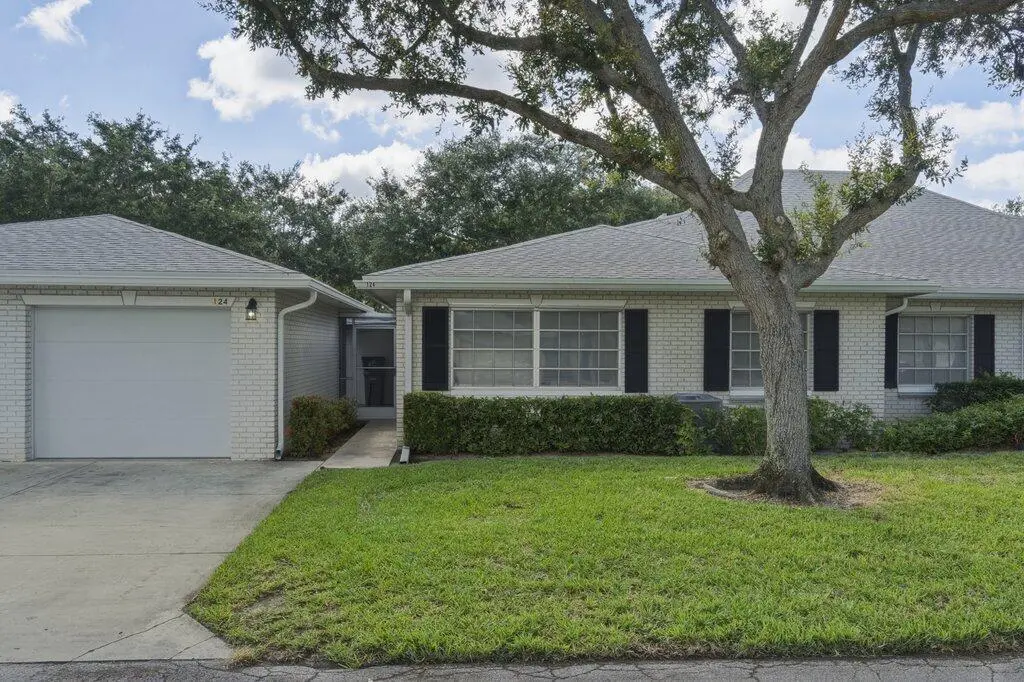
10098 S 42nd Dr · Boynton Beach, FL
Flood risk 4/10 · Minor
- FEMA flood zone
- X (unshaded)
- Chance of flooding over 30 yrs
- 0.2%
- Est. flood insurance / yr
- $507 – $1,088
Fire risk 1/10 · Minimal
- Est. fire insurance / yr
- $947 – $1,759
Heat risk 10/10 · Severe
- Hot days now (above 106°F)
- 7 days/yr
- Hot days in 30 yrs
- 29 days/yr
Wind risk 10/10 · Severe
- Chance of severe wind over 30 yrs
- 99.0%
Air-quality risk 2/10 · Minimal
- Unhealthy air days now
- 1 days/yr
- Unhealthy air days in 30 yrs
- 2 days/yr
Risk factors via First Street. Map © Google.
Why this score? — see what drove the D grade
The composite is a weighted blend of 9 inputs, each scored 0–100. Each bar is that input's sub-score; the figure is the points it added to the 100-point composite (weight × sub-score).
- Cash flow +12.6/30.0
- ARV discount +7.5/15.0
- 1% rule +4.7/10.0
- Schools +4.3/10.0
- Condition / age +4.0/5.0
- DSCR +3.8/10.0
- Livability +3.6/5.0
- Rent growth +2.4/5.0
- Appreciation +0.0/10.0
$249,000
🖨 Deal sheet 📄 Offer letter ✓ Due diligence
Listing remarks
Completely remodeled and move-in ready, this beautiful home offers the perfect combination of style, comfort, and value. The seller has already done all the work, so there's nothing left to do but move in and enjoy. Proudly listed at its appraised value, this is an incredible opportunity in one of the area's most sought-after communities. The low-maintenance lifestyle includes cable, exterior insurance, roof maintenance, lawn care, water, sewer, and trash. Residents also enjoy outstanding amenities, including heated pools, a fitness center, tennis courts, pickleball, and more. Conveniently located and priced to sell, this home is a must-see.
Key facts
- Move-in ready
- Heated pools
- Remodeled
Tags
Property features AI
Finance
- Other: Senior community
- Financial info: Monthly association amount reported as $682 (paid quarterly)
- HOA & community: Community association with quarterly HOA fees; HOA amenities include clubhouse and pickleball courts; HOA covers cable TV, insurance, grounds maintenance, pest control, security, water, and common areas
Exterior
- Parking: Attached garage with one enclosed space and one covered space (two parking spaces total)
- Security: Community includes security as part of association services
- Utilities: Public water; Public sewer; Cable connected; Electricity available; Water and sewer connected
- Home design: Villa; Single-story (one level); Resale property; Faces west
- Construction: CBS construction; Tile roof
- Exterior features: Not waterfront; Clubhouse and pickleball courts available in the community
Interior
- Kitchen: Electric range; Microwave; Dishwasher
- Bedrooms: Two main-level bedrooms
- Flooring: Vinyl flooring
- Bathrooms: Two full bathrooms, both on the main level
- Heating & cooling: Central individual heating; Central air conditioning
- Interior features: No notable built-in interior features listed
- Laundry & utility: Electric water heater
Neighborhood map
What this means for you Summary
Snapshot
- This is a 2-bed/2.0-bath single-family listed at $249k. Condition is rated good.
Deal economics
- At list price, monthly cash flow is $-30 ($-362/yr) — negative.
- To cash-flow at today's rent, offer at most $245k (1.8% below list).
- To meet the 1% rule (rent ≥ 1% of price), the offer needs to be $243k (2.5% below list).
- Recommended offer: $243k (2.5% below list) — sets the bar for 1% rule.
- Cap rate 6.1% vs local median 4.3% in Boynton Beach — top-decile yield for the area; either an underpriced asset or a hidden risk that comps aren't pricing in. Stress-test before assuming the spread holds.
Location & tenants
- Location reads 72/100 on livability (#351 in FL) — a middle-class / working-renter tenant base. Strengths: housing A+, health & safety B+, cost of living B; Watch: amenities D+, crime D-, commute F.
- Palm Beach (suburban): math 46% / reading 53% proficiency, ranked #34 of 73 in FL (top 47%) — families likely to look elsewhere, expect single-tenant / working-renter base with shorter leases.
- Zoned schools: Crosspointe Elementary School (math 36% / reading 45%, grade F, #1,471 of 2,144 statewide, top 69%, 652 students, 75% FRL); Congress Community Middle School (math 21% / reading 28%, grade F, #522 of 571 statewide, top 93%, 988 students, 72% FRL); Boynton Beach Community High (math 13% / reading 25%, grade F, #565 of 667 statewide, top 85%, 1,547 students, 65% FRL) — zoned schools average 71% FRL vs 52% district-wide (19 pts higher); higher-poverty schools than district average — tighter screening recommended.
- Zoned-school proficiency averages 28% at this address vs 50% district-wide (-22 pts) — the specific schools serving this property underperform the Palm Beach average; the district grade overstates school quality for this exact location.
- Market conditions: Rents soft (-0.6%/yr); 445 active listings in the ZIP; 40 comparable units currently listed for rent nearby; rentals at typical pace (median 24d on market — plan ~3-4 weeks tenant-placement turnaround); solid renter incomes; 3,974 units permitted in Palm Beach County in 2024 (1,012 in 5+ unit buildings).
- This rent runs 38% of the median local income ($76k/yr) — at the standard rent-burdened threshold; future hikes will face affordability resistance.
Forward outlook
- Local home prices are declining (-3.0%/yr); year-one equity from $2k of loan paydown is wiped out by about $7k of value loss. Plan a longer hold.
- Palm Beach County population projected at +30% by 2050 — long-run rental-demand tailwind backs the buy-and-hold thesis.
Negotiation context
- Only 6 days on market — expect competitive offers; lowballing is unlikely to land.
Risks & watch-outs
- Climate carrying-cost: severe wind risk, 99% chance of damaging wind over 30y; extreme-heat days projected 7→29/yr by 2055 (HVAC capex compounding) — expect insurance premiums to compound above CPI over the hold.
Questions for the listing agent
- What do current leases actually rent for vs. the listed asking? Can we see a recent rent roll and the last 12 months of T-12 income?
- Built in 1975 — when were the roof, HVAC, electrical panel, plumbing, and water heater last replaced?
- What does the HOA fee cover, when was the last increase, and are there any pending special assessments or reserve-fund shortfalls?
- Is there a deadline driving the sale (1031 exchange, divorce, estate, relocation)? That informs how much negotiation room exists.
- Crime grade is D in this area — have there been break-ins, vandalism, or insurance claims at this property in the last 3 years? What carrier currently insures it and at what premium?
- The area grade is low — what's the realistic commute time and amenity access for the typical tenant pool here? Any planned neighborhood developments (good or bad) we should know about?
- What's the average days-on-market for RENTAL listings here right now (not sales)? A rising rental-DOM trend means longer vacancies and softer asking-rent achievability than the comps imply.
- What's the recent tenant-quality profile in this submarket — average credit score on applications, eviction rate, late-payment / NSF rate, and stable-employment percentage? A property-management company in the area should have these aggregated.
- How much new for-sale + rental construction is in the pipeline within 1–3 miles? Heavy new supply typically softens prices + rents 12–24 months out; constrained supply supports both.
Investment metrics
- 1% rule
- 0.97% ✗
- Cap rate
- 6.15%
- Cash-on-cash
- -0.52%
- DSCR
- 0.98
- GRM
- 8.5
CMA / ARV
No comps found within radius.
Projected returns pro-forma
-3.0% appreciation · 0.0% rent growth · sell at horizon
- IRR
- -21.0%
- Equity multiple
- 0.29×
- Total profit
- $-49,206
- Equity at exit
- $37,127
- IRR
- -25.0%
- Equity multiple
- -0.03×
- Total profit
- $-72,096
- Equity at exit
- $21,529
Cash invested: $69,720 (down + closing). Projections, not guarantees.
Landlord ↔ Tenant lean methodology
- Overall (STATE)
- 87 Strongly Landlord-Friendly
- State Florida
- 87 Strongly Landlord-Friendly · R+3
- County
- — inherits STATE
- City
- — inherits STATE
ZIP-level market 33436
- Home prices YoY
- -26.0%
- Rents YoY
- -0.6%
- Active inventory
- 445
- Price-to-rent
- 8.5×
Monthly cashflow live
- Estimated rent
- $2,427 high interval (Pro) →
- Mortgage (P&I)
- −$1,306
- Tax est. 1.5%
- −$311 /mo · $3,735/yr
- Insurance
- −$104
- HOA
- −$227
- Vacancy / Maint / Mgmt
- −$510
- Net cashflow
- $-30
Break-even live
UW: 25.0% down · 7.5% · 30yr · 1.5% tax · 5.0% vac · 8.0% maint · 8.0% mgmt
Financing live
Cash to close
- Down payment
- $62,250
- Closing costs
- $7,470
- Reserves months
- —
- Total cash needed
- —
Loan-product check · same deal, 3 products live
Conventional
25% down · 7.5% · 30yr
- Down + closing
- —
- Monthly P&I
- —
- Monthly cashflow
- —
- DSCR
- —
- Eligible?
- —
Personal DTI + credit; lowest rate.
DSCR
20% down · 8.5% · 30yr
- Down + closing
- —
- Monthly P&I
- —
- Monthly cashflow
- —
- DSCR
- —
- Eligible?
- —
No personal income docs; deal must DSCR.
Hard money
10% down · 12.0% · 12mo
- Down + closing
- —
- Monthly P&I
- —
- Monthly cashflow
- —
- DSCR
- —
- Eligible?
- —
Short-term bridge; refi at stabilization.
Rent comps 40 comps
| Address | Beds | Baths | Sqft | Rent | $/sqft | DOM | Units | Dist |
|---|---|---|---|---|---|---|---|---|
| 4525 Nutmeg Tree Ln Unit A Boynton Beach, FL | 2.0 | 2.0 | 1404 | $3,000 | $2.14 | 24d | 1 | 0.23mi |
| 9940 Bauhinia Tree Way Unit B Boynton Beach, FL | 1.0 | 1.0 | 1200 | $1,800 | $1.50 | 7d | 1 | 0.26mi |
| 9940 Bauhinia Tree Way Unit B Boynton Beach, FL | 1.0 | 1.0 | 1200 | $2,000 | $1.67 | 24d | 1 | 0.26mi |
| 9873 Lawrence Rd Boynton Beach, FL | 2.0 | 2.0 | 1200 | $2,267 | $1.89 | 22d | 1 | 0.36mi |
| 9873 Lawrence Rd Boynton Beach, FL | 2.0 | 2.0 | 1200 | $2,315 | $1.93 | 4d | 1 | 0.36mi |
| 9900 Pineapple Tree Dr #106 Boynton Beach, FL | 2.0 | 2.0 | 1008 | $2,250 | $2.23 | 24d | 1 | 0.45mi |
| 9935 Pineapple Tree Dr #202 Boynton Beach, FL | 2.0 | 2.0 | 1008 | $2,575 | $2.55 | 15d | 1 | 0.49mi |
| 4944 Equestrian Cir Unit A Boynton Beach, FL | 2.0 | 2.0 | 1400 | $2,500 | $1.79 | 7d | 1 | 0.72mi |
| 9746 Nickels Blvd Boynton Beach, FL | 2.0 | 2.0 | 1215 | $2,800 | $2.30 | 24d | 1 | 0.73mi |
| 5020 Ashley Lake Dr Boynton Beach, FL | 1.0 | 1.0 | 784 | $2,074 | $2.65 | 24d | 1 | 0.82mi |
| 5020 Ashley Lake Dr Boynton Beach, FL | 2.0 | 2.0 | 1002 | $2,346 | $2.34 | 14d | 1 | 0.82mi |
| 5020 Ashley Lake Dr Boynton Beach, FL | 2.0 | 2.0 | 1002 | $2,394 | $2.39 | 3d | 1 | 0.82mi |
| 5157 Floria Way Unit J Boynton Beach, FL | 3.0 | 2.0 | 1447 | $3,300 | $2.28 | 24d | 1 | 0.91mi |
| 9498 S Military Trl #5 Boynton Beach, FL | 3.0 | 2.5 | 1317 | $2,900 | $2.20 | 24d | 1 | 0.91mi |
| 5217 Cedar Lake Rd Boynton Beach, FL | 1.0–3.0 | 1.0–2.0 | 1030 | $2,266 | $2.20 | 1d | 51 | 0.93mi |
| 4249 Quail Ridge Dr N Unit A Boynton Beach, FL | 2.0 | 2.0 | 1212 | $4,000 | $3.30 | 24d | 1 | 0.95mi |
| 5155 Europa Dr Unit J Boynton Beach, FL | 3.0 | 2.0 | 1333 | $2,750 | $2.06 | 24d | 1 | 0.96mi |
| 3561 Oberon Ave Boynton Beach, FL | 3.0 | 2.0 | 1248 | $2,850 | $2.28 | 20d | 1 | 0.98mi |
| 4116 Quail Ridge Dr N Unit A Boynton Beach, FL | 2.0 | 2.0 | 1267 | $3,800 | $3.00 | 24d | 1 | 0.98mi |
| 5133 Brisata Cir Unit P Boynton Beach, FL | 3.0 | 2.0 | 1374 | $2,800 | $2.04 | 24d | 1 | 0.98mi |
| 204 Belmont Pl Boynton Beach, FL | 1.0 | 1.0 | 878 | $2,200 | $2.51 | 24d | 1 | 1.03mi |
| 1201 Belmont Pl Boynton Beach, FL | 2.0 | 2.0 | 1143 | $2,400 | $2.10 | 24d | 1 | 1.03mi |
| 401 Belmont Pl Boynton Beach, FL | 2.0 | 2.0 | 1143 | $2,300 | $2.01 | 24d | 1 | 1.03mi |
| 1101 Belmont Pl #1101 Boynton Beach, FL | 2.0 | 2.0 | 1143 | $2,300 | $2.01 | 20d | 1 | 1.03mi |
| 1201 Belmont Pl Boynton Beach, FL | 2.0 | 2.0 | 1143 | $2,400 | $2.10 | 19d | 1 | 1.03mi |
| 10187 Mangrove Dr #104 Boynton Beach, FL | 2.0 | 2.0 | 1260 | $2,350 | $1.87 | 24d | 1 | 1.12mi |
| 5418 Firenze Dr Unit P Boynton Beach, FL | 2.0 | 2.0 | 1139 | $2,400 | $2.11 | 2d | 1 | 1.18mi |
| 3736 Coelebs Ave Boynton Beach, FL | 3.0 | 2.0 | 1232 | $3,000 | $2.44 | 24d | 1 | 1.19mi |
| 8949 Oak St Boynton Beach, FL | 2.0 | 2.0 | 1040 | $1,300 | $1.25 | 24d | 1 | 1.20mi |
| 10592 Tropic Palm Ave #202 Boynton Beach, FL | 2.0 | 2.0 | 1385 | $2,450 | $1.77 | 24d | 1 | 1.20mi |
| 10056 Boynton Place Cir Boynton Beach, FL | 3.0 | 2.0 | 1253 | $2,950 | $2.35 | 2d | 1 | 1.22mi |
| 10056 Boynton Place Cir Boynton Beach, FL | 3.0 | 2.0 | 1253 | $3,000 | $2.39 | 24d | 1 | 1.22mi |
| 10624 Tropic Palm Ave #202 Boynton Beach, FL | 3.0 | 2.0 | 1385 | $2,550 | $1.84 | 24d | 1 | 1.23mi |
| 5275 Europa Dr Unit I Boynton Beach, FL | 3.0 | 2.0 | 1282 | $2,500 | $1.95 | 1d | 1 | 1.24mi |
| 1561 Stonehaven Dr Boynton Beach, FL | 1.0–2.0 | 1.0–2.0 | 975 | $2,084 | $2.14 | 3d | 4 | 1.24mi |
| 2788 Wood Fern Dr Boynton Beach, FL | 2.0 | 2.0 | 1472 | $2,900 | $1.97 | 24d | 1 | 1.25mi |
| 5373 Mirror Lakes Blvd Boynton Beach, FL | 3.0 | 2.0 | 1310 | $2,100 | $1.60 | 24d | 1 | 1.27mi |
| 10423 Boynton Place Cir Boynton Beach, FL | 2.0 | 1.0 | 861 | $2,200 | $2.56 | 7d | 1 | 1.33mi |
| 10423 Boynton Place Cir Boynton Beach, FL | 2.0 | 1.0 | 861 | $2,200 | $2.56 | 18d | 1 | 1.33mi |
| 10492 Boynton Place Cir Boynton Beach, FL | 1.0–3.0 | 1.0–2.0 | 1017 | $2,375 | $2.33 | 1d | 19 | 1.35mi |
HOA detail
- Monthly dues
- $227 · $2,724/yr
- Likely covers
- watersewertrashcablelandscapingroofpoolgym
Listing history 6 events
-
2026-06-18days on market $249,000 Active 6 DOM
-
2026-06-17days on market $249,000 Active 5 DOM
-
2026-06-16days on market $249,000 Active 4 DOM
-
2026-06-15days on market $249,000 Active 3 DOM
-
2026-06-13remarks 649-char remark
-
2026-06-13$249,000 Active 1 DOM
ⓘ Source: listings_history table (triggers on properties + properties_extension) + one-shot
backfill from property_details.listing_events for pre-trigger history.
Climate risk First Street
- Flood 4/10 Moderate FEMA zone X (unshaded) · 20% chance over 30 yrs
- Wildfire 1/10 Low
- Heat 10/10 Extreme 7 d/yr ≥106°F today · 29 d/yr by 30 yrs out
- Wind 10/10 Extreme 99% chance of damaging wind over 30 yrs
- Air quality 2/10 Low 1 unhealthy d/yr today · 2 by 30 yrs out
Nearby sold comps map
Loading sold comps map…
Walkable amenities ~0.75 mi
Loading nearby amenities…
Taxation est. · year 1
- Rental income
- $29,129
- − Mortgage interest
- −$13,948
- − Property taxes
- −$3,735
- − Insurance
- −$1,245
- − Repairs & maintenance
- −$2,330
- − Management
- −$2,330
- − HOA
- −$2,724
- − Depreciation
- −$7,244
- Taxable loss
- −$4,427
- Est. tax savings @ 24.0%
- +$1,063
- After-tax cash flow
- $701/yr
For passive investors: Depreciation is non-cash, so a rental often shows a tax loss while cash-flowing — sheltering income. Rental losses are passive: they offset passive income freely, and up to $25,000/yr can offset ordinary (W-2) income if you actively participate and your MAGI is under $100k (phasing out to $0 by $150k); unused losses carry forward. On sale, claimed depreciation is recaptured at up to 25%, and gains may owe capital-gains tax (a 1031 exchange can defer both). Figures are a year-1 estimate at your 24.0% rate — not tax advice; consult a CPA.
Condition & rehab AI · 12 photos
This move-in ready home offers a beautiful, modern interior with a well-maintained exterior and landscaping. It's located in a sought-after community with amenities like heated pools and tennis courts.
Value-add opportunities
- Both landscaping — enhances curb appeal and adds value
- Both painting — fresh paint improves aesthetics and value
- Both landscaping — enhances curb appeal and adds value
Renovation cost estimate screening
Value-add ROI direction
- Both landscaping — enhances curb appeal and adds value ↑
- Both painting — fresh paint improves aesthetics and value ↑
- Both landscaping — enhances curb appeal and adds value ↑
ⓘ Cost ranges are severity-bucket heuristics (US national rule-of-thumb). Get contractor quotes + a written scope before underwriting a rehab budget.
Schools (NCES district)
- District
- Palm Beach
- NCES district ID
- 1201500
- Math proficiency
- 46% ▼ -16.00%
- Reading proficiency
- 53% ▼ -4.00%
- Median HH income
- $53,943
- Composite
- 42.72/100
- National rank
- #3160
- State rank
- #34 of 73 in FL
Livability — Boynton Beach
- Score
- 72/100
- State rank
- #351
- US rank
- #6098
Category grades
Schools grade is shown separately in the Schools card above.
Census & demographics
- County
- Palm Beach County · 1,438,312 people
- City population
- 148,060
- Metro
- Miami-Fort Lauderdale-Pompano Beach, FL
- Population (ZIP)
- 48,743
- Household income
- $75,789
- Rent vs Own
- Severe rent burden
- 1813.0
Population outlook (Palm Beach County) Hauer SSP2
- Today (2025)
- 1,637,487 people
- By 2030
- 1,743,255 · +6.5%
- By 2040
- 1,948,712 · +19.0%
- By 2050
- 2,132,979 · +30.3%
- By 2075
- 2,530,027 · +54.5%
- By 2100
- 2,706,979 · +65.3%
Race, ethnicity, and origin ACS 2023
- Neighborhood character
- Diverse neighborhood (Simpson 0.64)
- Race & ethnicity
- White 52% Black 24% Hispanic / Latino 19% Two or more races 10% Asian 2%
- Hispanic origin (detail)
- Mexican 2% Puerto Rican 4% Cuban 3% Dominican 1%
- Common ancestry
- Hispanic 12% Romanian 3% Scotch-Irish 2%
- Foreign-born
- 27% · Canada, Jamaica, Vietnam
- Languages at home
- 64% English-only · Spanish 14% French/Haitian/Cajun 13% Other Indo-European 2%
Political lean MEDSL · Palm Beach
- 2024 margin
- Toss-up / Even · D 50.0% · R 49.2%
- 2008→2024 swing
- -22.1pp toward R · 2008: 22.9pp · 2024: 0.8pp
- All cycles
- 2024: D+0.8 2020: D+12.8 2016: D+15.3 2012: D+17.0 2008: D+22.9
Not yet ingested
- Civics
- —
Market trends
- HPI YoY
- ▼ -109.59%
- Current HPI
- 311.7742
- Rent YoY
- ▼ -0.57%
- Metro
- Miami-Fort Lauderdale-Pompano Beach, FL
- State GDP YoY
- ▲ 3.28%
- F500 in state
- 36
Industry mix (Fortune 500 HQ in FL)
| Industry | F500 HQs | Revenue |
|---|---|---|
| Industrial Technology | 2 | $29B |
|
||
| Insurance | 2 | $17B |
|
||
| Retail | 1 | $60B |
|
||
| Technology Distribution | 1 | $58B |
|
||
| Homebuilding | 1 | $35B |
|
||
| Technology Manufacturing | 1 | $35B |
|
||
Price history
1 event — show timeline
- 2026-06-09 Listed $249,000 Beaches MLS
Cash-flow waterfall
monthlySold comps — $/sqft
last 12 mo · ≤1 miLoading sold comps…