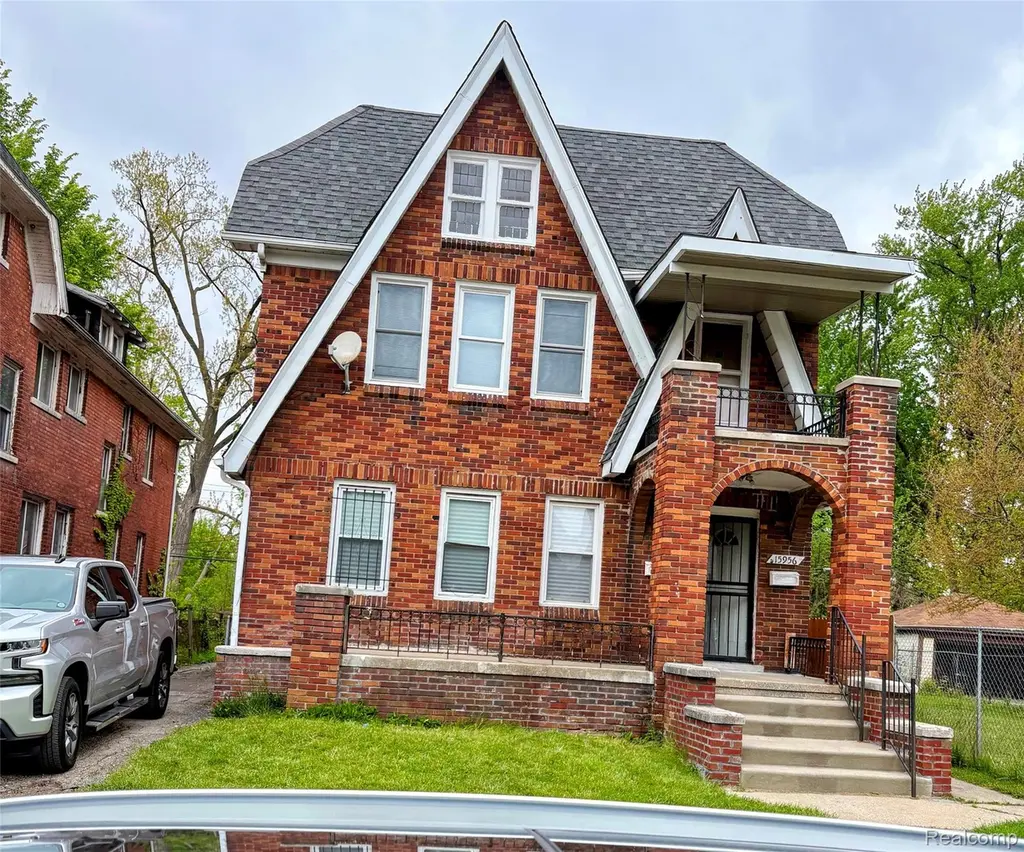
15954 NW Hackett St NW · Detroit, MI
Flood risk 1/10 · Minimal
- FEMA flood zone
- X (unshaded)
- Chance of flooding over 30 yrs
- 0.0%
- Est. flood insurance / yr
- $473 – $860
Fire risk 1/10 · Minimal
- Est. fire insurance / yr
- $784 – $1,456
Heat risk 3/10 · Minor
- Hot days now (above 98°F)
- 7 days/yr
- Hot days in 30 yrs
- 15 days/yr
Wind risk 2/10 · Minimal
- Chance of severe wind over 30 yrs
- —
Air-quality risk 3/10 · Minor
- Unhealthy air days now
- 2 days/yr
- Unhealthy air days in 30 yrs
- 5 days/yr
Risk factors via First Street. Map © Google.
Why this score? — see what drove the C- grade
The composite is a weighted blend of 9 inputs, each scored 0–100. Each bar is that input's sub-score; the figure is the points it added to the 100-point composite (weight × sub-score).
- Cash flow +22.2/30.0
- ARV discount +7.5/15.0
- DSCR +7.1/10.0
- 1% rule +5.3/10.0
- Rent growth +3.9/5.0
- Livability +3.7/5.0
- Condition / age +2.5/5.0
- Schools +1.3/10.0
- Appreciation +0.0/10.0
$183,300
🖨 Deal sheet (PDF) 📄 Offer letter ✓ Due diligence
Listing remarks MLS
The Grand River Greenfield area is undergoing a timely healthy renovation of business and community living. This area has a wide variety of multi-level housing. Our upper and lower Two Family home has been well maintained and restored to move in ready condition. Each unit is a three bedroom home with renovated kitchens and baths. Each level has LED lighting, ceiling fans wood, laminate, ceramic and carpeted flooring. The home has an operable detached garage for two plus vehicles with storage space. Both units have their own basement areas with furnace, hot water tanks and additional storage. There are lower and upper out door sitting areas. This community has amenities in walking distance, restaurants, shopping, schools, etc. Our home is ideal for either investors or owner-occupants. Don't miss an opportunity to secure a cash-flowing asset in a strong rental market area. We are look forward to your visit.
Key facts
- Renovated kitchens
- Renovated baths
- Led lighting
Tags
Property features AI
Finance
- Other: Zoned for multifamily/residential; Lot is paved with dimensions approximately 40 x 124.6 (0.11 acre)
- Financial info: Two separate rental units: each is a 3-bedroom, unfurnished unit; Unit 1 rent listed at $1,000; Unit 2 rent listed at $850
Exterior
- Parking: Garage parking (total 3 parking spaces)
- Security: Building security; Smoke detectors; Closed-circuit cameras
- Utilities: Public water; Public sewer; Electric service with circuit breakers and 220 volts
- Home design: Residential income, multifamily property; Two-story building; Located in Moore Park; cross streets Prevost and Rutherford
- Construction: Brick, concrete and asphalt construction materials; Shingle/asphalt roof; Brick/mortar foundation; Above-grade finished area approximately 2,704 square feet
- Exterior features: Outdoor lighting; Covered porch; Fenced backyard
Interior
- Kitchen: No specific kitchen appliance list provided
- Bedrooms: Three bedrooms (units: two separate 3-bedroom units)
- Bathrooms: Two full bathrooms (building total); Each unit: 1 bathroom
- Heating & cooling: Forced air heating (natural gas, ENERGY STAR qualified equipment); Central air; Ceiling fans
- Interior features: Gas water heater; Partial unfinished basement
- Laundry & utility: No laundry details provided
Neighborhood map
What this means for you Summary
Snapshot
- This is a 6-bed/3.0-bath townhouse listed at $183k.
Deal economics
- At list price, monthly cash flow is $299 ($4k/yr) — positive.
- The deal already cash-flows at list — no discount required.
- Meets the 1% rule at list price ($2k rent vs $183k).
- Recommended offer: $181k (1.5% below list) — sets the bar for market timing.
Location & tenants
- Location reads 73/100 on livability (#218 in MI) — a middle-class / working-renter tenant base. Strengths: amenities A+, commute A+, cost of living A+; Watch: crime F, employment F.
- Detroit Public Schools Community District (urban): math 10% / reading 24% proficiency, ranked #499 of 540 in MI (top 92%) — low school quality limits family demand, transient renter base, plan for 1-2y turnover; 90% free/reduced lunch — lower-income household profile, screen leases tightly.
- Zoned schools: Edison Elementary School (math 10% / reading 10%, grade F, #1,230 of 1,397 statewide, top 91%, 309 students, 89% FRL); Cody High School (math 24% / reading 24%, grade F, #481 of 713 statewide, top 81%, 466 students, 88% FRL) — zoned schools at 88% FRL track the district average.
- Market conditions: Rents rising fast (+5.6%/yr); 392 active listings in the ZIP; 2 comparable units currently listed for rent nearby; lower-income renter base — watch delinquency; 2,639 units permitted in Wayne County in 2024 (1,216 in 5+ unit buildings).
- At $1,892/mo this rent would consume 62% of the median local household income ($37k/yr) (locally 2371% of renters already pay >50% of income on rent) — very limited rent-growth headroom before tenants either downsize or default.
Forward outlook
- Local home prices are declining (-3.0%/yr); year-one equity from $1k of loan paydown is wiped out by about $5k of value loss. Plan a longer hold.
- Wayne County population projected at -17% by 2050 — secular population decline; favor cash flow + early exit over multi-decade hold.
- At projected returns (-3.0% appreciation + 5.6% rent growth), your $51k cash investment doubles in ~10 years — after that, you're playing with house money.
Negotiation context
- It's been on market 30 days — a 2% lower offer ($181k) is reasonable based on typical stale-listing flexibility.
- 14 sale attempts since 20y ago with the ask held roughly flat each time — persistent listings suggest the price (not the market) is what's stuck; bring a comps-based counter.
- Current owner paid $15k; list at $183k implies a 1122% gain — meaningful room to come down on a strong offer.
Risks & watch-outs
- Watch-outs: built in 1926 — expect roof / HVAC / electrical / plumbing capex.
Questions for the listing agent
- Built in 1926 — when were the roof, HVAC, electrical panel, plumbing, and water heater last replaced?
- Is there a deadline driving the sale (1031 exchange, divorce, estate, relocation)? That informs how much negotiation room exists.
- Schools are F-rated, which usually means shorter tenancies and higher turnover. Who's the typical renter profile here, and what's been the actual vacancy rate?
- Crime grade is F in this area — have there been break-ins, vandalism, or insurance claims at this property in the last 3 years? What carrier currently insures it and at what premium?
- What's the average days-on-market for RENTAL listings here right now (not sales)? A rising rental-DOM trend means longer vacancies and softer asking-rent achievability than the comps imply.
- What's the recent tenant-quality profile in this submarket — average credit score on applications, eviction rate, late-payment / NSF rate, and stable-employment percentage? A property-management company in the area should have these aggregated.
- How much new for-sale + rental construction is in the pipeline within 1–3 miles? Heavy new supply typically softens prices + rents 12–24 months out; constrained supply supports both.
Investment metrics
- 1% rule
- 1.03% ✓
- Cap rate
- 8.25%
- Cash-on-cash
- 6.98%
- DSCR
- 1.31
- GRM
- 8.1
CMA / ARV
No comps found within radius.
Projected returns pro-forma
-3.0% appreciation · 5.59% rent growth · sell at horizon
- IRR
- -2.8%
- Equity multiple
- 0.89×
- Total profit
- $-5,642
- Equity at exit
- $27,331
- IRR
- 9.4%
- Equity multiple
- 1.81×
- Total profit
- $41,401
- Equity at exit
- $15,848
Cash invested: $51,324 (down + closing). Projections, not guarantees.
Landlord ↔ Tenant lean methodology
- Overall (STATE)
- 62 Landlord-Friendly
- State Michigan
- 62 Landlord-Friendly · EVEN
- County
- — inherits STATE
- City
- — inherits STATE
ZIP-level market 48227
- Rents YoY
- 5.6%
- Active inventory
- 392
- Price-to-rent
- 8.1×
Monthly cashflow live
- Estimated rent
- $1,892 medium interval (Pro) →
- Mortgage (P&I)
- −$961
- Tax from tax record
- −$158 /mo · $1,900/yr
- Insurance
- −$76
- HOA
- −$0
- Vacancy / Maint / Mgmt
- −$397
- Net cashflow
- $299
Break-even live
Sensitivity live
| Price | -10% $402 | -5% $350 | +0% $299 | +5% $247 | +10% $195 |
|---|---|---|---|---|---|
| Rent | -10% $149 | -5% $224 | +0% $299 | +5% $373 | +10% $448 |
| Rate | -1.0pp $391 | -0.5pp $345 | base $299 | +0.5pp $251 | +1.0pp $203 |
UW: 25.0% down · 7.5% · 30yr · 1.5% tax · 5.0% vac · 8.0% maint · 8.0% mgmt
Financing live
Cash to close
- Down payment
- $45,825
- Closing costs
- $5,499
- Reserves months
- —
- Total cash needed
- —
Loan-product check · same deal, 3 products live
Conventional
25% down · 7.5% · 30yr
- Down + closing
- —
- Monthly P&I
- —
- Monthly cashflow
- —
- DSCR
- —
- Eligible?
- —
Personal DTI + credit; lowest rate.
DSCR
20% down · 8.5% · 30yr
- Down + closing
- —
- Monthly P&I
- —
- Monthly cashflow
- —
- DSCR
- —
- Eligible?
- —
No personal income docs; deal must DSCR.
Hard money
10% down · 12.0% · 12mo
- Down + closing
- —
- Monthly P&I
- —
- Monthly cashflow
- —
- DSCR
- —
- Eligible?
- —
Short-term bridge; refi at stabilization.
Rent comps 2 comps
| Address | Beds | Baths | Sqft | Rent | $/sqft | DOM | Units | Dist |
|---|---|---|---|---|---|---|---|---|
| 14941 Robson St Detroit, MI | 6.0 | 2.0 | 1820 | $1,600 | $0.88 | 46d | 1 | 0.57mi |
| 14941 Robson St Detroit, MI | 6.0 | 2.0 | 1820 | $1,600 | $0.88 | 26d | 1 | 0.57mi |
Listing history 47 events
-
2026-06-21days on market $183,300 Active 30 DOM
-
2026-06-18days on market $183,300 Active 27 DOM
-
2026-06-17days on market $183,300 Active 26 DOM
-
2026-06-15days on market $183,300 Active 24 DOM
-
2026-06-13days on market $183,300 Active 22 DOM
-
2026-06-13days on market $183,300 Active 21 DOM
-
2026-06-09days on market $183,300 Active 18 DOM
-
2026-06-08days on market $183,300 Active 17 DOM
-
2026-06-07days on market $183,300 Active 16 DOM
-
2026-06-04days on market $183,300 Active 13 DOM
-
2026-06-03days on market $183,300 Active 12 DOM
-
2026-06-02days on market $183,300 Active 11 DOM
-
2026-06-01days on market $183,300 Active 10 DOM
-
2026-05-31days on market $183,300 Active 9 DOM
-
2026-05-16$183,300 Active 918-char remark
Show marketing remark (918 chars)
The Grand River Greenfield area is undergoing a timely healthy renovation of business and community living. This area has a wide variety of multi-level housing. Our upper and lower Two Family home has been well maintained and restored to move in ready condition. Each unit is a three bedroom home with renovated kitchens and baths. Each level has LED lighting, ceiling fans wood, laminate, ceramic and carpeted flooring. The home has an operable detached garage for two plus vehicles with storage space. Both units have their own basement areas with furnace, hot water tanks and additional storage. There are lower and upper out door sitting areas. This community has amenities in walking distance, restaurants, shopping, schools, etc. Our home is ideal for either investors or owner-occupants. Don't miss an opportunity to secure a cash-flowing asset in a strong rental market area. We are look forward to your visit.
-
2026-05-16$183,300 Active
Show marketing remark (918 chars)
The Grand River Greenfield area is undergoing a timely healthy renovation of business and community living. This area has a wide variety of multi-level housing. Our upper and lower Two Family home has been well maintained and restored to move in ready condition. Each unit is a three bedroom home with renovated kitchens and baths. Each level has LED lighting, ceiling fans wood, laminate, ceramic and carpeted flooring. The home has an operable detached garage for two plus vehicles with storage space. Both units have their own basement areas with furnace, hot water tanks and additional storage. There are lower and upper out door sitting areas. This community has amenities in walking distance, restaurants, shopping, schools, etc. Our home is ideal for either investors or owner-occupants. Don't miss an opportunity to secure a cash-flowing asset in a strong rental market area. We are look forward to your visit.
-
2023-08-24historical
-
2023-08-24historical
-
2022-08-29price $149,900
-
2022-08-28price $149,900
-
2022-08-28status Active
-
2022-08-28status Active
-
2022-08-12status Pending
-
2022-08-12status Pending
-
2022-07-18price $174,900
-
2022-07-18price $174,900
-
2022-04-25price $164,900
-
2022-04-25price $164,900
-
2022-04-18historical
-
2022-04-18$174,900 Active
-
2022-04-18$174,900 Active
-
2022-04-18historical
-
2022-04-15status Active
-
2022-04-12historical
-
2022-03-19historical
-
2022-03-19$174,900 Active
-
2022-03-19$174,900 Active
-
2022-03-19historical
-
2022-02-21$174,900 Active
-
2022-02-21$174,900 Active
-
2013-01-06historical
-
2012-07-06$599
-
2009-05-20soldstatus $15,000
-
2009-04-13historical
-
2009-02-20$9,900
-
2006-09-21historical
-
2006-09-20$160,000
ⓘ Source: listings_history table (triggers on properties + properties_extension) + one-shot
backfill from property_details.listing_events for pre-trigger history.
Tax reassessment forecast MI · Partial reset (capped growth)
- Current annual tax
- $1,900 · $158/mo
- Projected year-2 tax
- $2,361 · $197/mo
- Expected delta
- +$461/yr (+$38/mo · 24.3%)
ⓘ Screening estimate from a state-policy table — verify with the county assessor before closing.
Climate risk First Street
- Flood 1/10 Low FEMA zone X (unshaded) · 0% chance over 30 yrs
- Wildfire 1/10 Low
- Heat 3/10 Moderate 7 d/yr ≥98°F today · 15 d/yr by 30 yrs out
- Wind 2/10 Low
- Air quality 3/10 Moderate 2 unhealthy d/yr today · 5 by 30 yrs out
Nearby sold comps map
Loading sold comps map…
Walkable amenities ~0.75 mi
Loading nearby amenities…
Taxation est. · year 1
- Rental income
- $22,702
- − Mortgage interest
- −$10,268
- − Property taxes
- −$1,900
- − Insurance
- −$916
- − Repairs & maintenance
- −$1,816
- − Management
- −$1,816
- − Depreciation
- −$5,332
- Taxable income
- $653
- Est. tax owed @ 24.0%
- −$157
- After-tax cash flow
- $3,426/yr
For passive investors: Depreciation is non-cash, so a rental often shows a tax loss while cash-flowing — sheltering income. Rental losses are passive: they offset passive income freely, and up to $25,000/yr can offset ordinary (W-2) income if you actively participate and your MAGI is under $100k (phasing out to $0 by $150k); unused losses carry forward. On sale, claimed depreciation is recaptured at up to 25%, and gains may owe capital-gains tax (a 1031 exchange can defer both). Figures are a year-1 estimate at your 24.0% rate — not tax advice; consult a CPA.
Schools (NCES district)
- District
- Detroit Public Schools Community District
- NCES district ID
- 2601103
- Math proficiency
- 10% ▼ -2.00%
- Reading proficiency
- 24% ▲ 6.00%
- Median HH income
- $25,815
- Composite
- 13.06/100
- National rank
- #9564
- State rank
- #499 of 540 in MI
Livability — Detroit
- Score
- 73/100
- State rank
- #218
- US rank
- #5427
Category grades
Schools grade is shown separately in the Schools card above.
Census & demographics
- Census place
- Detroit, MI
- County
- Wayne County · 1,562,939 people
- City population
- 572,865
- Metro
- Detroit-Warren-Dearborn, MI
- Population (ZIP)
- 40,302
- Household income
- $36,527
- Rent vs Own
- Severe rent burden
- 2371.0
Population outlook (Wayne County) Hauer SSP2
- Today (2025)
- 1,675,273 people
- By 2030
- 1,620,300 · -3.3%
- By 2040
- 1,502,341 · -10.3%
- By 2050
- 1,384,039 · -17.4%
- By 2075
- 1,124,592 · -32.9%
- By 2100
- 881,193 · -47.4%
Race, ethnicity, and origin ACS 2023
- Neighborhood character
- Predominantly Black (95%)
- Race & ethnicity
- Black 95% Two or more races 3% White 1%
- Foreign-born
- 1%
- Languages at home
- 98% English-only · Spanish 1% French/Haitian/Cajun 1%
Political lean MEDSL · Wayne
- 2024 margin
- Strong D (+29.0) · D 62.7% · R 33.7% · Other 3.6%
- 2008→2024 swing
- -20.5pp toward R · 2008: 49.5pp · 2024: 29.0pp
- All cycles
- 2024: D+29.0 2020: D+38.1 2016: D+37.3 2012: D+46.9 2008: D+49.5
Not yet ingested
- Civics
- —
Market trends
- HPI YoY
- ▼ -125.00%
- Current HPI
- 186.4158
- Rent YoY
- ▲ 5.59%
- Metro
- Detroit-Warren-Dearborn, MI
- State GDP YoY
- ▲ 1.37%
- F500 in state
- 28
Industry mix (Fortune 500 HQ in MI)
| Industry | F500 HQs | Revenue |
|---|---|---|
| Automotive Parts | 3 | $48B |
|
||
| Automotive | 2 | $372B |
|
||
| Chemicals | 1 | $45B |
|
||
| Automotive Retail | 1 | $29B |
|
||
| Healthcare / Medical Devices | 1 | $23B |
|
||
| Automotive Technology | 1 | $20B |
|
||
Price history
+14.6% since first listed33 events — show timeline
- 2026-05-16 Listed $183,300 REALCOMP
- 2026-05-16 Listed $183,300 MiRealSource-MiMLS
- 2023-08-24 Listing Removed — REALCOMP
- 2023-08-24 Listing Removed — MiRealSource-MiMLS
- 2022-08-29 Price Changed $149,900 MiRealSource-MiMLS
- 2022-08-28 Price Changed $149,900 REALCOMP
- 2022-08-28 Relisted — MiRealSource-MiMLS
- 2022-08-28 Relisted — REALCOMP
- 2022-08-12 Pending — MiRealSource-MiMLS
- 2022-08-12 Pending — REALCOMP
- 2022-07-18 Price Changed $174,900 MiRealSource-MiMLS
- 2022-07-18 Price Changed $174,900 REALCOMP
- 2022-04-25 Price Changed $164,900 MiRealSource-MiMLS
- 2022-04-25 Price Changed $164,900 REALCOMP
- 2022-04-18 Listing Removed — REALCOMP
- 2022-04-18 Listing Removed — MiRealSource-MiMLS
- 2022-04-18 Listed $174,900 REALCOMP
- 2022-04-18 Listed $174,900 MiRealSource-MiMLS
- 2022-04-15 Relisted — REALCOMP
- 2022-04-12 Listing Removed — REALCOMP
- 2022-03-19 Listing Removed — REALCOMP
- 2022-03-19 Listing Removed — MiRealSource-MiMLS
- 2022-03-19 Listed $174,900 MiRealSource-MiMLS
- 2022-03-19 Listed $174,900 REALCOMP
- 2022-02-21 Listed $174,900 MiRealSource-MiMLS
- 2022-02-21 Listed $174,900 REALCOMP
- 2013-01-06 Listing Removed — MiRealSource-MiMLS
- 2012-07-06 Listed $599 MiRealSource-MiMLS
- 2009-05-20 Sold (MLS) $15,000 MiRealSource-MiMLS
- 2009-04-13 Listing Removed — MiRealSource-MiMLS
- 2009-02-20 Listed $9,900 MiRealSource-MiMLS
- 2006-09-21 Listing Removed — REALCOMP
- 2006-09-20 Listed $160,000 REALCOMP
Property tax history
-0.6%/yrLatest (2025): $1,900 · +0.0% YoY. Source: county tax records.
Cash-flow waterfall
monthlySold comps — $/sqft
last 12 mo · ≤1 miLoading sold comps…