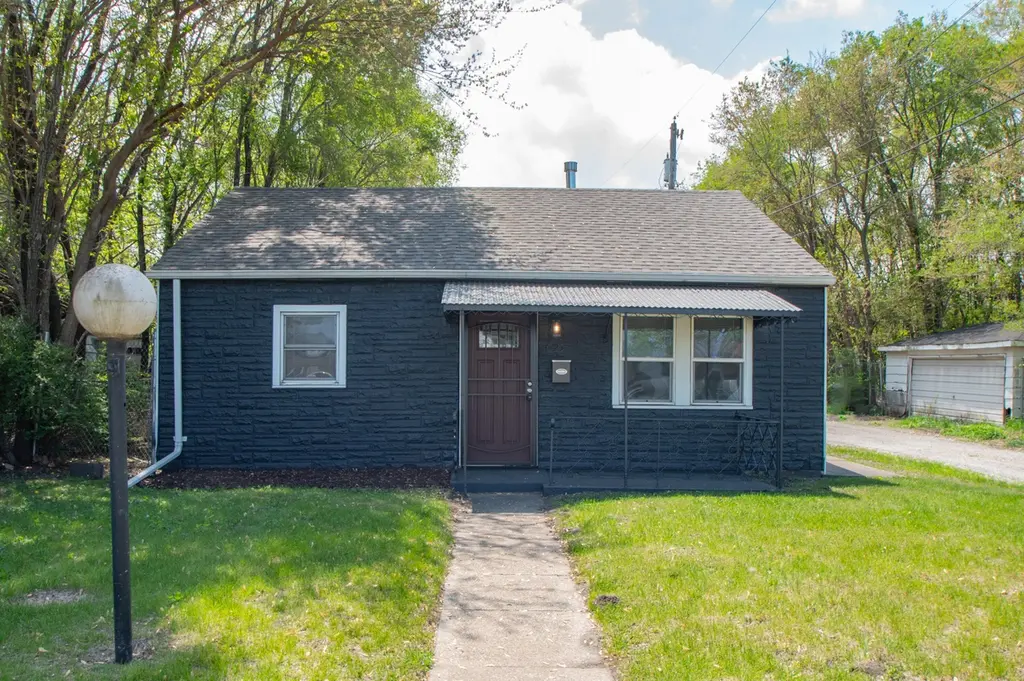
825 E 14th Ave · Gary, IN
Flood risk 6/10 · Moderate
- FEMA flood zone
- X (unshaded)
- Chance of flooding over 30 yrs
- 0.72%
- Est. flood insurance / yr
- $507 – $1,088
Fire risk 4/10 · Minor
- Est. fire insurance / yr
- $717 – $1,331
Heat risk 3/10 · Minor
- Hot days now (above 102°F)
- 7 days/yr
- Hot days in 30 yrs
- 15 days/yr
Wind risk 2/10 · Minimal
- Chance of severe wind over 30 yrs
- 1.0%
Air-quality risk 4/10 · Minor
- Unhealthy air days now
- 6 days/yr
- Unhealthy air days in 30 yrs
- 7 days/yr
Risk factors via First Street. Map © Google.
Why this score? — see what drove the C- grade
The composite is a weighted blend of 9 inputs, each scored 0–100. Each bar is that input's sub-score; the figure is the points it added to the 100-point composite (weight × sub-score).
- Cash flow +20.3/30.0
- ARV discount +7.5/15.0
- DSCR +6.5/10.0
- Appreciation +5.5/10.0
- 1% rule +4.4/10.0
- Livability +3.7/5.0
- Rent growth +2.5/5.0
- Condition / age +2.5/5.0
- Schools +0.5/10.0
$129,500
🖨 Deal sheet 📄 Offer letter ✓ Due diligence
Listing remarks MLS
Cozy cottage home, needs some TLC updates, Great investment or first time home buyer. Has double sized back yard to expand for garage in the future, if you choose. Located on quiet block, and near major interstate expressways , which connect you to shopping malls , and restaurants. In addition you are minutes from lovely Miller Beach !!
Key facts
- 7,144 sq ft lot
- Built 1949
- Listed 21 days
Property features AI
Exterior
- Parking: Additional parking; On-street parking
- Security: Smoke detector(s)
- Utilities: Public water; Public sewer; 100 amp electric service
- Home design: Single-story home; Built in 1949
- Construction: Year built 1949
- Exterior features: Neighborhood view; Back yard fencing; Smoke detectors
Interior
- Kitchen: Range hood
- Bedrooms: Primary bedroom; Bedroom 2; Bedroom 3
- Flooring: Vinyl
- Bathrooms: 1 full bathroom
- Heating & cooling: Natural gas heating; No cooling
- Interior features: Open floor plan; Stone counters; Range hood
- Laundry & utility: Main-level laundry
Neighborhood map
What this means for you Summary
Snapshot
- This is a 3-bed/1.0-bath single-family listed at $130k.
Deal economics
- At list price, monthly cash flow is $166 ($2k/yr) — positive.
- The deal already cash-flows at list — no discount required.
- To meet the 1% rule (rent ≥ 1% of price), the offer needs to be $122k (6.1% below list).
- Recommended offer: $122k (6.1% below list) — sets the bar for 1% rule.
Location & tenants
- Location reads 73/100 on livability (#105 in IN) — a middle-class / working-renter tenant base. Strengths: commute A+, cost of living A+, housing A+; Watch: schools F, crime F, employment F.
- Gary Community School Corporation (urban): math 3% / reading 11% proficiency, ranked #299 of 301 in IN (top 99%) — low school quality limits family demand, transient renter base, plan for 1-2y turnover; 80% free/reduced lunch — lower-income household profile, screen leases tightly.
- Market conditions: 121 active listings in the ZIP; 20 comparable units currently listed for rent nearby; rentals leasing fast (median 4d on market — plan ~1-2 weeks tenant-placement turnaround); lower-income renter base — watch delinquency; 1,642 units permitted in Lake County in 2024 (14 in 5+ unit buildings).
- At $1,216/mo this rent would consume 51% of the median local household income ($29k/yr) (locally 392% of renters already pay >50% of income on rent) — very limited rent-growth headroom before tenants either downsize or default.
Forward outlook
- In year one you build about $2k of equity ($895 loan paydown + $1k appreciation (1.0% local appreciation)).
- Lake County population projected to shrink 7% by 2050 — rents likely to lag national; underwrite the cash flow, not the appreciation.
- At projected returns (1.0% appreciation + 3.0% rent growth), your $36k cash investment doubles in ~7 years — after that, you're playing with house money.
Negotiation context
- It's been on market 21 days — a 2% lower offer ($128k) is reasonable based on typical stale-listing flexibility.
- 3 sale attempts since 2y ago with the ask held roughly flat each time — persistent listings suggest the price (not the market) is what's stuck; bring a comps-based counter.
- Current owner paid $43k; list at $130k implies a 201% gain — meaningful room to come down on a strong offer.
Risks & watch-outs
- Watch-outs: built in 1949 — expect roof / HVAC / electrical / plumbing capex.
- Climate carrying-cost: major flood risk — expect insurance premiums to compound above CPI over the hold.
Questions for the listing agent
- Built in 1949 — when were the roof, HVAC, electrical panel, plumbing, and water heater last replaced?
- Is there a deadline driving the sale (1031 exchange, divorce, estate, relocation)? That informs how much negotiation room exists.
- Schools are F-rated, which usually means shorter tenancies and higher turnover. Who's the typical renter profile here, and what's been the actual vacancy rate?
- Crime grade is F in this area — have there been break-ins, vandalism, or insurance claims at this property in the last 3 years? What carrier currently insures it and at what premium?
- What's the average days-on-market for RENTAL listings here right now (not sales)? A rising rental-DOM trend means longer vacancies and softer asking-rent achievability than the comps imply.
- What's the recent tenant-quality profile in this submarket — average credit score on applications, eviction rate, late-payment / NSF rate, and stable-employment percentage? A property-management company in the area should have these aggregated.
- How much new for-sale + rental construction is in the pipeline within 1–3 miles? Heavy new supply typically softens prices + rents 12–24 months out; constrained supply supports both.
Investment metrics
- 1% rule
- 0.94% ✗
- Cap rate
- 7.84%
- Cash-on-cash
- 5.51%
- DSCR
- 1.25
- GRM
- 8.9
CMA / ARV
- ARV (on-the-fly)
- $42,288
- Comps found
- 9
Show comp detail 9 sales within ~0.75 mi
| Address | Dist | Beds/Ba | Sqft | Sold | Price | $/sf | Match |
|---|---|---|---|---|---|---|---|
| 825 E 14th Ave | 0.00mi | 3/1.0 | 900 (+2%) | 19mo | $43,000 | $48 | 81 |
| 1027 Central Ave | 0.13mi | 3/1.0 | 1,008 (+14%) | 1mo | $69,000 | $68 | 70 |
| 1953 Carolina St | 0.41mi | 3/1.0 | 936 (+6%) | 13mo | $125,000 | $134 | 60 |
| 1980 Massachusetts St | 0.64mi | 3/1.0 | 802 (-9%) | 0mo | $20,000 | $25 | 55 |
| 2042 Mississippi St | 0.70mi | 3/1.0 | 836 (-5%) | 8mo | $144,001 | $172 | 52 |
| 2131 Kentucky St | 0.65mi | 3/1.0 | 804 (-9%) | 9mo | $20,000 | $25 | 48 |
| 764 Rhode Island St | 0.57mi | 2/1.0 (-1) | 804 (-9%) | 12mo | $45,000 | $56 | 44 |
| 2025 Pennsylvania St | 0.59mi | 2/1.0 (-1) | 810 (-8%) | 15mo | $18,500 | $23 | 42 |
| 734 Ohio St | 0.68mi | 2/2.0 (-1) | 756 (-14%) | 5mo | $30,000 | $40 | 32 |
Match score weights: distance 35% · size 25% · config 20% · recency 20%. Top-matched comps best support the ARV.
Projected returns pro-forma
0.98% appreciation · 3.0% rent growth · sell at horizon
- IRR
- 7.0%
- Equity multiple
- 1.35×
- Total profit
- $12,852
- Equity at exit
- $44,072
- IRR
- 11.1%
- Equity multiple
- 2.35×
- Total profit
- $48,827
- Equity at exit
- $58,462
Cash invested: $36,260 (down + closing). Projections, not guarantees.
Landlord ↔ Tenant lean methodology
- Overall (STATE)
- 90 Strongly Landlord-Friendly
- State Indiana
- 90 Strongly Landlord-Friendly · R+11
- County
- — inherits STATE
- City
- — inherits STATE
ZIP-level market 46407
- Home prices YoY
- 0.4%
- Active inventory
- 121
- Price-to-rent
- 8.9×
Monthly cashflow live
- Estimated rent
- $1,216 high interval (Pro) →
- Mortgage (P&I)
- −$679
- Tax from tax record
- −$61 /mo · $730/yr
- Insurance
- −$54
- HOA
- −$0
- Vacancy / Maint / Mgmt
- −$255
- Net cashflow
- $166
Break-even live
UW: 25.0% down · 7.5% · 30yr · 1.5% tax · 5.0% vac · 8.0% maint · 8.0% mgmt
Financing live
Cash to close
- Down payment
- $32,375
- Closing costs
- $3,885
- Reserves months
- —
- Total cash needed
- —
Loan-product check · same deal, 3 products live
Conventional
25% down · 7.5% · 30yr
- Down + closing
- —
- Monthly P&I
- —
- Monthly cashflow
- —
- DSCR
- —
- Eligible?
- —
Personal DTI + credit; lowest rate.
DSCR
20% down · 8.5% · 30yr
- Down + closing
- —
- Monthly P&I
- —
- Monthly cashflow
- —
- DSCR
- —
- Eligible?
- —
No personal income docs; deal must DSCR.
Hard money
10% down · 12.0% · 12mo
- Down + closing
- —
- Monthly P&I
- —
- Monthly cashflow
- —
- DSCR
- —
- Eligible?
- —
Short-term bridge; refi at stabilization.
Rent comps 20 comps
| Address | Beds | Baths | Sqft | Rent | $/sqft | DOM | Units | Dist |
|---|---|---|---|---|---|---|---|---|
| 1329 Delaware St Gary, IN | 2.0 | 1.0 | 1100 | $1,100 | $1.00 | 43d | 1 | 0.25mi |
| 1316 Delaware St Unit 2 Gary, IN | 2.0 | 1.0 | 700 | $950 | $1.36 | 20d | 1 | 0.29mi |
| 844 Tennessee St Gary, IN | 3.0 | 1.5 | 1000 | $1,500 | $1.50 | 43d | 1 | 0.52mi |
| 2061 Maryland St Gary, IN | 2.0 | 1.0 | 975 | $950 | $0.97 | 43d | 1 | 0.59mi |
| 1843 Illinois St Gary, IN | 2.0 | 1.0 | 725 | $1,200 | $1.66 | 17d | 1 | 0.64mi |
| 2022 Massachusetts St Gary, IN | 2.0 | 1.0 | 965 | $1,000 | $1.04 | 1d | 1 | 0.68mi |
| 2315 Industrial Blvd Unit B Gary, IN | 3.0 | 1.0 | 989 | $1,150 | $1.16 | 1d | 1 | 0.87mi |
| 2315 Industrial Blvd Gary, IN | 2.0 | 1.0 | 989 | $950 | $0.96 | 1d | 1 | 0.87mi |
| 2315 Industrial Blvd Gary, IN | 2.0 | 1.0 | 989 | $950 | $0.96 | 4d | 1 | 0.87mi |
| 2300 Maryland St Gary, IN | 2.0 | 1.0 | 900 | $1,000 | $1.11 | 19d | 1 | 0.88mi |
| 2025 Central Dr Gary, IN | 3.0 | 1.0 | 875 | $1,550 | $1.77 | 43d | 1 | 0.89mi |
| 2336 Delaware St Gary, IN | 3.0 | 1.0 | 816 | $1,100 | $1.35 | 1d | 1 | 0.93mi |
| 2355 Rhode Island St Gary, IN | 2.0 | 1.0 | 701 | $1,095 | $1.56 | 43d | 1 | 0.94mi |
| 2425 Prospect St Gary, IN | 3.0 | 1.0 | 1051 | $1,400 | $1.33 | 1d | 1 | 1.01mi |
| 2453 Prospect St Gary, IN | 2.0 | 1.0 | 704 | $1,095 | $1.56 | 1d | 1 | 1.04mi |
| 840 W 19th Ave Gary, IN | 2.0 | 1.0 | 1035 | $1,150 | $1.11 | 19d | 1 | 1.12mi |
| 501 Madison St Gary, IN | 1.0–4.0 | 1.0 | 883 | $1,362 | $1.54 | 1d | 11 | 1.17mi |
| 1521 Pierce St Unit 1 Gary, IN | 2.0 | 1.0 | 800 | $850 | $1.06 | 1d | 1 | 1.27mi |
| 2378 Jackson St Gary, IN | 2.0 | 1.0 | 672 | $1,050 | $1.56 | 1d | 1 | 1.29mi |
| 2572-76 Van Buren Pl Gary, IN | 2.0 | 1.0 | 700 | $1,025 | $1.46 | 1d | 1 | 1.50mi |
Listing history 19 events
-
2026-06-17status $129,500 Pending 21 DOM
-
2026-06-16days on market $129,500 Active 21 DOM
-
2026-06-15days on market $129,500 Active 20 DOM
-
2026-06-13days on market $129,500 Active 18 DOM
-
2026-06-13days on market $129,500 Active 17 DOM
-
2026-06-09days on market $129,500 Active 14 DOM
-
2026-06-08days on market $129,500 Active 13 DOM
-
2026-06-07days on market $129,500 Active 12 DOM
-
2026-06-04days on market $129,500 Active 9 DOM
-
2026-06-03days on market $129,500 Active 8 DOM
-
2026-06-02days on market $129,500 Active 7 DOM
-
2026-06-01days on market $129,500 Active 6 DOM
-
2026-05-31days on market $129,500 Active 5 DOM
-
2026-05-26$129,500 Active
-
2025-06-01historical $1,295
-
2025-05-21$1,295
-
2024-11-22soldstatus $43,000 Closed 338-char remark
Show marketing remark (338 chars)
Cozy cottage home, needs some TLC updates, Great investment or first time home buyer. Has double sized back yard to expand for garage in the future, if you choose. Located on quiet block, and near major interstate expressways , which connect you to shopping malls , and restaurants. In addition you are minutes from lovely Miller Beach !!
-
2024-10-26status Pending 338-char remark
Show marketing remark (338 chars)
Cozy cottage home, needs some TLC updates, Great investment or first time home buyer. Has double sized back yard to expand for garage in the future, if you choose. Located on quiet block, and near major interstate expressways , which connect you to shopping malls , and restaurants. In addition you are minutes from lovely Miller Beach !!
-
2024-10-12$50,000 Active 338-char remark
Show marketing remark (338 chars)
Cozy cottage home, needs some TLC updates, Great investment or first time home buyer. Has double sized back yard to expand for garage in the future, if you choose. Located on quiet block, and near major interstate expressways , which connect you to shopping malls , and restaurants. In addition you are minutes from lovely Miller Beach !!
ⓘ Source: listings_history table (triggers on properties + properties_extension) + one-shot
backfill from property_details.listing_events for pre-trigger history.
Tax reassessment forecast IN · Partial reset (capped growth)
- Current annual tax
- $730 · $61/mo
- Projected year-2 tax
- $915 · $76/mo
- Expected delta
- +$185/yr (+$15/mo · 25.4%)
ⓘ Screening estimate from a state-policy table — verify with the county assessor before closing.
Climate risk First Street
- Flood 6/10 Major FEMA zone X (unshaded) · 72% chance over 30 yrs
- Wildfire 4/10 Moderate
- Heat 3/10 Moderate 7 d/yr ≥102°F today · 15 d/yr by 30 yrs out
- Wind 2/10 Low 100% chance of damaging wind over 30 yrs
- Air quality 4/10 Moderate 6 unhealthy d/yr today · 7 by 30 yrs out
Nearby sold comps map
Loading sold comps map…
Walkable amenities ~0.75 mi
Loading nearby amenities…
Taxation est. · year 1
- Rental income
- $14,588
- − Mortgage interest
- −$7,254
- − Property taxes
- −$730
- − Insurance
- −$648
- − Repairs & maintenance
- −$1,167
- − Management
- −$1,167
- − Depreciation
- −$3,767
- Taxable loss
- −$145
- Est. tax savings @ 24.0%
- +$35
- After-tax cash flow
- $2,033/yr
For passive investors: Depreciation is non-cash, so a rental often shows a tax loss while cash-flowing — sheltering income. Rental losses are passive: they offset passive income freely, and up to $25,000/yr can offset ordinary (W-2) income if you actively participate and your MAGI is under $100k (phasing out to $0 by $150k); unused losses carry forward. On sale, claimed depreciation is recaptured at up to 25%, and gains may owe capital-gains tax (a 1031 exchange can defer both). Figures are a year-1 estimate at your 24.0% rate — not tax advice; consult a CPA.
Schools (NCES district)
- District
- Gary Community School Corporation
- NCES district ID
- 1803870
- Math proficiency
- 3% ▼ -10.00%
- Reading proficiency
- 11% ▼ -6.00%
- Median HH income
- $27,739
- Composite
- 4.98/100
- National rank
- #10039
- State rank
- #299 of 301 in IN
Livability — Gary
- Score
- 73/100
- State rank
- #105
- US rank
- #5592
Category grades
Schools grade is shown separately in the Schools card above.
Census & demographics
- Census place
- Gary, IN
- County
- Lake County · 422,878 people
- City population
- 63,701
- Metro
- Chicago-Naperville-Elgin, IL-IN-WI
- Population (ZIP)
- 8,577
- Household income
- $28,526
- Rent vs Own
- Severe rent burden
- 392.0
Population outlook (Lake County) Hauer SSP2
- Today (2025)
- 484,026 people
- By 2030
- 478,091 · -1.2%
- By 2040
- 462,974 · -4.3%
- By 2050
- 449,894 · -7.1%
- By 2075
- 436,169 · -9.9%
- By 2100
- 426,607 · -11.9%
Race, ethnicity, and origin ACS 2023
- Neighborhood character
- Predominantly Black (91%)
- Race & ethnicity
- Black 91% Hispanic / Latino 3% White 2% Two or more races 1%
- Common ancestry
- Romanian 1%
- Foreign-born
- 1% · Canada
- Languages at home
- 97% English-only · Spanish 1% Russian/Polish/Slavic 1% French/Haitian/Cajun 1%
Political lean MEDSL · Lake
- 2024 margin
- Lean D (+5.6) · D 52.1% · R 46.5% · Other 1.5%
- 2008→2024 swing
- -28.6pp toward R · 2008: 34.3pp · 2024: 5.6pp
- All cycles
- 2024: D+5.6 2020: D+15.1 2016: D+20.6 2012: D+31.0 2008: D+34.3
Not yet ingested
- Civics
- —
Market trends
- HPI YoY
- ▲ 0.98%
- Current HPI
- 253.2856
- Rent YoY
- —
- Metro
- Chicago-Naperville-Elgin, IL-IN-WI
- State GDP YoY
- ▲ 2.90%
- F500 in state
- 18
Industry mix (Fortune 500 HQ in IN)
| Industry | F500 HQs | Revenue |
|---|---|---|
| Industrial Machinery | 2 | $37B |
|
||
| Healthcare | 1 | $177B |
|
||
| Pharmaceuticals | 1 | $45B |
|
||
| Metals / Steel | 1 | $18B |
|
||
| Agriculture | 1 | $17B |
|
||
| Packaging | 1 | $12B |
|
||
Price history
+159.0% since first listed6 events — show timeline
- 2026-05-26 Listed $129,500 NIRA MLS as Distributed by MLS Grid
- 2025-06-01 Rental Removed $1,295 BUILDIUM
- 2025-05-21 Listed for Rent $1,295 BUILDIUM
- 2024-11-22 Sold (MLS) $43,000 NIRA MLS as Distributed by MLS Grid
- 2024-10-26 Pending — NIRA MLS as Distributed by MLS Grid
- 2024-10-12 Listed $50,000 NIRA MLS as Distributed by MLS Grid
Property tax history
-7.1%/yrLatest (2024): $730 · +5.6% YoY. Source: county tax records.
Cash-flow waterfall
monthlySold comps — $/sqft
last 12 mo · ≤1 miLoading sold comps…